Weitere ähnliche Inhalte
Ähnlich wie Median Sold Price Up 32% Over 2 Years
Ähnlich wie Median Sold Price Up 32% Over 2 Years (11)
Median Sold Price Up 32% Over 2 Years
- 1. Blake Taylor Taylor Real Estate
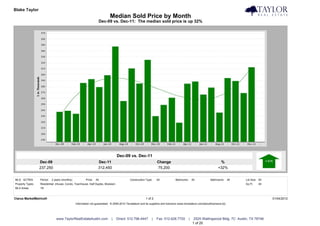
Median Sold Price by Month
Dec-09 vs. Dec-11: The median sold price is up 32%
Dec-09 vs. Dec-11
Dec-09 Dec-11 Change %
237,250 312,450 75,200 +32%
MLS: ACTRIS Period: 2 years (monthly) Price: All Construction Type: All Bedrooms: All Bathrooms: All Lot Size: All
Property Types: Residential: (House, Condo, Townhouse, Half Duplex, Modular) Sq Ft: All
MLS Areas: 1N
Clarus MarketMetrics® 1 of 2 01/04/2012
Information not guaranteed. © 2009-2010 Terradatum and its suppliers and licensors (www.terradatum.com/about/licensors.td).
www.TaylorRealEstateAustin.com | Direct: 512.796.4447 | Fax: 512.628.7720 | 2525 Wallingwood Bldg. 7C Austin, TX 78746
1 of 20
- 2. Blake Taylor Taylor Real Estate
Median Sold Price by Month
Dec-09 vs. Dec-11: The median sold price is up 32%
Time Period Median Price # Units Average DOM
Dec-11 312,450 34 65
Nov-11 269,000 26 79
Oct-11 289,375 40 83
Sep-11 294,250 34 67
Aug-11 236,000 51 43
Jul-11 278,174 64 49
Jun-11 266,500 70 43
May-11 288,358 60 64
Apr-11 284,750 46 73
Mar-11 219,000 47 91
Feb-11 261,000 26 73
Jan-11 249,000 16 89
Dec-10 230,000 29 51
Nov-10 325,000 34 62
Oct-10 285,000 29 82
Sep-10 310,500 34 63
Aug-10 255,500 40 62
Jul-10 347,500 39 63
Jun-10 299,000 46 61
May-10 279,000 57 45
Apr-10 292,500 55 63
Mar-10 285,990 37 58
Feb-10 234,000 21 59
Jan-10 239,000 17 75
Dec-09 237,250 30 61
Clarus MarketMetrics® 2 of 2 01/04/2012
Information not guaranteed. © 2009-2010 Terradatum and its suppliers and licensors (www.terradatum.com/about/licensors.td).
www.TaylorRealEstateAustin.com | Direct: 512.796.4447 | Fax: 512.628.7720 | 2525 Wallingwood Bldg. 7C Austin, TX 78746
2 of 20
- 3. Blake Taylor Taylor Real Estate
Median For Sale vs. Median Sold
Dec-09 vs. Dec-11: The median price of for sale properties is down 2% and the median price of sold properties is up 32%
Dec-09 vs. Dec-11 Dec-09 vs. Dec-11
Dec-09 Dec-11 Change % Dec-09 Dec-11 Change %
299,900 295,000 -4,900 -2% 237,250 312,450 75,200 +32%
MLS: ACTRIS Period: 2 years (monthly) Price: All Construction Type: All Bedrooms: All Bathrooms: All Lot Size: All
Property Types: Residential: (House, Condo, Townhouse, Half Duplex, Modular) Sq Ft: All
MLS Areas: 1N
Clarus MarketMetrics® 1 of 2 01/04/2012
Information not guaranteed. © 2009-2010 Terradatum and its suppliers and licensors (www.terradatum.com/about/licensors.td).
www.TaylorRealEstateAustin.com | Direct: 512.796.4447 | Fax: 512.628.7720 | 2525 Wallingwood Bldg. 7C Austin, TX 78746
3 of 20
- 4. Blake Taylor Taylor Real Estate
Median For Sale vs. Median Sold
Dec-09 vs. Dec-11: The median price of for sale properties is down 2% and the median price of sold properties is up 32%
For Sale # Properties Sold # Properties Price
Time Period Median For Sale Median Sold Difference
Dec-11 295,000 169 312,450 34 17,450
Nov-11 279,900 195 269,000 26 -10,900
Oct-11 299,000 205 289,375 40 -9,625
Sep-11 276,750 230 294,250 34 17,500
Aug-11 279,900 245 236,000 51 -43,900
Jul-11 284,500 265 278,174 64 -6,327
Jun-11 291,396 269 266,500 70 -24,896
May-11 269,825 282 288,358 60 18,532
Apr-11 288,200 270 284,750 46 -3,450
Mar-11 267,500 244 219,000 47 -48,500
Feb-11 259,700 218 261,000 26 1,300
Jan-11 260,000 209 249,000 16 -11,000
Dec-10 265,950 220 230,000 29 -35,950
Nov-10 267,250 230 325,000 34 57,750
Oct-10 278,225 260 285,000 29 6,775
Sep-10 286,211 272 310,500 34 24,289
Aug-10 280,000 291 255,500 40 -24,500
Jul-10 279,000 311 347,500 39 68,500
Jun-10 279,900 308 299,000 46 19,100
May-10 294,900 275 279,000 57 -15,900
Apr-10 289,700 286 292,500 55 2,800
Mar-10 295,000 245 285,990 37 -9,010
Feb-10 289,950 200 234,000 21 -55,950
Jan-10 276,000 182 239,000 17 -37,000
Dec-09 299,900 165 237,250 30 -62,650
Clarus MarketMetrics® 2 of 2 01/04/2012
Information not guaranteed. © 2009-2010 Terradatum and its suppliers and licensors (www.terradatum.com/about/licensors.td).
www.TaylorRealEstateAustin.com | Direct: 512.796.4447 | Fax: 512.628.7720 | 2525 Wallingwood Bldg. 7C Austin, TX 78746
4 of 20
- 5. Blake Taylor Taylor Real Estate
Sold Properties by Month
Dec-09 vs. Dec-11: The number of Sold properties is up 13%
Dec-09 vs. Dec-11
Dec-09 Dec-11 Change %
30 34 4 +13%
MLS: ACTRIS Period: 2 years (monthly) Price: All Construction Type: All Bedrooms: All Bathrooms: All Lot Size: All
Property Types: Residential: (House, Condo, Townhouse, Half Duplex, Modular) Sq Ft: All
MLS Areas: 1N
Clarus MarketMetrics® 1 of 2 01/04/2012
Information not guaranteed. © 2009-2010 Terradatum and its suppliers and licensors (www.terradatum.com/about/licensors.td).
www.TaylorRealEstateAustin.com | Direct: 512.796.4447 | Fax: 512.628.7720 | 2525 Wallingwood Bldg. 7C Austin, TX 78746
5 of 20
- 6. Blake Taylor Taylor Real Estate
Sold Properties by Month
Dec-09 vs. Dec-11: The number of Sold properties is up 13%
Full Market Bank Properties Non-Bank Properties
Time Period # Properties Median Price Average DOM # Properties % Bank Median Price # Properties % Non-Bank Median Price
Dec-11 34 312,450 65 1 2.9 192,500 33 97.1 319,900
Nov-11 26 269,000 79 2 7.7 288,950 24 92.3 269,000
Oct-11 40 289,375 83 0 40 100.0 289,375
Sep-11 34 294,250 67 4 11.8 219,750 30 88.2 298,000
Aug-11 51 236,000 43 1 2.0 155,000 50 98.0 238,500
Jul-11 64 278,174 49 3 4.7 330,000 61 95.3 276,347
Jun-11 70 266,500 43 2 2.9 243,600 68 97.1 269,000
May-11 60 288,358 64 3 5.0 165,000 57 95.0 290,000
Apr-11 46 284,750 73 4 8.7 214,500 42 91.3 289,750
Mar-11 47 219,000 91 2 4.3 214,000 45 95.7 219,000
Feb-11 26 261,000 73 1 3.9 193,000 25 96.2 262,000
Jan-11 16 249,000 89 2 12.5 152,000 14 87.5 271,000
Dec-10 29 230,000 51 2 6.9 133,250 27 93.1 232,500
Nov-10 34 325,000 62 1 2.9 320,000 33 97.1 327,000
Oct-10 29 285,000 82 2 6.9 134,950 27 93.1 287,500
Sep-10 34 310,500 63 1 2.9 108,000 33 97.1 316,000
Aug-10 40 255,500 62 2 5.0 133,750 38 95.0 265,345
Jul-10 39 347,500 63 3 7.7 159,500 36 92.3 351,250
Jun-10 46 299,000 61 0 46 100.0 299,000
May-10 57 279,000 45 0 57 100.0 279,000
Apr-10 55 292,500 63 3 5.5 285,000 52 94.5 296,200
Mar-10 37 285,990 58 0 37 100.0 285,990
Feb-10 21 234,000 59 0 21 100.0 234,000
Jan-10 17 239,000 75 0 17 100.0 239,000
Dec-09 30 237,250 61 0 30 100.0 237,250
Clarus MarketMetrics® 2 of 2 01/04/2012
Information not guaranteed. © 2009-2010 Terradatum and its suppliers and licensors (www.terradatum.com/about/licensors.td).
www.TaylorRealEstateAustin.com | Direct: 512.796.4447 | Fax: 512.628.7720 | 2525 Wallingwood Bldg. 7C Austin, TX 78746
6 of 20
- 7. Blake Taylor Taylor Real Estate
Under Contract Properties by Month
Dec-09 vs. Dec-11: The number of Under Contract properties is up 159%
Dec-09 vs. Dec-11
Dec-09 Dec-11 Change %
17 44 27 +159%
MLS: ACTRIS Period: 2 years (monthly) Price: All Construction Type: All Bedrooms: All Bathrooms: All Lot Size: All
Property Types: Residential: (House, Condo, Townhouse, Half Duplex, Modular) Sq Ft: All
MLS Areas: 1N
Clarus MarketMetrics® 1 of 2 01/04/2012
Information not guaranteed. © 2009-2010 Terradatum and its suppliers and licensors (www.terradatum.com/about/licensors.td).
www.TaylorRealEstateAustin.com | Direct: 512.796.4447 | Fax: 512.628.7720 | 2525 Wallingwood Bldg. 7C Austin, TX 78746
7 of 20
- 8. Blake Taylor Taylor Real Estate
Under Contract Properties by Month
Dec-09 vs. Dec-11: The number of Under Contract properties is up 159%
Full Market Bank Properties Non-Bank Properties
Time Period # Properties Median Price Average DOM # Properties % Bank Median Price # Properties % Non-Bank Median Price
Dec-11 44 279,900 87 2 4.5 122,500 42 95.5 283,700
Nov-11 40 294,950 67 4 10.0 250,950 36 90.0 294,950
Oct-11 27 329,000 88 2 7.4 303,500 25 92.6 329,000
Sep-11 37 291,396 70 1 2.7 174,900 36 97.3 295,698
Aug-11 37 290,000 55 2 5.4 127,400 35 94.6 299,000
Jul-11 50 247,250 57 3 6.0 309,900 47 94.0 245,000
Jun-11 60 319,950 45 3 5.0 334,900 57 95.0 315,000
May-11 68 263,950 47 2 2.9 241,900 66 97.1 268,750
Apr-11 61 319,900 73 2 3.3 249,950 59 96.7 319,900
Mar-11 47 243,900 63 2 4.3 206,000 45 95.7 243,900
Feb-11 41 259,000 93 3 7.3 163,620 38 92.7 267,000
Jan-11 29 274,900 74 1 3.5 199,900 28 96.5 291,200
Dec-10 23 224,900 69 2 8.7 189,900 21 91.3 237,500
Nov-10 25 245,000 49 2 8.0 134,900 23 92.0 269,000
Oct-10 36 333,500 56 2 5.6 242,350 34 94.4 339,450
Sep-10 31 309,500 76 2 6.5 137,400 29 93.5 319,950
Aug-10 41 299,990 64 3 7.3 99,800 38 92.7 299,990
Jul-10 42 277,900 79 1 2.4 179,400 41 97.6 279,900
Jun-10 36 359,450 59 1 2.8 129,000 35 97.2 359,900
May-10 27 310,000 54 2 7.4 259,950 25 92.6 310,000
Apr-10 78 259,950 53 0 78 100.0 259,950
Mar-10 51 339,000 59 2 3.9 332,400 49 96.1 339,000
Feb-10 30 289,500 61 1 3.3 126,000 29 96.7 290,000
Jan-10 27 249,900 55 0 27 100.0 249,900
Dec-09 17 239,900 87 0 17 100.0 239,900
Clarus MarketMetrics® 2 of 2 01/04/2012
Information not guaranteed. © 2009-2010 Terradatum and its suppliers and licensors (www.terradatum.com/about/licensors.td).
www.TaylorRealEstateAustin.com | Direct: 512.796.4447 | Fax: 512.628.7720 | 2525 Wallingwood Bldg. 7C Austin, TX 78746
8 of 20
- 9. Blake Taylor Taylor Real Estate
New Properties by Month
Dec-09 vs. Dec-11: The number of New properties is up 30%
Dec-09 vs. Dec-11
Dec-09 Dec-11 Change %
27 35 8 +30%
MLS: ACTRIS Period: 2 years (monthly) Price: All Construction Type: All Bedrooms: All Bathrooms: All Lot Size: All
Property Types: Residential: (House, Condo, Townhouse, Half Duplex, Modular) Sq Ft: All
MLS Areas: 1N
Clarus MarketMetrics® 1 of 2 01/04/2012
Information not guaranteed. © 2009-2010 Terradatum and its suppliers and licensors (www.terradatum.com/about/licensors.td).
www.TaylorRealEstateAustin.com | Direct: 512.796.4447 | Fax: 512.628.7720 | 2525 Wallingwood Bldg. 7C Austin, TX 78746
9 of 20
- 10. Blake Taylor Taylor Real Estate
New Properties by Month
Dec-09 vs. Dec-11: The number of New properties is up 30%
Full Market Bank Properties Non-Bank Properties
Time Period # Properties Median Price # Properties % Bank Median Price # Properties % Non-Bank Median Price
Dec-11 35 369,000 1 2.9 249,000 34 97.1 373,950
Nov-11 42 279,900 3 7.1 122,900 39 92.9 308,000
Oct-11 40 329,500 3 7.5 125,000 37 92.5 389,000
Sep-11 44 257,875 1 2.3 195,000 43 97.7 265,000
Aug-11 48 242,425 1 2.1 89,900 47 97.9 249,950
Jul-11 86 273,250 5 5.8 250,000 81 94.2 274,000
Jun-11 79 319,000 1 1.3 334,900 78 98.7 317,950
May-11 85 268,000 4 4.7 214,950 81 95.3 269,500
Apr-11 94 329,700 3 3.2 228,900 91 96.8 334,961
Mar-11 78 316,950 1 1.3 487,000 77 98.7 305,000
Feb-11 52 264,000 3 5.8 266,000 49 94.2 262,000
Jan-11 41 250,000 2 4.9 227,400 39 95.1 250,000
Dec-10 41 264,900 0 41 100.0 264,900
Nov-10 38 238,500 3 7.9 163,620 35 92.1 239,900
Oct-10 54 268,750 4 7.4 152,900 50 92.6 277,500
Sep-10 54 297,450 2 3.7 217,450 52 96.3 297,450
Aug-10 61 255,000 3 4.9 144,900 58 95.1 276,138
Jul-10 66 294,700 0 66 100.0 294,700
Jun-10 80 237,450 3 3.8 225,000 77 96.2 239,900
May-10 75 279,000 2 2.7 239,450 73 97.3 279,000
Apr-10 109 299,900 1 0.9 359,900 108 99.1 294,900
Mar-10 92 299,500 2 2.2 269,950 90 97.8 299,500
Feb-10 56 352,000 1 1.8 216,600 55 98.2 354,000
Jan-10 60 238,450 2 3.3 360,950 58 96.7 236,000
Dec-09 27 256,000 2 7.4 192,350 25 92.6 256,000
Clarus MarketMetrics® 2 of 2 01/04/2012
Information not guaranteed. © 2009-2010 Terradatum and its suppliers and licensors (www.terradatum.com/about/licensors.td).
www.TaylorRealEstateAustin.com | Direct: 512.796.4447 | Fax: 512.628.7720 | 2525 Wallingwood Bldg. 7C Austin, TX 78746
10 of 20
- 11. Blake Taylor Taylor Real Estate
For Sale Properties by Month
Dec-09 vs. Dec-11: The number of For Sale properties is up 2%
Dec-09 vs. Dec-11
Dec-09 Dec-11 Change %
165 169 4 +2%
MLS: ACTRIS Period: 2 years (monthly) Price: All Construction Type: All Bedrooms: All Bathrooms: All Lot Size: All
Property Types: Residential: (House, Condo, Townhouse, Half Duplex, Modular) Sq Ft: All
MLS Areas: 1N
Clarus MarketMetrics® 1 of 2 01/04/2012
Information not guaranteed. © 2009-2010 Terradatum and its suppliers and licensors (www.terradatum.com/about/licensors.td).
www.TaylorRealEstateAustin.com | Direct: 512.796.4447 | Fax: 512.628.7720 | 2525 Wallingwood Bldg. 7C Austin, TX 78746
11 of 20
- 12. Blake Taylor Taylor Real Estate
For Sale Properties by Month
Dec-09 vs. Dec-11: The number of For Sale properties is up 2%
Full Market Bank Properties Non-Bank Properties
Time Period # Properties Median Price Average DOM # Properties % Bank Median Price # Properties % Non-Bank Median Price
Dec-11 169 295,000 105 7 4.1 245,000 162 95.9 302,500
Nov-11 195 279,900 104 10 5.1 195,450 185 94.9 287,500
Oct-11 205 299,000 105 9 4.4 250,000 196 95.6 299,995
Sep-11 230 276,750 98 7 3.0 260,000 223 97.0 279,000
Aug-11 245 279,900 91 9 3.7 250,000 236 96.3 284,635
Jul-11 265 284,500 81 11 4.2 260,000 254 95.8 284,635
Jun-11 269 291,396 84 9 3.4 309,900 260 96.7 290,673
May-11 282 269,825 82 10 3.5 257,450 272 96.5 269,975
Apr-11 270 288,200 86 8 3.0 282,400 262 97.0 288,200
Mar-11 244 267,500 98 8 3.3 260,450 236 96.7 268,500
Feb-11 218 259,700 111 10 4.6 239,950 208 95.4 259,950
Jan-11 209 260,000 111 8 3.8 212,450 201 96.2 267,000
Dec-10 220 265,950 109 8 3.6 189,900 212 96.4 267,750
Nov-10 230 267,250 102 10 4.3 174,260 220 95.7 274,000
Oct-10 260 278,225 91 9 3.5 184,900 251 96.5 279,000
Sep-10 272 286,211 92 7 2.6 225,000 265 97.4 287,500
Aug-10 291 280,000 87 8 2.8 194,950 283 97.2 284,777
Jul-10 311 279,000 83 6 1.9 274,950 305 98.1 279,000
Jun-10 308 279,900 76 7 2.3 225,000 301 97.7 279,900
May-10 275 294,900 71 8 2.9 249,750 267 97.1 295,000
Apr-10 286 289,700 64 6 2.1 249,750 280 97.9 289,900
Mar-10 245 295,000 73 7 2.9 282,900 238 97.1 299,250
Feb-10 200 289,950 81 6 3.0 249,750 194 97.0 297,250
Jan-10 182 276,000 83 5 2.8 282,900 177 97.2 275,000
Dec-09 165 299,900 95 3 1.8 126,000 162 98.2 299,945
Clarus MarketMetrics® 2 of 2 01/04/2012
Information not guaranteed. © 2009-2010 Terradatum and its suppliers and licensors (www.terradatum.com/about/licensors.td).
www.TaylorRealEstateAustin.com | Direct: 512.796.4447 | Fax: 512.628.7720 | 2525 Wallingwood Bldg. 7C Austin, TX 78746
12 of 20
- 13. Blake Taylor Taylor Real Estate
Expired Properties by Month
Dec-09 vs. Dec-11: The number of Expired properties is down 8%
Dec-09 vs. Dec-11
Dec-09 Dec-11 Change %
26 24 -2 -8%
MLS: ACTRIS Period: 2 years (monthly) Price: All Construction Type: All Bedrooms: All Bathrooms: All Lot Size: All
Property Types: Residential: (House, Condo, Townhouse, Half Duplex, Modular) Sq Ft: All
MLS Areas: 1N
Clarus MarketMetrics® 1 of 2 01/04/2012
Information not guaranteed. © 2009-2010 Terradatum and its suppliers and licensors (www.terradatum.com/about/licensors.td).
www.TaylorRealEstateAustin.com | Direct: 512.796.4447 | Fax: 512.628.7720 | 2525 Wallingwood Bldg. 7C Austin, TX 78746
13 of 20
- 14. Blake Taylor Taylor Real Estate
Expired Properties by Month
Dec-09 vs. Dec-11: The number of Expired properties is down 8%
Full Market Bank Properties Non-Bank Properties
Time Period # Properties Median Price Average DOM # Properties % Bank Median Price # Properties % Non-Bank Median Price
Dec-11 24 287,450 152 2 8.3 255,000 22 91.7 297,495
Nov-11 21 279,900 160 0 21 100.0 279,900
Oct-11 25 395,000 134 0 25 100.0 395,000
Sep-11 28 241,450 109 0 28 100.0 241,450
Aug-11 22 258,500 111 1 4.5 99,900 21 95.5 262,000
Jul-11 18 304,950 113 0 18 100.0 304,950
Jun-11 30 294,250 128 0 30 100.0 294,250
May-11 24 278,450 124 0 24 100.0 278,450
Apr-11 12 307,425 103 0 12 100.0 307,425
Mar-11 21 269,000 148 1 4.8 225,000 20 95.2 274,500
Feb-11 11 234,500 137 0 11 100.0 234,500
Jan-11 14 258,500 93 0 14 100.0 258,500
Dec-10 29 279,000 141 0 29 100.0 279,000
Nov-10 26 274,500 136 0 26 100.0 274,500
Oct-10 32 274,675 117 0 32 100.0 274,675
Sep-10 35 295,000 134 0 35 100.0 295,000
Aug-10 32 244,950 124 0 32 100.0 244,950
Jul-10 39 249,900 99 0 39 100.0 249,900
Jun-10 27 299,990 94 0 27 100.0 299,990
May-10 20 279,950 86 2 10.0 249,750 18 90.0 292,500
Apr-10 8 283,450 130 0 8 100.0 283,450
Mar-10 17 269,900 108 0 17 100.0 269,900
Feb-10 17 350,000 87 0 17 100.0 350,000
Jan-10 11 349,860 120 0 11 100.0 349,860
Dec-09 26 319,230 115 0 26 100.0 319,230
Clarus MarketMetrics® 2 of 2 01/04/2012
Information not guaranteed. © 2009-2010 Terradatum and its suppliers and licensors (www.terradatum.com/about/licensors.td).
www.TaylorRealEstateAustin.com | Direct: 512.796.4447 | Fax: 512.628.7720 | 2525 Wallingwood Bldg. 7C Austin, TX 78746
14 of 20
- 15. Blake Taylor Taylor Real Estate
Supply & Demand by Month
Dec-09 vs. Dec-11: The number of for sale properties is up 2% and the number of sold properties is up 13%
Dec-09 vs. Dec-11 Dec-09 vs. Dec-11
Dec-09 Dec-11 Change % Dec-09 Dec-11 Change %
165 169 4 +2% 30 34 4 +13%
MLS: ACTRIS Period: 2 years (monthly) Price: All Construction Type: All Bedrooms: All Bathrooms: All Lot Size: All
Property Types: Residential: (House, Condo, Townhouse, Half Duplex, Modular) Sq Ft: All
MLS Areas: 1N
Clarus MarketMetrics® 1 of 2 01/04/2012
Information not guaranteed. © 2009-2010 Terradatum and its suppliers and licensors (www.terradatum.com/about/licensors.td).
www.TaylorRealEstateAustin.com | Direct: 512.796.4447 | Fax: 512.628.7720 | 2525 Wallingwood Bldg. 7C Austin, TX 78746
15 of 20
- 16. Blake Taylor Taylor Real Estate
Supply & Demand by Month
Dec-09 vs. Dec-11: The number of for sale properties is up 2% and the number of sold properties is up 13%
# Properties Average DOM # Properties Average DOM
Time Period For Sale For Sale Sold Sold
Dec-11 169 105 34 65
Nov-11 195 104 26 79
Oct-11 205 105 40 83
Sep-11 230 98 34 67
Aug-11 245 91 51 43
Jul-11 265 81 64 49
Jun-11 269 84 70 43
May-11 282 82 60 64
Apr-11 270 86 46 73
Mar-11 244 98 47 91
Feb-11 218 111 26 73
Jan-11 209 111 16 89
Dec-10 220 109 29 51
Nov-10 230 102 34 62
Oct-10 260 91 29 82
Sep-10 272 92 34 63
Aug-10 291 87 40 62
Jul-10 311 83 39 63
Jun-10 308 76 46 61
May-10 275 71 57 45
Apr-10 286 64 55 63
Mar-10 245 73 37 58
Feb-10 200 81 21 59
Jan-10 182 83 17 75
Dec-09 165 95 30 61
Clarus MarketMetrics® 2 of 2 01/04/2012
Information not guaranteed. © 2009-2010 Terradatum and its suppliers and licensors (www.terradatum.com/about/licensors.td).
www.TaylorRealEstateAustin.com | Direct: 512.796.4447 | Fax: 512.628.7720 | 2525 Wallingwood Bldg. 7C Austin, TX 78746
16 of 20
- 17. Blake Taylor Taylor Real Estate
The Average Days on Market by Month
Dec-09 vs. Dec-11: The average days on market is down 1%
Dec-09 vs. Dec-11
Dec-09 Dec-11 Change %
87 87 -1 -1%
MLS: ACTRIS Period: 2 years (monthly) Price: All Construction Type: All Bedrooms: All Bathrooms: All Lot Size: All
Property Types: Residential: (House, Condo, Townhouse, Half Duplex, Modular) Sq Ft: All
MLS Areas: 1N
Clarus MarketMetrics® 1 of 2 01/04/2012
Information not guaranteed. © 2009-2010 Terradatum and its suppliers and licensors (www.terradatum.com/about/licensors.td).
www.TaylorRealEstateAustin.com | Direct: 512.796.4447 | Fax: 512.628.7720 | 2525 Wallingwood Bldg. 7C Austin, TX 78746
17 of 20
- 18. Blake Taylor Taylor Real Estate
The Average Days on Market by Month
Dec-09 vs. Dec-11: The average days on market is down 1%
Time Period Average DOM # UC Units
Dec-11 87 44
Nov-11 67 40
Oct-11 88 27
Sep-11 70 37
Aug-11 55 37
Jul-11 57 50
Jun-11 45 60
May-11 47 68
Apr-11 73 61
Mar-11 63 47
Feb-11 93 41
Jan-11 74 29
Dec-10 69 23
Nov-10 49 25
Oct-10 56 36
Sep-10 76 31
Aug-10 64 41
Jul-10 79 42
Jun-10 59 36
May-10 54 27
Apr-10 53 78
Mar-10 59 51
Feb-10 61 30
Jan-10 55 27
Dec-09 87 17
Clarus MarketMetrics® 2 of 2 01/04/2012
Information not guaranteed. © 2009-2010 Terradatum and its suppliers and licensors (www.terradatum.com/about/licensors.td).
www.TaylorRealEstateAustin.com | Direct: 512.796.4447 | Fax: 512.628.7720 | 2525 Wallingwood Bldg. 7C Austin, TX 78746
18 of 20
- 19. Blake Taylor Taylor Real Estate
Months Supply of Inventory
Dec-09 vs. Dec-11: The average months supply of inventory is down 68%
Dec-09 vs. Dec-11
Dec-09 Dec-11 Change %
7.2 2.3 -4.9 -68%
MLS: ACTRIS Period: 2 years (monthly) Price: All Construction Type: All Bedrooms: All Bathrooms: All Lot Size: All
Property Types: Residential: (House, Condo, Townhouse, Half Duplex, Modular) Sq Ft: All
MLS Areas: 1N
Clarus MarketMetrics® 1 of 2 01/04/2012
Information not guaranteed. © 2009-2010 Terradatum and its suppliers and licensors (www.terradatum.com/about/licensors.td).
www.TaylorRealEstateAustin.com | Direct: 512.796.4447 | Fax: 512.628.7720 | 2525 Wallingwood Bldg. 7C Austin, TX 78746
19 of 20
- 20. Blake Taylor Taylor Real Estate
Months Supply of Inventory
Dec-09 vs. Dec-11: The average months supply of inventory is down 68%
# Units For Sale # UC Units UC Average
Time Period Last Day of Month During Month MSI DOM
Dec-11 101 44 2.3 87
Nov-11 134 40 3.4 67
Oct-11 153 27 5.7 88
Sep-11 165 37 4.5 70
Aug-11 186 37 5.0 55
Jul-11 197 50 3.9 57
Jun-11 179 60 3.0 45
May-11 190 68 2.8 47
Apr-11 197 61 3.2 73
Mar-11 176 47 3.7 63
Feb-11 166 41 4.0 93
Jan-11 166 29 5.7 74
Dec-10 168 23 7.3 69
Nov-10 179 25 7.2 49
Oct-10 192 36 5.3 56
Sep-10 206 31 6.6 76
Aug-10 218 41 5.3 64
Jul-10 230 42 5.5 79
Jun-10 245 36 6.8 59
May-10 228 27 8.4 54
Apr-10 200 78 2.6 53
Mar-10 177 51 3.5 59
Feb-10 153 30 5.1 61
Jan-10 144 27 5.3 55
Dec-09 122 17 7.2 87
Clarus MarketMetrics® 2 of 2 01/04/2012
Information not guaranteed. © 2009-2010 Terradatum and its suppliers and licensors (www.terradatum.com/about/licensors.td).
www.TaylorRealEstateAustin.com | Direct: 512.796.4447 | Fax: 512.628.7720 | 2525 Wallingwood Bldg. 7C Austin, TX 78746
20 of 20