2. ASUSTAINABLE RESOURCE
DEVELOPMENT
Composite Visibility Analysis Procedure
1. Introduction
There is often a need in strategic land management to take into account the visual
aesthetics of an area. Particularly of importance are those areas that are heavily travelled
by the public or used for recreation and tourism purposes.
In the past, project areas have been surveyed by someone with experience in evaluating
visual quality objectives. These people then subjectively stratify the land into Visual
Quality Objective zones. Select viewpoints were then chosen for a more rigorous
analysis. The ability to do a running viewshed analysis that simulates the experience of
the public while driving through an area was limited by processing speed and capacity.
These technical issues are now largely irrelevant – computers are now very fast and data
storage is cheap.
By selecting a large volume of viewpoints along travel corridors and other high use areas
one can hope to estimate an overall picture of the visibility of topographic features over
the entire project area. The quality of the output visibility analysis is directly related to
the quality of the digital elevation model (DEM) used as the analysis base and the
number of viewpoints that are modeled.
2. Required Input Data
To do a basic composite visibility analysis there are very few input data requirements:
§ Digital Elevation Model – A raster (Grid) dataset containing elevation values.
§ Travel corridors – Preferably a vector arc dataset with features logically grouped
together.
§ Supplemental viewpoints and areas/trails of interest – This could be vector arcs
and/or point layers.
Optional:
§ If it were desired to simulate screening by vegetation, it would be necessary to
generate a raster layer containing vegetation heights as values. This would need to be
the same resolution as the DEM. A new DEM would then be generated by adding on
the vegetation heights.
3. Methodology
The overall analysis requires very few steps, with the effort mostly being on compiling
the input viewpoint layer(s). The bulk of time will be spent simply processing the data –
this can largely be batched. Note: The specific commands referenced are ArcInfo
Workstation commands.
1. Define your project boundary.
3. ASUSTAINABLE RESOURCE
DEVELOPMENT
2. Decide what your maximum search radius will be for the visibility analysis. Do you
want the software to search to infinity or do you just want that area that is close
enough to have a noticeable visual impact?
3. Buffer your project boundary by the maximum search radius distance. Remember
that your project area is potentially visible from outside as well as inside the
boundary.
4. Compile all input features of interest (travel corridors, campsites, lodges, trails, etc)
for within the maximum search radius outside of the project area. Either create
composite arc and point layers or create individual layers for each logical grouping.
These logical groupings should take into account how you may wish to display or
summarize the analysis output. The groupings should also help to limit the total
number of viewpoints being run through each analysis batch.
5. If input features are in composite layer(s) then separate out into logical group layers.
6. For each logical group arc layer, generate viewpoint layers. This can be automated
by running the DENSIFYARC command and dumping out the new nodes to a point
layer using the NODEPOINT command.
7. Add VISIBILITY command input fields to the viewpoint layer(s) and populate with
desired values. Note that height and distance units are the same as the input data
layers. The possible fields are:
§ SPOT – Specifies the surface elevation for the observation point. If no SPOT
item is present, the surface elevation is interpolated from the input DEM using
a bilinear interpolation.
§ OFFSETA – A vertical offset height to be added to the elevation of the
observation point. This value must be positive. The default value is 1.
§ OFFSETB – A vertical offset height to be added to the elevation of each mesh
point considered for visibility. The default value is zero.
§ AZIMUTH1 – Specifies a minimum horizontal angle limit to the scan. The
default is zero degrees.
§ AZIMUTH2 – Specifies a maximum horizontal angle limite to the scan. The
default is 360 degrees.
§ VERT1 – Specifies an upper vertical angle limit to the scan. The maximum
allowed value is 90 degrees. The default value is 90.
4. ASUSTAINABLE RESOURCE
DEVELOPMENT
§ VERT2 – Specifies a lower vertical angle limit to the scan. The minimum
allowed value is –90 degrees. The default value is –90.
§ RADIUS1 – Specifies the minimum search radius from the viewpoint, as a
line-of-sight distance. The default value is zero.
§ RADIUS2 – Specifies the maximum search radius from the viewpoint, as a
line-of-sight distance. The default is infinity.
8. Run each viewpoint layer through the VISIBILITY command. The visibility of each
mesh point is determined by comparing the altitude angle to the mesh point with the
altitude angle to the local horizon. The local horizon is computed by considering the
intervening terrain between the point of observation and the current mesh point. If
the point lies above the local horizon it is considered to be visible. [Note: By default,
the VISIBILITY command does not correct for the curvature of the earth.] There are
a variety of settings for the VISIBILITY command:
§ SYNTAX: VISIBILITY <in_lattice> <in_cover> <POINT | LINE>
<out_cover | out_grid> {POLY | GRID} {FREQUENCY | OBSERVERS}
§ <in_lattice> - Input DEM grid/lattice.
§ <in_cover> - Input coverage containing point or line features used as
observation points.
§ <POINT | LINE> - The type of <in_cover> features used as observation point.
POINT means that the input layer is composed of individual viewpoints.
LINE means that every node and vertex of the input layer will be processed as
an observation point. Note that over a large study area that could mean
substantially more viewpoints than using the DENSIFYARC approach.
§ <out_cover | out_grid> - The name of the output dataset to be created.
§ {POLY | GRID} – The type of output to be created. POLY mean that the output
will be grouped into polygons with common values. GRID means that the
output will be an integer grid.
§ {FREQUENCY | OBSERVERS} – Specifies the type of visibility analysis to be
performed. The FREQUENCY option will record the number of times each
output polygon or grid cell can be seen by the <in_cover> observation points.
There is no limit on the number of observation points with the FREQUENCY
option. The OBSERVERS option will contain a binary-encoded value which
5. ASUSTAINABLE RESOURCE
DEVELOPMENT
can be decoded to identify the <in_cover># of each observation point that can
see that cell or polygon. The OBSERVERS option is only available with the
Point option and when the number of observations is 16 or less.
9. Add feature group visibility outputs together if a composite layer for the area is
desired. This is straightforward for grid outputs, not as straightforward for polygon
outputs.
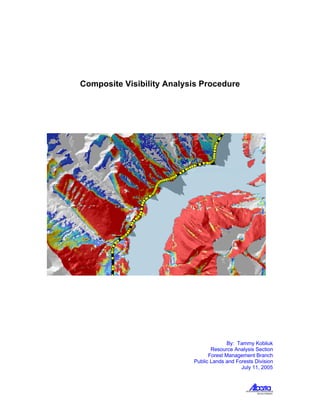
Sample grid output for a single viewpoint displayed over a hillshade of the DEM.
4. Issues and Considerations
1. DEM resolution - The input DEM should be of sufficient resolution to properly
represent the topography of the area, but not so detailed as to encumber the analysis.
For a regional area, a 25m or 30m DEM may be considered.
2. Total number of viewpoints – The total number of viewpoints to be analysed should
be of a sufficient density to properly represent the use of the project area, but should
be somewhat limited by the technical processing capabilities of the computer used.
3. Density of viewpoints - The density of the viewpoints should be limited by the
resolution of the DEM. There is no real need to run more than one viewpoint per
DEM cell.
4. Batching of processing – Depending on the overall number of viewpoints in an area,
and how the outputs are going to be used, it may be desireable to batch the processing
into logical viewpoint groups. It is not recommended that any viewpoint group
should exceed 1000 viewpoints since the processing time may be such that should a
problem arise it would mean the loss of days instead of hours. It is recommended that
each viewpoint group should be targeted at between 200 and 400 points. It may be
necessary to have more if a long linear feature is being analysed.
Maximum search radius
6. ASUSTAINABLE RESOURCE
DEVELOPMENT
5. Display of the output information – One should consider how the output
information is going to be displayed and used. Is only a composite layer of the entire
study area desired or are people going to be interested in seeing some of the
components that make up the overall layer (particularly major travel corridors).
These criteria will help to create the logical groupings for the analysis.
6. Maximum search radius – The maximum search radius should take into account the
reason(s) for the analysis and how the area is used. Is it an area of high recreation
and tourism potential? Is it a highly populated area? Is it an industrial forest? Are
there planned forest cover modification activities? Are there particular areas of
interest? Note that anything that is closer than 5 km is considered to be foreground or
midground. 5km to 10km is considered to be background. Anything further than
10km may not have much visual impact.
7. Height above ground – The height above ground should represent the height that
most real life observations will be made from. An observer height of 2m will
simulate a standing person or a person sitting in a truck or RV.
8. Representing screening by vegetation – There may or may not be a desire to
represent screening by vegetation. If this is desired, then a vegetation height layer
must be generated and the input “DEM” modified to incorporate these values. Note
that not all vegetation will be a solid screen and some care should be taken in this
decision so that the visibility is not underestimated. The resolution of the vegetation
layer will dictate whether or not small openings in the forest are adequately
represented. By incorporating vegetation height, it should be noted that you are
setting an effective date on the analysis related to the effective date of the input
vegetation and linear disturbance layers. Running with no vegetation effects is not as
date-sensitive. A decision would have be made as to how to deal with visibility
through open canopied vegetation.
9. Output as grid or polygon – The visibility command allows for outputs as raster or
vector. The intended use of the output layers should help to dictate the choice.
Certainly for large numbers of viewpoints, a raster layer is probably the easiest to use.
Raster outputs are also easier to manipulate after-the-fact.
5. Recommendations
§ It is recommended that the generation of input viewpoints be automated as much
as possible. On a management unit scale, there may be tens of thousands of
viewpoints generated.
§ The incorporation of vegetation heights is not recommended, at least on the first
cut. Vegetation heights are very time sensitive and would, in effect, limit the
potential use of the output to the effective date of the vegetation. Removing the
effect of vegetation allows for a “worst case scenario” of what is visible on the
landscape. Most vegetation data is either significantly dated and/or is of
insufficient spatial detail to accurately model vegetation screening.
§ Batching the analysis by grouping viewpoints into logical groups not only lowers
the risk of the failure of a multi-day process failure, but also allows for display of
the visibility along individual features and corridors.
7. ASUSTAINABLE RESOURCE
DEVELOPMENT
§ The output format recommendation is for a grid, instead of a polygon layer.
Given the complex output from running thousands of points, the raster data is
simply easier to manage, manipulate and check.
§ For doing a regional landscape visibility analysis, the FREQUENCY option should
be chosen. The FREQUENCY option tells ArcInfo to assign each output cell a value
of to how many input viewpoints it was visible.
§ The recommended maximum search radius is 10km. Those areas farther away
than 10km are deemed too distant to have a significant visual impact.
9. ASUSTAINABLE RESOURCE
DEVELOPMENT
Sample Program Code
Data Preparation AML
/*====================================================================
/* NAME: visprep.aml
/*====================================================================
/*
/* DESCRIPTION: Pulls individual roads from composite access coverage
/* and creates an associated viewpoint layer for input
/* into a composite visibility analysis.
/*
/* USAGE: &run visprep.aml
/*
/* ARGUMENTS: none
/*
/* NOTES:
/*
/*====================================================================
/*
/* PROGRAMMED BY: Tammy Kobliuk
/* PROGRAMMED FOR: Alberta Sustainable Resource Development, Public
/* Lands and Forests Division, Forest Management Branch,
/* Resource Analysis Section
/* DATE: June 28, 2005
/* LAST MODIFIED:
/*
/*====================================================================
/* ROUTINES: BAILOUT - Bails cleanly out of the aml due to an error.
/* MAKEPOINTS - Extracts feature arcs and generates feature
/* viewpoint layer(s).
/* POINTPREP - Adds required attributes to viewpoint layer(s).
/*
/*-----------------------
/* VARIABLES:
/*
/* GLOBALS: none
/*
/* LOCALS: access - source linear access layer
/* name - linear access feature name
/*
/* SYSTEM: :program - Current ArcInfo module (e.g. ArcEdit)
/*
/*====================================================================
&severity &error &routine BAILOUT
&terminal 9999
&echo &on
&setvar access = linear_clip
&call MAKEPOINTS
&call POINTPREP
&echo &off
&return &inform **** VISPREP.AML has successfully completed. ****
/*===================================================================
&routine MAKEPOINTS
/*===================================================================
/* Extracts individual roads/trails from the source access layer in
/* preparation for creating a viewpoints layer.
10. ASUSTAINABLE RESOURCE
DEVELOPMENT
/********************************************************************
/*&do name &list [listunique %access%.aat -info name]
&do name &list hwy11
&if [exists vrd_%name% -cover] &then kill vrd_%name% all
/********************************
/* Extract arcs for that feature.
/********************************
arcedit
edit %access% arc
select name = [quote %name%]
put vrd_%name%
quit
build vrd_%name% arc
/***************************
/* Remove unnecessary nodes.
/***************************
arcedit
edit vrd_%name% arc
select all
unsplit none
save
quit
/*****************************************
/* Densify nodes for viewpoint generation.
/*****************************************
densifyarc vrd_%name% # 500 arc
/***********************************
/* Generate feature viewpoint layer.
/***********************************
&if [exists vpts_%name% -cover] &then kill vpts_%name% all
nodepoint vrd_%name% vpts_%name%
build vpts_%name% point
&end /* END DO-LIST
&return
/*===================================================================
&routine POINTPREP
/*===================================================================
/* Adds and populates required items in the viewpoint layer(s).
/**************************************************************
&do name &list hwy11
tables
additem vpts_%name%.pat radius2 4 5 b
additem vpts_%name%.pat offseta 1 1 i
select vpts_%name%.pat
/****************************
/* Setting the search radius.
/****************************
calc radius2 = 10000
/*************************************************************************
11. ASUSTAINABLE RESOURCE
DEVELOPMENT
/* Setting a vertical offset of 2 meters in order to represent the view
/* from the height of a standing adult, or the view height from many vehicles.
/*************************************************************************
calc offseta = 2
quit
&end /* END DO-LIST
&return
/*===================================================================
&routine BAILOUT
/*===================================================================
&severity &error &fail
&echo &off
&if %:program% = ARCEDIT &then quit
&return &warning ***** An error has occured in VISPREP.AML *****
12. ASUSTAINABLE RESOURCE
DEVELOPMENT
Visibility Analysis AML
/*********************************************************************
/* NAME: runvis.aml
/*********************************************************************
/*
/* DESCRIPTION: Calculates the composite visilibity for the given
/* input viewpoint layer.
/*====================================================================
/* USAGE: &run runvis.aml
/*
/* ARGUMENTS: none
/*
/* NOTES:
/*
/*====================================================================
/*
/* PROGRAMMED BY: Tammy Kobliuk
/* PROGRAMMED FOR: Alberta Sustainable Resource Development, Public
/* Lands and Forests Division, Forest Management Branch,
/* Resource Analysis Section
/* DATE: June 29, 2005
/* LAST MODIFIED:
/*
/*====================================================================
/* ROUTINES: BAILOUT - Bails cleanly out of the aml due to an error.
/*
/*-----------------------
/* VARIABLES:
/*
/* GLOBALS: none
/*
/* LOCALS: dem - Digital elevation model grid to be used in the analysis.
/* name - linear access feature name
/*
/* SYSTEM: none
/*
/*====================================================================
&severity &error &routine BAILOUT
&echo &on
&setvar dem = dem_vis
&do name &list hwy11
visibility %dem% vpts_%name% point visg_%name% grid frequency
&end /* END DO-LIST
&echo &off
&return &inform **** RUNVIS.AML has successfully completed. ****
/*===================================================================
&routine BAILOUT
/*===================================================================
&severity &error &fail
&echo &off
&return &warning ***** An error has occured in RUNVIS.AML *****