Energy & Commodities, 2010, regarding May
•
0 gefällt mir•255 views

Swedbank was founded in 1820, as Sweden’s first savings bank was established. Today, our heritage is visible in that we truly are a bank for each and every one and in that we still strive to contribute to a sustainable development of society and our environment. We are strongly committed to society as a whole and keen to help bring about a sustainable form of societal development. Our Swedish operations hold an ISO 14001 environmental certification, and environmental work is an integral part of our business activities.

Empfohlen
Empfohlen
Weitere ähnliche Inhalte
Was ist angesagt?
Was ist angesagt? (20)
Andere mochten auch
Ähnlich wie Energy & Commodities, 2010, regarding May
Ähnlich wie Energy & Commodities, 2010, regarding May (20)
Mehr von Swedbank
Mehr von Swedbank (20)
Kürzlich hochgeladen
Kürzlich hochgeladen (20)
Energy & Commodities, 2010, regarding May
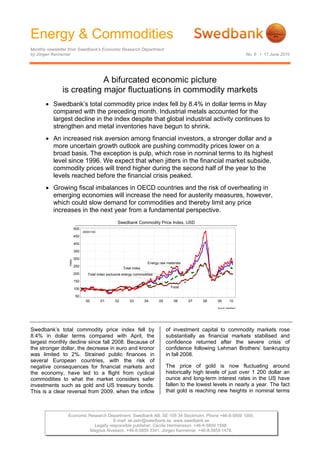
- 1. Energy & Commodities Monthly newsletter from Swedbank’s Economic Research Department by Jörgen Kennemar No. 6 • 17 June 2010 Economic Research Department. Swedbank AB. SE-105 34 Stockholm. Phone +46-8-5859 1000. E-mail: ek.sekr@swedbank.se www.swedbank.se Legally responsible publisher: Cecilia Hermansson. +46-8-5859 1588. Magnus Alvesson. +46-8-5859 3341. Jörgen Kennemar. +46-8-5859 1478. A bifurcated economic picture is creating major fluctuations in commodity markets • Swedbank’s total commodity price index fell by 8.4% in dollar terms in May compared with the preceding month. Industrial metals accounted for the largest decline in the index despite that global industrial activity continues to strengthen and metal inventories have begun to shrink. • An increased risk aversion among financial investors, a stronger dollar and a more uncertain growth outlook are pushing commodity prices lower on a broad basis. The exception is pulp, which rose in nominal terms to its highest level since 1996. We expect that when jitters in the financial market subside, commodity prices will trend higher during the second half of the year to the levels reached before the financial crisis peaked. • Growing fiscal imbalances in OECD countries and the risk of overheating in emerging economies will increase the need for austerity measures, however, which could slow demand for commodities and thereby limit any price increases in the next year from a fundamental perspective. Swedbank Commodity Price Index, USD Source: Swedbank 00 01 02 03 04 05 06 07 08 09 10 Index 50 100 150 200 250 300 350 400 450 500 Total index exclusive energy commodities Total index Food Energy raw materials 2000=100 Swedbank’s total commodity price index fell by 8.4% in dollar terms compared with April, the largest monthly decline since fall 2008. Because of the stronger dollar, the decrease in euro and kronor was limited to 2%. Strained public finances in several European countries, with the risk of negative consequences for financial markets and the economy, have led to a flight from cyclical commodities to what the market considers safer investments such as gold and US treasury bonds. This is a clear reversal from 2009, when the inflow of investment capital to commodity markets rose substantially as financial markets stabilised and confidence returned after the severe crisis of confidence following Lehman Brothers’ bankruptcy in fall 2008. The price of gold is now fluctuating around historically high levels of just over 1 200 dollar an ounce and long-term interest rates in the US have fallen to the lowest levels in nearly a year. The fact that gold is reaching new heights in nominal terms
- 2. Energy & Commodities Monthly newsletter from Swedbank’s Economic Research Department, continued No. 6 • 17 June 2010 2 (4) can be interpreted to mean that the market is trying to protect against higher inflation, while lower long- term interest rates indicate expectations of continued weak growth with low inflation. The bifurcated picture also applies to the economy, with strong expansion in emerging economies but with the risk of overheating, while several OECD countries are struggling with modest growth and low inflation. At the same time several of the latter countries face huge budget cutbacks, which could impede the recovery. Even rapidly growing economies, which account for the large part of the global increase in commodity consumption, are being forced to slash their spending to reduce the risk of overheating. Less expansive economic policies have created uncertainty about global commodity demand in the quarters immediately ahead. Industrial metals are the commodity group that has been most affected by the financial turbulence and therefore accounted for the largest price decline in Swedbank’s commodity price index in May, dropping by an average of 12% compared with April. The downward price trend has continued in June, and at the time of writing the prices of several industrial metals were at their lowest levels since fall 2009 measured in dollars. Metal prices are falling despite that fundamentals are relatively strong. Inventories of several metals, such as copper and nickel, have dropped since March. The inventory situation for aluminium has improved as well, although levels remain historically high. Lead and zinc inventories have risen on the other hand. Stock levels, Base Metals Source: LME, Reuters EcoWin 00 01 02 03 04 05 06 07 08 09 10 Ton(metric) -25000 0 25000 50000 75000 100000 125000 150000 175000 200000 225000 Ton(metric)(millions) 0.0 0.1 0.2 0.3 0.4 0.5 0.6 0.7 0.8 0.9 1.0 Copper Zink Lead Nickel, right scale Growing steel production is also an indication that global industrial activity continues to rise. During the first quarter steel production rose by nearly 30% on an annual basis and thus returned to the levels before the financial crisis in 2008. China accounts for the majority of the increase, but steel production grew in other parts of the world as well, which has increased consumption of nickel and coal, the raw materials used to manufacture steel. Steel production Source: Reuters EcoWin 00 01 02 03 04 05 06 07 08 09 10 Ton(metric) 75 100 125 150 175 200 225 250 275 300 2000=100 Asia World We expect a slight stabilisation of the financial market during the second half of the year at the same time that the risk appetite for commodity- related financial assets is still growing, which is driving up metal prices to levels we saw before the financial crisis. The ongoing industrialisation and urbanisation of emerging economies will create an underlying demand for commodities for a long time to come, even if variations arise in connection with economic fluctuations and political decisions. The price of crude, which weighs heavily in the commodity price index, fell by slightly over 10% in May, which means that oil prices are back to the same levels as in February. Like industrial metals, crude experienced large price fluctuations during spring, probably due more to financial flows than changes in the real economy. The other major energy source, coal, generally remained steady in May, with price levels just over 50% higher than the same month a year earlier. We anticipate that global oil consumption will continue to rise in 2010 after last year’s decline to just over 86 million barrels, driven by emerging economies led by China and India. The US, the world’s largest oil consumer, is also expected to use more oil as its economy improves, while fiscal constraints and a weaker euro are limiting consumption in Europe. Our average oil price projection of 75 dollars for this year remains unchanged. This means that the price at the end of the year is expected to be around 70 dollars a barrel. We expect OPEC to maintain current production capacity despite that inventories exceed the average for the last five years. The long-term price decline for food products continued in May, with the price index falling by nearly 1%, although there are variations between different types of foods. Grain prices, which have been under pressure for an extended period of time, turned higher last month, but are still 16% lower than a year earlier. Besides excess inventories, grain prices are under pressure from a stronger dollar.
- 3. Energy & Commodities Monthly newsletter from Swedbank’s Economic Research Department, continued No. 6 • 17 June 2010 3 (4) Among commodities, pulp went against the stream in May despite financial concerns and uncertainty about the economy. On average, the price rose by 3% measured in dollars (10% in euro), which means it has risen by about 60% from a year ago. A supply shortage and increased Chinese demand are driving up prices to the highest nominal levels since 1996. Overcapacity of aluminium and steel is keeping prices under pressure Despite a longstanding oversupply of aluminium, prices have risen in line with other industrial metals. Aluminium production is energy intensive and is therefore especially sensitive to large swings in energy prices. In China, the largest producer of aluminium, a recent increase in energy fees is expected to raise production costs. In the short term there is a risk of slight cutbacks in production capacity if the price of aluminium continues to fall and if the strong demand for metals in emerging economies in recent years subsides as economic policies are gradually tightened. An aluminium price under 2 000 dollars per ton is considered by many experts to be unprofitable for high-cost countries. In essence, however, there is a tremendous global need for aluminium, particularly from the household sector in Asia. By 2020 global demand is expected to more than double, from 35.6 million tons in 2009 to 74 million tons. A new pricing model for iron ore is now being established. Instead of annual contracts, which have typically been used for over 40 years, we are now seeing a transition to quarterly contracts. This raises the risk that iron ore prices could be more volatile than before, which could make it harder to predict future production costs, especially for end users like the steel industry. The three largest iron ore producers, which account for around three fourths of the world’s production, are expected to announce price increases of 23% during the third quarter after having raised them by 65-75% during the second quarter. Iron ore prices are being raised at the same time that steel production is expected to reach a new record level in 2010 equivalent to 28.5 million tons, thereby exceeding 2006 levels. The large part of the production increase will be outside the OECD, however, notably in China and Russia, where it is expected to be 78% higher than four years ago. For the US and Europe, on the other hand, production is projected to be 20% lower. Demand for steel is headed upward in the engineering industry, but still rests on shaky ground, especially in OECD countries, where any increase in investments has been put off due to low capacity utilisation. The steel industry has questioned the price increases for iron ore, especially in light of uncertain economic conditions, with fiscal policies being tightened in Europe at the same time that there are signs of weak steel demand from the Chinese construction sector and auto industry. The steel industry is also wrestling with rising inventories, due to which steel prises have fallen in China in recent months, which could also spread to other parts of the world. Since China accounts for nearly half of global steel production, a lower production increase for steel could have consequences for iron ore producers as well. Swedish commodity exports take off Swedish exports performed better than expected during the first quarter. A strong contributing factor was the substantial increase in mineral exports (iron ore and steel), which rose by no less than 30% in volume and contributed an estimated 3 percentage points to the total increase in goods exports of 7.6% compared with the same point in time last year. This is evidence that global demand for raw materials and input goods has strengthened, which benefits Swedish industry. Jörgen Kennemar
- 4. Energy & Commodities Monthly newsletter from Swedbank’s Economic Research Department, continued No. 6 • 17 June 2010 4 (4) Swedbank Commodity Index - US$ - Basis 2000 = 1oo 11-06-10 3.2010 4.2010 5.2010 Total index 264,6 287,2 263,2 Per cent change month ago 5,3 8,5 -8,4 Per cent change year ago 60,7 63,8 33,3 Total index exclusive energy 223,3 254,9 242,6 Per cent change month ago 3,3 14,2 -4,8 Per cent change year ago 42,2 53,8 39,2 Food, tropical beverages 208,1 206,4 204,5 Per cent change month ago -4,6 -0,8 -0,9 Per cent change year ago 14,0 7,4 -2,5 Cereals 185,6 178,7 180,8 Per cent change month ago -1,1 -3,7 1,2 Per cent change year ago -7,0 -10,2 -15,7 Tropical beverages and tobacco 225,6 222,2 219,8 Per cent change month ago -7,3 -1,5 -1,1 Per cent change year ago 24,7 18,6 8,8 Coffee 125,3 126,9 128,2 Per cent change month ago 1,5 1,3 1,0 Per cent change year ago 18,3 13,7 4,1 Oilseeds and oil 184,9 190,4 186,9 Per cent change month ago 0,6 3,0 -1,8 Per cent change year ago 5,7 -3,9 -16,4 Industrial raw materials 227,7 268,9 253,6 Per cent change month ago 5,6 18,1 -5,7 Per cent change year ago 52,2 70,1 54,6 Agricultural raw materials 164,3 169,9 163,9 Per cent change month ago 4,2 3,4 -3,5 Per cent change year ago 57,2 58,5 46,3 Cotton 81,3 81,5 81,4 Per cent change month ago 9,1 0,2 -0,1 Per cent change year ago 88,6 65,7 41,3 Softwood 140,8 146,2 145,0 Per cent change month ago 3,2 3,8 -0,8 Per cent change year ago 36,6 42,4 37,4 Woodpulp 877,7 917,2 945,8 Per cent change month ago 4,5 4,5 3,1 Per cent change year ago 51,7 58,5 61,6 Non-ferrous metals 239,8 253,2 222,4 Per cent change month ago 9,1 5,6 -12,2 Per cent change year ago 86,8 75,2 46,5 Copper 7462,4 7744,4 6863,9 Per cent change month ago 9,2 3,8 -11,4 Per cent change year ago 99,1 75,8 50,1 Aluminium 2205,6 2316,4 2045,2 Per cent change month ago 7,9 5,0 -11,7 Per cent change year ago 65,2 63,0 40,2 Lead 2171,7 2264,5 1892,8 Per cent change month ago 1,9 4,3 -16,4 Per cent change year ago 75,4 63,8 31,5 Zinc 2274,7 2366,3 1977,9 Per cent change month ago 5,5 4,0 -16,4 Per cent change year ago 87,0 71,7 33,2 Nickel 22453,4 26022,8 22164,3 Per cent change month ago 19,0 15,9 -14,8 Per cent change year ago 131,6 133,2 75,3 Iron ore, steel scrap 355,5 566,2 570,9 Per cent change month ago 1,1 59,3 0,8 Per cent change year ago 9,5 73,6 72,0 Energy raw materials 283,0 301,6 272,4 Per cent change month ago 6,0 6,6 -9,7 Per cent change year ago 68,4 67,8 31,2 Coking coal 352,1 377,9 377,4 Per cent change month ago 1,2 7,3 -0,1 Per cent change year ago 51,2 57,9 56,0 Crude oil 279,8 298,1 267,6 Per cent change month ago 6,3 6,5 -10,2 Per cent change year ago 69,5 68,4 29,8 Swedbank Commodity Index - SKr - Basis 2000 = 1oo 11-06-10 3.2010 4.2010 5.2010 Total index 205,9 224,5 220,0 Per cent change month ago 3,9 9,0 -2,0 Per cent change year ago 34,6 43,1 32,7 Total index exclusive energy 173,8 199,2 202,8 Per cent change month ago 1,9 14,6 1,8 Per cent change year ago 19,1 34,4 38,4 Food, tropical beverages 161,9 161,3 170,9 Per cent change month ago -5,9 -0,4 6,0 Per cent change year ago -4,5 -6,2 -3,0 Cereals 144,4 139,7 151,1 Per cent change month ago -2,5 -3,3 8,2 Per cent change year ago -22,1 -21,5 -16,1 Tropical beverages and tobacco 175,6 173,7 183,7 Per cent change month ago -8,6 -1,1 5,8 Per cent change year ago 4,4 3,6 8,2 Coffee 97,5 99,2 107,2 Per cent change month ago 0,1 1,7 8,0 Per cent change year ago -0,9 -0,7 3,6 Oilseeds and oil 143,9 148,8 156,2 Per cent change month ago -0,8 3,4 5,0 Per cent change year ago -11,5 -16,0 -16,8 Industrial raw materials 177,2 210,2 212,0 Per cent change month ago 4,2 18,6 0,9 Per cent change year ago 27,5 48,6 53,8 Agricultural raw materials 127,9 132,8 137,0 Per cent change month ago 2,8 3,8 3,2 Per cent change year ago 31,7 38,5 45,6 Cotton 63,3 63,7 68,0 Per cent change month ago 7,6 0,7 6,8 Per cent change year ago 58,0 44,7 40,6 Softwood 109,6 114,3 121,2 Per cent change month ago 1,8 4,3 6,1 Per cent change year ago 14,4 24,4 36,7 Woodpulp 683,1 716,8 790,6 Per cent change month ago 3,0 4,9 10,3 Per cent change year ago 27,1 38,5 60,7 Non-ferrous metals 186,6 197,9 185,9 Per cent change month ago 7,6 6,0 -6,1 Per cent change year ago 56,4 53,1 45,8 Copper 5807,7 6052,4 5737,3 Per cent change month ago 7,7 4,2 -5,2 Per cent change year ago 66,7 53,6 49,3 Aluminium 1716,5 1810,3 1709,5 Per cent change month ago 6,4 5,5 -5,6 Per cent change year ago 38,3 42,4 39,5 Lead 1690,1 1769,8 1582,1 Per cent change month ago 0,5 4,7 -10,6 Per cent change year ago 46,9 43,1 30,8 Zinc 1770,3 1849,3 1653,3 Per cent change month ago 4,1 4,5 -10,6 Per cent change year ago 56,6 50,0 32,5 Nickel 17474,6 20337,4 18526,5 Per cent change month ago 17,3 16,4 -8,9 Per cent change year ago 94,0 103,7 74,4 Iron ore, steel scrap 276,7 442,5 477,2 Per cent change month ago -0,3 59,9 7,8 Per cent change year ago -8,3 51,6 71,1 Energy raw materials 220,2 235,7 227,7 Per cent change month ago 4,6 7,0 -3,4 Per cent change year ago 41,0 46,6 30,5 Coking coal 274,0 295,3 315,5 Per cent change month ago -0,2 7,8 6,8 Per cent change year ago 26,6 38,0 55,2 Crude oil 217,8 233,0 223,7 Per cent change month ago 4,8 7,0 -4,0 Per cent change year ago 41,9 47,1 29,2 Swedbank Economic Research Department SE-105 34 Stockholm, Sweden Phone +46-8-5859 1028 ek.sekr@swedbank.se www.swedbank.se Legally responsible publisher Cecilia Hermansson, +46-88-5859 1588 Magnus Alvesson, +46-8-5859 3341 Jörgen Kennemar, +46-8-5859 1478 Swedbank’s monthly Energy & Commodities newsletter is published as a service to our customers. We believe that we have used reliable sources and methods in the preparation of the analyses reported in this publication. However, we cannot guarantee the accuracy or completeness of the report and cannot be held responsible for any error or omission in the underlying material or its use. Readers are encouraged to base any (investment) decisions on other material as well. Neither Swedbank nor its employees may be held responsible for losses or damages, direct or indirect, owing to any errors or omissions in Swedbank’s monthly Energy & Commodities newsletter.