Recommended

Recommended
More Related Content
Similar to Dengue Control in Rathnapura, Sri Lanka. Poster Presentation- Nagasaki, Japan
Similar to Dengue Control in Rathnapura, Sri Lanka. Poster Presentation- Nagasaki, Japan (20)
Recently uploaded
Recently uploaded (20)
Dengue Control in Rathnapura, Sri Lanka. Poster Presentation- Nagasaki, Japan
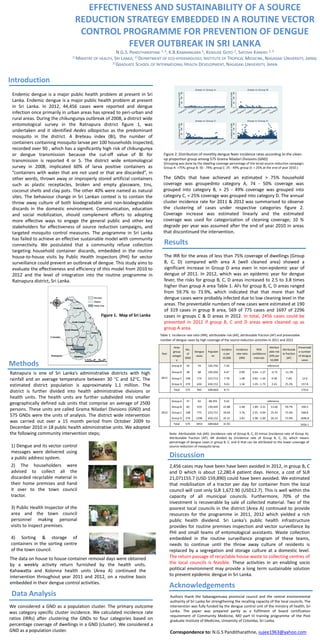
- 1. EFFECTIVENESS AND SUSTAINABILITY OF A SOURCE REDUCTION STRATEGY EMBEDDED IN A ROUTINE VECTOR CONTROL PROGRAMME FOR PREVENTION OF DENGUE FEVER OUTBREAK IN SRI LANKA N.G.S. PANDITHARATHNE 1, 2, K.B.KANNANGARA 1, KENSUKE GOTO 2, SATOSHI KANEKO 2, 3 1)MINISTRY OF HEALTH, SRI LANKA; 2)DEPARTMENT OF ECO-EPIDEMIOLOGY, INSTITUTE OF TROPICAL MEDICINE, NAGASAKI UNIVERSITY, JAPAN; 3)GRADUATE SCHOOL OF INTERNATIONAL HEALTH DEVELOPMENT, NAGASAKI UNIVERSITY, JAPAN Introduction Areas in Group A Figure 1. Map of Sri Lanka Incidence per 10,000 50 100 150 0 Incidence per 10,000 50 100 150 0 ja 01 n2 01 1 01 jul2 01 1 01 jan 20 12 01 jul2 01 2 01 jan 20 13 01 jul2 01 0 01 jan 20 11 01 Areas in Group C ju 01 jul2 01 1 01 jan 20 12 01 jul2 01 2 01 jan 20 13 Incidence per 10,000 50 100 150 0 Areas in Group D Incidence per 10,000 50 100 150 0 Endemic dengue is a major public health problem at present in Sri Lanka. Endemic dengue is a major public health problem at present in Sri Lanka. In 2012, 44,456 cases were reported and dengue infection once primarily in urban areas has spread to peri-urban and rural areas. During the chikungunya outbreak of 2008, a district wide entomological survey in the Ratnapura district figure 1, was undertaken and it identified Aedes albopictus as the predominant mosquito in the district. A Breteau index (BI), the number of containers containing mosquito larvae per 100 households inspected, recorded over 90 , which has a significantly high risk of chikungunya or dengue transmission because the cut-off value of BI for transmission is reported 4 or 5. The district wide entomological survey in 2008, implicated 60% of larva positive containers as “containers with water that are not used or that are discarded”, in other words, thrown away or improperly stored artificial containers such as plastic receptacles, broken and empty glassware, tins, coconut shells and clay pots. The other 40% were named as natural sites. The behaviour change in Sri Lankan context is to contain the throw away culture of both biodegradable and non-biodegradable discards in the domestic environment. Communication, education and social mobilization, should complement efforts to adopting more effective ways to engage the general public and other key stakeholders for effectiveness of source reduction campaigns, and targeted mosquito control measures. The programme in Sri Lanka has failed to achieve an effective sustainable model with community connectivity. We postulated that a community refuse collection targeting household container discards, embedded in the routine house-to-house visits by Public Health Inspectors (PHI) for vector surveillance could prevent an outbreak of dengue. This study aims to evaluate the effectiveness and efficiency of this model from 2010 to 2012 and the level of integration into the routine programme in Ratnapura district, Sri Lanka. Areas in Group B l20 10 0 n 1ja 20 11 ju 01 l20 11 0 n 1ja 20 12 ju 01 l20 12 0 n 1ja 20 13 ja 01 n2 01 0 ja 01 n2 01 1 ja 01 n2 01 2 ja 01 n2 01 3 Figure 2. Distribution of monthly dengue fever incidence rates according to the cleanup proportion group among 575 Grama Niladari Divisions (GND) (Grouping was done by the dwelling coverage percentage of the larval source reduction campaign; Group A: >75%; group B: 50 - 74%; group C: 25 - 49%; group D: < 25% at the end of year 2010.) The GNDs that have achieved an estimated > 75% household coverage was groupednto category A, 74 - 50% coverage was grouped into category B, > 25 - 49% coverage was grouped into category C, < 25% coverage was grouped into category D. The annual cluster incidence rate for 2011 & 2012 was summarised to observe the clustering of cases under respective categories figure 2. Coverage increase was estimated linearly and the estimated coverage was used for categorization of cleaning coverage; 10 % degrade per year was assumed after the end of year 2010 in areas that discontinued the intervention. Results The IRR for the areas of less than 75% coverage of dwellings (Group B, C, D) compared with area A (well cleaned area) showed a significant increase in Group D area even in non-epidemic year of dengue of 2011. In 2012, which was an epidemic year for dengue fever, the risks for group B, C, D areas increased to 2.5 to 3.8 times higher than group A area Table 1. AFs for group B, C, D areas ranged from 59.7% to 73.9%, which indicated that that more than half dengue cases were probably infected due to low cleaning level in the areas. The preventable numbers of new cases were estimated at 190 of 319 cases in group B area, 569 of 775 cases and 1697 of 2296 cases in groups C & D areas in 2012. In total, 2456 cases could be prevented in 2012 if group B, C and D areas were cleaned up as group A area. Table 1. Incidence rate ratio (IRR), attributable risk (AR), attributable fraction (AF) and preventable number of dengue cases by high coverage of the source reduction activities in 2011 and 2012 Ratnapura is one of Sri Lanka’s administrative districts with high rainfall and an average temperature between 30 C and 32C. The estimated district population is approximately 1.1 million. The district is further divided into health administrative divisions or health units. The health units are further subdivided into smaller geographically defined sub units that comprise an average of 2500 persons. These units are called Grama Niladari Divisions (GND) and 575 GNDs were the units of analysis. The district wide intervention was carried out over a 15 month period from October 2009 to December 2010 in 18 public health administrative units. We adopted the following community intervention steps; 1) Dengue and its vector control messages were delivered using a public address system. 2) The householders were advised to collect all the discarded recyclable material in their home premises and hand it over to the town council tractor. 3) Public Health Inspector of the area and the town council personnel making personal visits to inspect premises. 4) Sorting & storage of containers in the sorting centre of the town council. The data on house to house container removal days were obtained by a weekly activity return furnished by the health units. Kahawatta and Kolonna health units (Area A) continued the intervention throughout year 2011 and 2012, on a routine basis embedded in their dengue control activities. Data Analysis We considered a GND as a population cluster. The primary outcome was category specific cluster incidence. We calculated incidence rate ratios (IRRs) after clustering the GNDs to four categories based on percentage coverage of dwellings in a GND (cluster). We considered a GND as a population cluster. 59 74 102,750 7.20 38 68 105,050 6.47 0.90 0.64 - 1.27 Group C 108 174 223,712 7.78 1.08 370 626 650,152 9.63 1.34 Total 575 942 1081664 8.71 Group A 37 63 68,355 9.22 Group B 2012 Populati on Group D 2011 Dengue cases Incidenc e per 10,000 Group B Methods No. of GND Group A Year Area group categor y 60 319 139,445 22.88 2.48 1.89 - 3.31 13.66 59.7% 190.5 Group C 108 775 223,712 34.64 3.76 2.91 - 4.94 25.43 73.4% 568.8 Group D 370 2296 650,152 35.31 3.83 2.98 - 5.00 26.10 73.9% 1696.8 Total 575 3453 1081664 31.92 Incidence rate ratio (IRR) Attributab le fraction (AF) Preventabl e number of dengue cases -0.73 -11.3% - 0.82 - 1.44 0.58 7.4% 12.9 1.05 - 1.73 2.43 25.2% 157.8 95% confidence intervals Attribut able risk (AR) per 10,000 reference 170.6 reference 2456.1 Note: Attributable risk (AR): (incidence rate of Group B, C, D) minus (incidence rate of Group A); Attributable fraction (AF): AR divided by (incidence rate of Group B, C, D), which means percentage of dengue cases in group B, C, and D that can be attributed to the lower coverage of source reduction of mosquito larva. Discussion 2,456 cases may have been have been avoided in 2012, in group B, C and D which is about 12,280.4 patient days. Hence, a cost of SLR 21,071155.7 (USD 159,890) could have been avoided. We estimated that mobilisation of a tractor per day for container from the local council will cost only SLR 1,672.90 (USD12.7). This is well within the capacity of all municipal councils. Furthermore, 70% of the investment is recoverable by sale of collected material. Two of the poorest local councils in the district (Area A) continued to provide resources for the programme in 2011, 2012 which yielded a rich public health dividend. Sri Lanka's public health infrastructure provides for routine premises inspection and vector surveillance by PHI and small teams of entomological assistants. Waste collection embedded in the routine surveillance program of these teams, needs to continue until the throw away culture of residents is replaced by a segregation and storage culture at a domestic level. The return passage of recyclable house waste to collecting centres of the local councils is feasible. These activities in an enabling socio political environment may provide a long term sustainable solution to prevent epidemic dengue in Sri Lanka. Acknowledgements Authors thank the Sabaragamuwa provincial council and the central environmental authority of Sri Lanka for strengthening the recalling capacity of the local councils. The intervention was fully funded by the dengue control unit of the ministry of health, Sri Lanka. The paper was prepared partly as a fulfilment of board certification requirement of Community Medicine, MD part III training programme of the Post graduate Institute of Medicine, University of Colombo, Sri Lanka. Correspondence to: N.G.S Panditharathne, sujee1963@yahoo.com