1. INTRODUCTION
Systematic Literature Review of Cost of Adverse Events in Cancer Treatment in the US
Smeet Gala, Merena Nanavaty, John Proach
Market Access Solutions, LLC., Raritan, NJ
Adverse events (AEs) and dose-limiting toxicities in cancer patients are associated with increased
morbidity, mortality and cost.1
AEs decrease patients’ compliance to chemotherapy and their quality-of-life, but also lead to significant
financial burden in form of direct and indirect costs.2
Major clinical studies report the chemotherapy-related AEs, but there is very little literature on their costs.
There is lack of reviews that summarizes the cost of various AEs across different cancers.
International Society for Pharmacoeconomics and Outcomes Research (ISPOR) 20th Annual International Meeting,
Philadelphia, PA, USA, May 16 - 20, 2015
The objective of this systematic literature review was to provide an updated understanding of the cost of
AEs in cancer treatments in the US.
OBJECTIVES
REFERENCES
PCN63
A systematic literature search was conducted in PubMed, and relevant articles published between January
2008 and October 2013, in English language were included.
Primary search terms used were AE related; secondary search terms used were cost related.
The inclusion criteria used:
• Studies evaluating cost of following AEs: neutropenia, thrombocytopenia, vomiting, nausea/vomiting,
peripheral neuropathy, sepsis, diarrhea and fatigue/asthenia due to cancer treatment
• US-based studies
A total of 893 titles and abstracts were screened for eligibility by two researchers and discrepancies were
resolved by a third researcher. Any undetermined titles and abstracts were reviewed via full-text screening.
Costs were extracted for case and control cohorts (if available) and the cost difference between the cohorts
was calculated to provide the additional cost due to the AEs.
The difference in cost was adjusted to 2013 USD assuming a discounting rate of 3%.
METHODS
Table 1. Characteristics of Included Studies
LIMITATIONS
Comparisons should be made with extreme cautions owing to the differences in type of cancer, grade of
AEs, type of costs, population in case and control groups and data sources.
Cost data on some AEs such as fatigue, fertility and sexual side effects, pain, xerostomia, etc. were not
available through the current search. Additional searches may be needed to obtain such cost data.
Grey literature and various conferences, not searched in the current review, may provide deeper insight in
the cost of cancer treatment-related AEs.
STRENGTHS
This is the first literature review to systematically assess the cost of various cancer treatment-related AEs in
the US.
This study highlights the excessive economic burden of treatment-related AEs a cancer patient faces in
addition to the expensive oncology treatments.
The adverse events in cancer treatment remain a common and an expensive problem.
The direct healthcare cost reviewed in this study, along with the indirect cost (not in study) of these AEs
pose a tremendous economic burden on healthcare.
In the future, it is important to compare the costs of treating AEs resulting from various cancer treatments,
in order to efficiently allocate the healthcare budget.
RESULTS
A total of 35 full-text articles were assessed for eligibility, of which 15 were included.
A PRISMA flow diagram was employed for study selection and inclusion (Figure 1).
1. Kuderer NM et al. Cancer. 2006;106(10):2258-2266.
2. Hurvitz S et al. The oncologist. 2014;19(9).
3. Elting LS et al. Journal of clinical oncology : official journal of
the American Society of Clinical Oncology. Feb 1
2008;26(4):606-611.
4. Weycker D et al. 2008;19(3):454-460.
5. Hendricks AM et al. Journal of clinical oncology : official
journal of the American Society of Clinical Oncology. Oct 20
2011;29(30):3984-3989.
6. Burudpakdee C et al. Journal of medical economics.
2012;15(2):371-377.
7. Weycker D et al. Chemotherapy. 2012;58(1):8-18.
8. Baroletti S et al. Thrombosis and haemostasis. 2008.
9. Smythe MA et al. Chest. Sep 2008;134(3):568-573
10.Eisenstein EL et al. Journal of medical systems.
2009;34(3):379-386.
11.Parra-Sanchez I et al. Canadian Journal of
Anesthesia/Journal canadien d'anesthésie. 2012;59(4):366-
375
12. Burke TA et al. Supportive care in cancer : official journal
of the Multinational Association of Supportive Care in
Cancer. Jan 2011;19(1):131-140.
13. Haiderali A et al. Supportive care in cancer : official
journal of the Multinational Association of Supportive Care
in Cancer. Jun 2011;19(6):843-851
14. Hagiwara M et al. Journal of medical economics. Nov
2013;16(11):1300-1306.
15. Pike CT et al. Chemotherapy research and practice.
2012;2012:913848.
16. Allareddy V et al. World journal of pediatrics : WJP. Aug
2012;8(3):222-228.
Study - year of
publication
Disease Year of $ Data source in study
Neutropenia
Elting 20083 Solid tumor 2006
A retrospective cohort consisting of consecutive
patients registered on the low-risk pathway
between 1997 and 2003
Weycker 20084 Cancer 2003 US health-care claims database
Hendricks 20115 Cancer 2008 Costs from a randomized trial
Burudpakdee 20126
Metastatic
colorectal cancer
2010
Medicare payments from the Healthcare Cost
and Utilization Project database
Weycker 20127 Cancer
Not specified
(Database year
2003-2009)
US Healthcare claims data
Thrombocytopenia
Baroletti 20088 Heparin-induced
Not specified
(Database year
2003-2006)
Single-center patient registry
Smythe 20089 Heparin-induced Not specified
Financial / decision support database of
hospital
Eisenstein 201010 Heparin-induced 2004 CATCH patients registry
Vomiting
Burudpakdee 20126
Metastatic
colorectal cancer
2010
Medicare payments from the Healthcare Cost
and Utilization Project database
Nausea and vomiting
Parra-Sanchez 201011 Post-operation Not specified Economic data of ambulatory patients
Burke 201112 Cancer
Not specified
(Database year
2003-2007)
Premier Perspective™Database
Haiderali 201113 Cancer 2007 32 oncology specialty care settings in the USA
Hagiwara 201314
Renal cell
carcinoma
2007
Linked Surveillance, Epidemiology and End
Results (SEER) Medicare database
Peripheral neuropathy
Pike 201215 Cancer 2006
Database of privately insured administrative
claims record (Ingenix Employer
Database)
Sepsis
Allareddy 201216 Leukemia 2008
Nationwide Inpatient Sample (NIS) of the
Healthcare Cost and Utilization Project
Diarrhea; Fatigue / Asthenia
Hagiwara 201314
Renal cell
carcinoma
2007
Linked Surveillance, Epidemiology and End
Results (SEER) Medicare database
IdentifyScreenEligibleInclude
PubMed (January 2008-October 2013)
(n = 893)
Abstracts screened
(n = 893)
Abstracts excluded (n = 858)
1.Not US-based studies (n = 108)
2.Not cancer-based studies (n = 345)
3.Not evaluating cost of AEs (n = 405)
Full-texts excluded (n = 20)
1.Not cancer-based studies (n = 8)
2.Not evaluating cost of AEs (n = 12)
Studies included in qualitative review (n = 15)
Full-text articles assessed for
eligibility (n = 35)
Figure 1. Flow Diagram of Systematic Literature Search
CONCLUSION
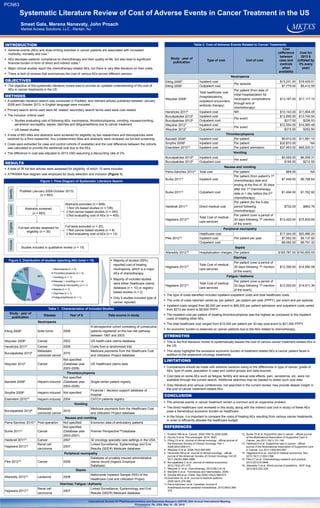
29%
18%
6%
23%
6%
6%
6%
6% Neutropenia (n = 5)
Thrombocytopenia (n = 3)
Vomiting (n = 1)
Nausea + vomiting (n = 4)
Peripheral neuropathy (n = 1)
Sepsis (n = 1)
Diarrhea (n = 1)
Fatigue/asthenia (n = 1)
Study - year of
publication
Type of cost Unit of cost
Cost
(difference
between
case and
controls
when
available)
Cost for
2013 $
(inflated by
3% every
year)
Neutropenia
Elting 20083 Inpatient cost
Per episode
$15,231.00 $18,429.51
Elting 20083 Outpatient cost $7,779.00 $9,412.59
Weycker 20084
Total healthcare cost
(hospitalizations,
outpatient encounters,
antibiotic therapy)
Per patient (from date of
initial hospitalization for
neutropenic complications
through end of
chemotherapy)
$13,167.00 $17,117.10
Hendricks 20115 Inpatient cost NR $10,143.00 $11,664.45
Burudpakdee 20126 Inpatient cost
Per event
$12,606.00 $13,740.54
Burudpakdee 20126 Outpatient cost $217.00 $236.53
Weycker 20127 Inpatient cost
Per event
$12,554.00 $14,060.48
Weycker 20127 Outpatient cost $315.00 $352.80
Thrombocytopenia
Baroletti 20088 Inpatient cost Per patient $9,910.00 $11,991.10
Smythe 20089 Inpatient cost Per patient $32,872.00 NA
Eisenstein 201010 Inpatient cost Per patient admission $37,953.00 $48,200.31
Vomiting
Burudpakdee 20126 Inpatient cost
Per event
$5,559.00 $6,059.31
Burudpakdee 20126 Outpatient cost $195.00 $212.55
Nausea and vomiting
Parra-Sanchez 201011 Total cost Per patient $69.00 NA
Burke 201112 Inpatient cost
Per patient (from patient’s 1st
chemotherapy date and
ending at the first of: 30 days
after the 1st chemotherapy
date or 1 day before the 2nd
chemotherapy)
$7,448.00 $8,788.64
Burke 201112 Outpatient cost $1,494.00 $1,762.92
Haiderali 201113 Direct medical cost
Per patient (for the 5-day
period following
chemotherapy)
$732.00 $863.76
Hagiwara 201314
Total Cost of medical -
care services
Per patient (over a period of
30 days following 1st mention
of the event)
$13,420.00 $15,835.60
Peripheral neuropathy
Pike 201215
Healthcare cost
Per patient per year
$17,344.00 $20,986.24
Inpatient cost $7,552.00 $9,137.92
Outpatient cost $8,092.00 $9,791.32
Sepsis
Allareddy 201216 Hospitalization charges Per patient $165,787.00 $190,655.05
Diarrhea
Hagiwara 201314
Total Cost of medical -
care services
Per patient (over a period of
30 days following 1st mention
of the event)
$12,356.00 $14,580.08
Fatigue / Asthenia
Hagiwara 201314
Total Cost of medical -
care services
Per patient (over a period of
30 days following 1st mention
of the event)
$12,552.00 $14,811.36
Table 2. Cost of Adverse Events Related to Cancer Treatments
The type of costs identified included inpatient-outpatient costs and total healthcare costs.
The units of costs reported varied as: per patient, per-patient per-year (PPPY), per event and per episode.
Inpatient costs ranged from $6,000 per event to $48,000 per patient admission and outpatient costs varied
from $213 per event to $9,800 PPPY.
The inpatient cost per patient of treating thrombocytopenia was the highest as compared to the inpatient
costs of treating other AEs.
The total healthcare cost ranged from $15,000 per patient per 30-day post-event to $21,000 PPPY.
An economic burden is observed on cancer patients due to the AEs related to chemotherapy.
Figure 2. Distribution of studies reporting AEs (total = 15) Majority of studies (29%)
reported cost of treating
neutropenia, which is a major
AEs of chemotherapy.
Majority of included studies
were either healthcare claims
database (n = 10) or registry-
based studies (n = 2)
Only 5 studies included type of
cancer reported