1. International passenger growth slows in August
International freight up 19%
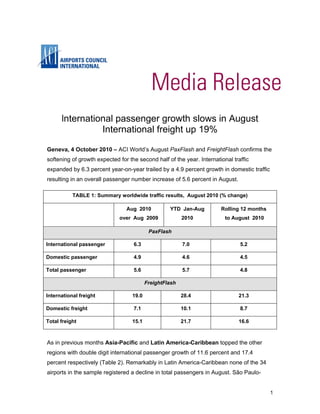
Geneva, 4 October 2010 – ACI World’s August PaxFlash and FreightFlash confirms the
softening of growth expected for the second half of the year. International traffic
expanded by 6.3 percent year-on-year trailed by a 4.9 percent growth in domestic traffic
resulting in an overall passenger number increase of 5.6 percent in August.
TABLE 1: Summary worldwide traffic results, August 2010 (% change)
Aug 2010 YTD Jan-Aug Rolling 12 months
over Aug 2009 2010 to August 2010
PaxFlash
International passenger 6.3 7.0 5.2
Domestic passenger 4.9 4.6 4.5
Total passenger 5.6 5.7 4.8
FreightFlash
International freight 19.0 28.4 21.3
Domestic freight 7.1 10.1 8.7
Total freight 15.1 21.7 16.6
As in previous months Asia-Pacific and Latin America-Caribbean topped the other
regions with double digit international passenger growth of 11.6 percent and 17.4
percent respectively (Table 2). Remarkably in Latin America-Caribbean none of the 34
airports in the sample registered a decline in total passengers in August. São Paulo-
1
2. Guarulhos the biggest airport in the sample registered a whopping 31 percent increase
while Mexico City only grew moderately (3.5%). Domestic traffic in the region grew event
stronger (+19.2%) than international passenger throughput (+17.4%). With the exception
of Salvador (+19%) all 15 Brazilian airports in the sample expanded by more than 20
percent driven by international and domestic traffic alike. In Asia-Pacific only Bangkok
Suvarnabhumi recorded a mild drop in passengers (-0.5%) whereas the other 36 airports
in the sample all reported growth led by airports in China and India. An 11.6 percent
increase in international was supplemented by 9 percent growth in domestic passenger
resulting in 9.9 percent overall growth.
The Middle East (+1.3%) experienced a marked slowdown in air travel as the Ramadan
season covered the best part of August reducing travel activity which also had some
effect on passenger numbers in other regions such as Africa, Europe and Asia-Pacific.
ACI Director Economics, Andreas Schimm comments, "While it is normal to see growth
numbers coming down as we start to compare growth against growth, it is positive to see
that the number of airports that still lose traffic reduced drastically with some regions
showing nothing but positive figures in the sample. Further softening of growth rates can
be expected during the last 4 months so that worldwide passenger numbers are
expected to increase between 4 and 5 percent in 2010".
In the freight market, international freight for the first time since November 2009 grew
less than 20 percent significantly down from its 35 percent peak in May (Table 3). The
Middle East and the Asia-Pacific region registered the slowest international growth rates
at 10.6 percent and 17.1 percent respectively. The other regions retained growth above
20 percent lead by Africa (+35.3%) and North America (+23.8%). Domestic freight was
accelerated by a 9.1 percent increase in North America which contrasted with a modest
3.1 percent growth in Asia-Pacific.
Schimm comments: “Total freight growth in August of 15.1 percent was lower than the
12-month rolling average of 16.6 percent which indicates a sharp softening of the
recovery. The relatively moderate numbers in Asia-Pacific and the Middle East which
2
3. account for half of the international air freight market could point to further slowing of
trade.”
Notes for editors
1. ACI, the only worldwide association of airports, is a non-profit organisation whose prime
purpose is to represent the interests of airports and to promote professional excellence in airport
management and operations. ACI has 575 members who operate over 1630 airports in 179
countries and territories.
2. PaxFlash and FreightFlash statistics are based on a significant sample of airports that provide
regular monthly reports to ACI. They represent approximately 60% of total passenger traffic and
70% of total freight traffic worldwide. Commentary, tables and charts are based on preliminary
data submitted by participating airports and are therefore subject to change.
3. Regional results and trend graphics are provided on the following pages.
3
4. Table 2: PaxFlash Summary – August 2010
STATS MONTH % YOY YTD AUG 2010 % YOY YE AUG 2010 % YOY
REGIONS
INTERNATIONAL PASSENGERS
AFR 6 929 4.0 45 135 9.4 66 672 6.7
ASP 32 515 11.6 240 465 15.6 352 390 13.2
EUR 90 201 4.8 547 767 2.9 802 807 1.4
LAC 5 925 17.4 46 151 13.8 65 749 9.9
MEA 7 739 1.1 59 400 11.5 86 876 12.2
NAM 17 599 4.5 122 677 5.1 176 060 3.1
ACI 160 908 6.3 1 061 596 7.0 1 550 555 5.2
DOMESTIC PASSENGERS
AFR 2 872 1.7 23 118 4.5 34 991 3.0
ASP 46 034 9.0 326 823 10.6 481 646 9.9
EUR 23 397 4.2 164 965 3.0 246 553 3.0
LAC 15 096 19.2 109 142 13.8 161 858 15.2
MEA
NAM 77 588 0.7 564 019 0.3 832 078 0.3
ACI 164 987 4.9 1 188 067 4.6 1 757 127 4.5
TOTAL PASSENGERS
AFR 9 890 3.4 68 865 7.6 102 553 5.3
ASP 79 484 9.9 574 516 12.6 844 928 11.2
EUR 114 000 4.7 715 379 2.9 1 053 251 1.7
LAC 21 664 18.6 160 043 13.4 234 729 13.3
MEA 7 954 1.3 61 216 11.4 89 514 11.9
NAM 95 264 1.3 687 476 1.1 1 009 295 0.7
ACI 328 256 5.6 2 267 495 5.7 3 334 270 4.8
DEFINITIONS:
International (000s). Traffic (passengers) performed between the designated airport and an airport in another
country/territory.
Domestic(000s). Traffic (passengers) performed between two airports located in the same
Country/territory.
Total (000s). International + domestic passengers + direct transfer passengers counted once (when
breakdown is available).
Total ≠ international + domestic
YOY Year over year same month comparison
YTD Year to date, starting January 2009, compared to same period previous year
YE Year end, based on rolling 12 month period, compared to same prior 12 month period
AFR – Africa, ASP – Asia Pacific (including India), EUR – Europe, LAC – Latin America and
Caribbean, MEA – Middle East, NAM – North America
4
5. Passenger Traffic Charts
Monthly comparisons for total passenger growth (corresponding to Table 2 comparisons:
month over month, year to date over year to date 2009, rolling 12 months over previous
12 months).
TOTAL PASSENGER TRENDS
10
YEAR-ON-YEAR YEAR-TO-DATE YEAR-END
8
6
4
% CHG
2
0
-2
-4
-6
AUG SEP OCT NOV DEC JAN FEB MAR APR MAY JUN JUL AUG
2010
Month by month comparison with same month previous year
5
6. World passenger trends
12
International Domestic Total
10
8
6
4
% CHG
2
0
-2
-4
-6
AUG SEP OCT NOV DEC JAN FEB MAR APR MAY JUN JUL AUG
2009 2010
Month by month comparison with same month previous year
Total Passenger
Regional Trends
25
AFR ASP EUR LAC MEA NAM
20
15
10
5
% CHG
0
-5
-10
-15
-20
AUG SEP OCT NOV DEC JAN FEB MAR APR MAY JUN JUL AUG
2009 2010
6
7. International Passenger
Regional Trends
50
AFR ASP EUR LAC MEA NAM
40
30
20
% CHG
10
0
-10
-20
AUG SEP OCT NOV DEC JAN FEB MAR APR MAY JUN JUL AUG
2009 2010
Month by month comparison with same month previous year
7
8. Table 3: Freight Flash Summary – August 2010
STATS YTD AUG YE AUG
MONTH % YOY % YOY % YOY
REGIONS 2010 2010
INTERNATIONAL FREIGHT
AFR 42.0 35.3 319.1 15.7 471.4 7.2
ASP 1 485.9 17.1 11 683.7 31.4 17 331.4 24.9
EUR 967.6 21.2 7 674.3 25.2 11 420.2 17.5
LAC 160.8 21.1 1 210.5 28.5 1 829.3 20.3
MEA 298.1 10.6 2 270.4 19.7 3 390.2 18.5
NAM 562.8 23.8 4 501.8 32.1 6 565.0 22.1
ACI 3 517.2 19.0 27 659.8 28.4 41 007.6 21.3
DOMESTIC FREIGHT
AFR 3.0 50.0 26.3 15.3 39.3 10.4
ASP 456.5 3.1 3 514.9 12.3 5 409.3 14.0
EUR 38.9 10.3 297.3 4.7 459.1 0.8
LAC 72.2 2.4 552.8 3.3 858.2 (0.3)
MEA
NAM 1 061.6 9.1 8 365.0 9.9 12 687.4 7.6
ACI 1 632.2 7.1 12 756.3 10.1 19 453.2 8.7
TOTAL FREIGHT
AFR 45.0 36.2 345.4 15.7 510.7 7.4
ASP 1 942.4 13.5 15 198.6 26.4 22 740.7 22.1
EUR 1 209.8 20.4 9 529.5 23.1 14 175.6 15.7
LAC 232.9 14.6 1 763.8 19.4 2 688.3 12.8
MEA 298.2 10.6 2 271.3 19.7 3 391.6 18.5
NAM 1 679.1 13.8 13 207.7 16.7 19 745.8 12.0
ACI 5 407.5 15.1 42 316.4 21.7 63 252.6 16.6
Data in 000s metric tonnes
DEFINITIONS:
International. Traffic (loaded+unloaded freight) performed between the designated airport and an airport in
another country/territory.
Domestic. Traffic (loaded+unloaded freight) performed between two airports located in the same
Country/territory.
Total. International + domestic freight (when breakdown is available).
Total ≠ international + domestic
Numbers may not foot due to rounding. *ANC data not included in summary.
YOY Year over year same month comparison
YTD Year to date, starting January 2009, compared to same period previous year
YE Year end, based on rolling 12 month period, compared to same prior 12 month period
AFR – Africa, ASP – Asia Pacific (including India), EUR – Europe, LAC – Latin America and
Caribbean, MEA – Middle East, NAM – North America
8
9. Freight Traffic Charts
Monthly comparisons for total freight growth (corresponding to Table 3 comparisons:
month over month, year to date over year to date 2009, rolling 12 months over previous
12 months)
TOTAL FREIGHT TRENDS
35
YEAR-ON-YEAR YEAR-TO-DATE YEAR-END
25
15
% CHG
5
-5
-15
-25
AUG SEP OCT NOV DEC JAN FEB MAR APR MAY JUN JUL AUG
2009 2010
Month by month comparison with same month previous year
9
10. World freight trends
40
International Domestic Total
35
30
25
20
15
% CHG
10
5
0
-5
-10
-15
AUG SEP OCT NOV DEC JAN FEB MAR APR MAY JUN JUL AUG
2009 2010
Month by month comparison with same month previous year
Total Freight
Regional Trends
60
AFR ASP EUR LAC MEA NAM
50
40
30
20
% CHG
10
0
-10
-20
-30
-40
AUG SEP OCT NOV DEC JAN FEB MAR APR MAY JUN JUL AUG
2009 2010
10
11. International Freight
Regional Trends
60
AFR ASP EUR LAC MEA NAM
50
40
30
20
% CHG
10
0
-10
-20
-30
-40
AUG SEP OCT NOV DEC JAN FEB MAR APR MAY JUN JUL AUG
2009 2010
Month by month comparison with same month previous year
- ENDS -
11