SlideShare a Scribd company logo
1 of 5
4. YTD Dashboard JUNSelect YTD Month
Cash at End of MonthProfit Before Tax Net Operating Cash Flow Net Financing Cash Flow Net Investing Cash Flow
86,487 47,271 93,242 52,644 698
Days Inventory Outstanding
Receivable Aging
Total Receivable 1,350
Overdue Receivable 605
Days Receivable Outstanding
Inventory Trend
Days Payable Outstanding
Payable Aging
8,500
8,700
9,000
8,500
9,000
8,500
8,600
9,000
8,500
9,000
8,500
9,000
3,362
4,298
4,901
10,000
4,250
4,002
4,734
4,023
4,650
4,701
4,016
4,592
5,138
4,402 4,099
(1,500)
4,750 4,498
3,866
4,977
3,850 4,299 4,484 4,408
(4,000)
(2,000)
-
2,000
4,000
6,000
8,000
10,000
12,000
JUL AUG SEP OCT NOV DEC JAN FEB MAR APR MAY JUN
Operating Cash Inflow Operating Cash Outflow Net Operting Cash Flow
93
540
405
270
135
< 30 Days < 60 Days < 90 Days > 90 Days
64
-
4,000
8,000
12,000
J A S O N D J F M A M J
240
180
120
60
< 30 Days < 60 Days < 90 Days > 90 Days
102
% of Overdue Receivable45%
Cash Flow
0 180 0 180 0 180
Total Payable:600
Total Inventory 8,765
1. Indicators
1. Indicators
2. Enter Data 1. Indicators Start Month: JUL
3. Monthly Dashboard Start Month: Current Year: 2019-20
4. YTD Dashboard Current Year:
Particular
2. Enter Data
3. Monthly Dashboard
4. YTD Dashboard
Month
JAN
FEB
MAR
APR
MAY
JUN
JUL
AUG
SEP
OCT
NOV
DEC
TOTAL
2. Enter Data Month Dashboard YTD Dashboard
1. Indicators MAY JUN
2. Enter Data Sl Particular JUL AUG SEP OCT NOV DEC JAN FEB MAR APR MAY JUN Calculation Type Selected Month YTD
3. Monthly Dashboard 1 Profit Before Tax 6,767 5,678 6,789 9,876 -2,500 8,765 9,087 6,543 7,865 8,976 9,876 8,765 Sum 9,876 86,487
4. YTD Dashboard 2 Operating Cash Inflow 8,500 8,700 9,000 8,500 9,000 8,500 8,600 9,000 8,500 9,000 8,500 9,000 Sum 8,500 104,800
3 Operating Cash Outflow 3,362 4,298 4,901 10,000 4,250 4,002 4,734 4,023 4,650 4,701 4,016 4,592 Sum 4,016 57,529
4 Net Operating Cash Flow 5,138 4,402 4,099 -1,500 4,750 4,498 3,866 4,977 3,850 4,299 4,484 4,408 Sum 4,484 47,271
5 Financing Cash Inflow 3,994 7,562 10,469 13,908 17,836 21,383 24,457 29,935 33,598 37,723 42,377 45,000 Sum 42,377 288,242
6 Financing Cash Outflow 5,000 7,000 9,000 11,000 13,000 15,000 17,000 19,000 20,000 23,000 26,000 30,000 Sum 26,000 195,000
7 Net Financing Cash Flow -1,006 562 1,469 2,908 4,836 6,383 7,457 10,935 13,598 14,723 16,377 15,000 Sum 16,377 93,242
8 Investing Cash Inflow 8,500 8,700 9,000 8,500 9,000 8,500 8,600 9,000 8,500 9,000 8,500 9,000 Sum 8,500 104,800
9 Investing Cash Otflow 3,362 4,298 4,901 4,627 4,250 4,002 4,734 4,023 4,650 4,701 4,016 4,592 Sum 4,016 52,156
10 Net Investing Cash Flow 5,138 4,402 4,099 3,873 4,750 4,498 3,866 4,977 3,850 4,299 4,484 4,408 Sum 4,484 52,644
11 Cash at End of Month 544 507 557 613 570 644 525 559 622 789 813 698 Last Value 813 698
12 Inventory 6,767 5,678 6,789 9,876 9,090 8,765 9,087 6,543 7,865 8,976 9,876 8,765 Last Value 9,876 8,765
13 Days Inventory Outstanding 30 86 33 79 33 43 68 84 74 61 37 64 Last Value 37 64
14 Accounts Receivable 1,275 1,305 1,350 1,275 1,350 1,275 1,290 1,350 1,275 1,350 1,275 1,350 Last Value 1,275 1,350
15 Days Receivable Outstanding 81 39 94 53 99 29 58 87 40 110 89 93 Last Value 89 93
16 Overdue Accounts Receivable 511 435 465 586 570 553 622 572 430 642 409 605 Last Value 409 605
17 % of Overdue Receivable 40% 33% 34% 46% 42% 43% 48% 42% 34% 48% 32% 45% Last Value 32% 45%
18 Accounts Receivable Aging
19 <30 Days 510 522 540 510 540 510 516 540 510 540 510 540 Last Value 510 540
20 <60 Days 383 392 405 383 405 383 387 405 383 405 383 405 Last Value 383 405
21 <90 Days 255 261 270 255 270 255 258 270 255 270 255 270 Last Value 255 270
22 >90 Days 128 131 135 128 135 128 129 135 128 135 128 135 Last Value 128 135
23 Toal Accounts Receivable 1,275 1,305 1,350 1,275 1,350 1,275 1,290 1,350 1,275 1,350 1,275 1,350
(Total Accounts Receivable and
Total of Receivable Aging must
be equal)
- - - - - - - - - - - -
24 Accounts Payable 800 900 750 1,000 1,200 1,500 900 800 700 600 700 600 Last Value 700 600
25 Days Payable Outstanding 162 57 56 94 92 39 51 60 127 158 145 102 Last Value 145 102
26 Accounts Payable Aging
27 <30 Days 320 360 300 400 480 600 360 320 280 240 280 240 Last Value 280 240
28 <60 Days 240 270 225 300 360 450 270 240 210 180 210 180 Last Value 210 180
29 <90 Days 160 180 150 200 240 300 180 160 140 120 140 120 Last Value 140 120
30 >90 Days 80 90 75 100 120 150 90 80 70 60 70 60 Last Value 70 60
31 Toal Accounts Payable 800 900 750 1,000 1,200 1,500 900 800 700 600 700 600
(Total Accounts Payable and
Total of Payable Aging must be
equal)
- - - - - - - - - - - -
3. Monthly Dashboard MAY
1. Indicators
2. Enter Data
3. Monthly Dashboard
4. YTD Dashboard
Net Investing Cash Flow
4,484
Cash at End of Month
813
Select Month
Net Financing Cash Flow
16,377
Profit Before Tax
9,876
Net Operating Cash Flow
4,484
8,500
8,700
9,000
8,500
9,000
8,500
8,600
9,000
8,500
9,000
8,500
3,362
4,298
4,901
10,000
4,250
4,002
4,734
4,023
4,650
4,701
4,016
5,138
4,402 4,099
(1,500)
4,750 4,498
3,866
4,977
3,850 4,299 4,484
(5,000)
-
5,000
10,000
15,000
JUL AUG SEP OCT NOV DEC JAN FEB MAR APR MAY
Operating Cash Inflow Operating Cash Outflow Net Operting Cash Flow
510
383
255
128
< 30 Days < 60 Days < 90 Days > 90 Days
Days Inventory Outstanding
89
Receivable Aging
Total Receivable 1,275
Overdue Receivable 409
37
Days Receivable Outstanding
Inventory Trend
145
Days Payable Outstanding
280
210
140
70
< 30 Days < 60 Days < 90 Days > 90 Days
Payable Aging
Total Payable:700
-
4,000
8,000
12,000
J A S O N D J F M A M
% of Overdue Receivable 32%
Cash Flow
0 180 0 180 0 180
Total Inventory 9,876
4. YTD Dashboard JUN
1. Indicators
2. Enter Data
3. Monthly Dashboard
4. YTD Dashboard
86,487 47,271 93,242 52,644 698
Select YTD Month
Cash at End of MonthProfit Before Tax Net Operating Cash Flow Net Financing Cash Flow Net Investing Cash Flow
Days Inventory Outstanding
Receivable Aging
Total Receivable 1,350
Overdue Receivable 605
Days Receivable Outstanding
Inventory Trend
Days Payable Outstanding
Payable Aging
8,500
8,700
9,000
8,500
9,000
8,500
8,600
9,000
8,500
9,000
8,500
9,000
3,362
4,298
4,901
10,000
4,250
4,002
4,734
4,023
4,650
4,701
4,016
4,592
5,138
4,402 4,099
(1,500)
4,750 4,498
3,866
4,977
3,850 4,299 4,484 4,408
(4,000)
(2,000)
-
2,000
4,000
6,000
8,000
10,000
12,000
JUL AUG SEP OCT NOV DEC JAN FEB MAR APR MAY JUN
Operating Cash Inflow Operating Cash Outflow Net Operting Cash Flow
93
540
405
270
135
< 30 Days < 60 Days < 90 Days > 90 Days
64
-
4,000
8,000
12,000
J A S O N D J F M A M J
240
180
120
60
< 30 Days < 60 Days < 90 Days > 90 Days
102
% of Overdue Receivable45%
Cash Flow
0 180 0 180 0 180
Total Payable:600
Total Inventory 8,765

More Related Content

What's hot

Financial Forecast PowerPoint Presentation Slides
Financial Forecast PowerPoint Presentation Slides Financial Forecast PowerPoint Presentation Slides
Financial Forecast PowerPoint Presentation Slides SlideTeam
 
Karnataka PGCET MBA 2015 Answer Key
Karnataka PGCET MBA 2015 Answer KeyKarnataka PGCET MBA 2015 Answer Key
Karnataka PGCET MBA 2015 Answer KeyEneutron
 
Sbi life smart scholar highlights
Sbi life smart scholar   highlightsSbi life smart scholar   highlights
Sbi life smart scholar highlightsMurali Reddy
 
Sales Performance Dashboard Sales Comparison Sales By Product Category
Sales Performance Dashboard Sales Comparison Sales By Product CategorySales Performance Dashboard Sales Comparison Sales By Product Category
Sales Performance Dashboard Sales Comparison Sales By Product CategorySlideTeam
 
Data togel hongkong hk 2005
Data togel hongkong hk 2005Data togel hongkong hk 2005
Data togel hongkong hk 2005Robby Kurniawan
 
Khakis 'R US Pitch Book (Merger and Acquisition Valuation)
Khakis 'R US Pitch Book (Merger and Acquisition Valuation) Khakis 'R US Pitch Book (Merger and Acquisition Valuation)
Khakis 'R US Pitch Book (Merger and Acquisition Valuation) Mark Webster
 
Example Presentation Of Financial Reports PowerPoint Presentation Slides
Example Presentation Of Financial Reports PowerPoint Presentation Slides Example Presentation Of Financial Reports PowerPoint Presentation Slides
Example Presentation Of Financial Reports PowerPoint Presentation Slides SlideTeam
 
The UK Neo-banks: A Comparative Analysis
The UK Neo-banks: A Comparative AnalysisThe UK Neo-banks: A Comparative Analysis
The UK Neo-banks: A Comparative AnalysisFintech Fraternity
 
Dashboards By Function Powerpoint Presentation Slides
Dashboards By Function Powerpoint Presentation SlidesDashboards By Function Powerpoint Presentation Slides
Dashboards By Function Powerpoint Presentation SlidesSlideTeam
 
Overview of HR Shared Services
Overview of HR Shared ServicesOverview of HR Shared Services
Overview of HR Shared ServicesWilliam Chin
 
Tabla salarial docentes decreto 1278 de 2002 historico
Tabla salarial docentes decreto 1278 de 2002 historicoTabla salarial docentes decreto 1278 de 2002 historico
Tabla salarial docentes decreto 1278 de 2002 historicoCarlos Estrada
 
Ultimate Accounting "Cheat Sheet"
Ultimate Accounting "Cheat Sheet"Ultimate Accounting "Cheat Sheet"
Ultimate Accounting "Cheat Sheet"Joe Jancsics
 

What's hot (20)

Present value tables
Present value tablesPresent value tables
Present value tables
 
Financial Forecast PowerPoint Presentation Slides
Financial Forecast PowerPoint Presentation Slides Financial Forecast PowerPoint Presentation Slides
Financial Forecast PowerPoint Presentation Slides
 
Finance Department
Finance DepartmentFinance Department
Finance Department
 
Karnataka PGCET MBA 2015 Answer Key
Karnataka PGCET MBA 2015 Answer KeyKarnataka PGCET MBA 2015 Answer Key
Karnataka PGCET MBA 2015 Answer Key
 
Sbi life smart scholar highlights
Sbi life smart scholar   highlightsSbi life smart scholar   highlights
Sbi life smart scholar highlights
 
Ch07
Ch07Ch07
Ch07
 
Elite Builder
Elite BuilderElite Builder
Elite Builder
 
Sales Performance Dashboard Sales Comparison Sales By Product Category
Sales Performance Dashboard Sales Comparison Sales By Product CategorySales Performance Dashboard Sales Comparison Sales By Product Category
Sales Performance Dashboard Sales Comparison Sales By Product Category
 
Data togel hongkong hk 2005
Data togel hongkong hk 2005Data togel hongkong hk 2005
Data togel hongkong hk 2005
 
21.9 The Budgeted Balance Sheet
21.9  The Budgeted Balance Sheet21.9  The Budgeted Balance Sheet
21.9 The Budgeted Balance Sheet
 
Khakis 'R US Pitch Book (Merger and Acquisition Valuation)
Khakis 'R US Pitch Book (Merger and Acquisition Valuation) Khakis 'R US Pitch Book (Merger and Acquisition Valuation)
Khakis 'R US Pitch Book (Merger and Acquisition Valuation)
 
Example Presentation Of Financial Reports PowerPoint Presentation Slides
Example Presentation Of Financial Reports PowerPoint Presentation Slides Example Presentation Of Financial Reports PowerPoint Presentation Slides
Example Presentation Of Financial Reports PowerPoint Presentation Slides
 
The UK Neo-banks: A Comparative Analysis
The UK Neo-banks: A Comparative AnalysisThe UK Neo-banks: A Comparative Analysis
The UK Neo-banks: A Comparative Analysis
 
Balanced score card
Balanced score cardBalanced score card
Balanced score card
 
Dashboards By Function Powerpoint Presentation Slides
Dashboards By Function Powerpoint Presentation SlidesDashboards By Function Powerpoint Presentation Slides
Dashboards By Function Powerpoint Presentation Slides
 
Overview of HR Shared Services
Overview of HR Shared ServicesOverview of HR Shared Services
Overview of HR Shared Services
 
FT Partners Research - Prepare for the InsurTech Wave
FT Partners Research - Prepare for the InsurTech WaveFT Partners Research - Prepare for the InsurTech Wave
FT Partners Research - Prepare for the InsurTech Wave
 
Tabla salarial docentes decreto 1278 de 2002 historico
Tabla salarial docentes decreto 1278 de 2002 historicoTabla salarial docentes decreto 1278 de 2002 historico
Tabla salarial docentes decreto 1278 de 2002 historico
 
Ultimate Accounting "Cheat Sheet"
Ultimate Accounting "Cheat Sheet"Ultimate Accounting "Cheat Sheet"
Ultimate Accounting "Cheat Sheet"
 
The Lean CFO
The Lean CFOThe Lean CFO
The Lean CFO
 

Similar to Cash Flow Dashboard in Excel

Muthengi mike bamburi financial model - enhancement
Muthengi mike   bamburi financial model - enhancementMuthengi mike   bamburi financial model - enhancement
Muthengi mike bamburi financial model - enhancementMike Muthengi
 
GuessBox Financial Model 2017
GuessBox Financial Model 2017GuessBox Financial Model 2017
GuessBox Financial Model 2017GuessBox
 
Final work improved 6_revised (1)
Final work improved 6_revised (1)Final work improved 6_revised (1)
Final work improved 6_revised (1)Qasim Ali Pracha
 
Investment In Business Assets PowerPoint Presentation Slides
Investment In Business Assets PowerPoint Presentation SlidesInvestment In Business Assets PowerPoint Presentation Slides
Investment In Business Assets PowerPoint Presentation SlidesSlideTeam
 
Horniman Horticulture, FIL 349 ( Advanced Financial Theory and Problems)
Horniman Horticulture, FIL 349 ( Advanced Financial Theory and Problems)Horniman Horticulture, FIL 349 ( Advanced Financial Theory and Problems)
Horniman Horticulture, FIL 349 ( Advanced Financial Theory and Problems)CameronMcintosh8
 
8 Metrics for Creative Service Companies
8 Metrics for Creative Service Companies8 Metrics for Creative Service Companies
8 Metrics for Creative Service CompaniesSummit CPA Group
 
How to Prepare Budgets & Projections
How to Prepare Budgets &  ProjectionsHow to Prepare Budgets &  Projections
How to Prepare Budgets & ProjectionsTraklight.com
 
Fixed Investment Analysis PowerPoint Presentation Slides
Fixed Investment Analysis PowerPoint Presentation SlidesFixed Investment Analysis PowerPoint Presentation Slides
Fixed Investment Analysis PowerPoint Presentation SlidesSlideTeam
 
Income Statement Prediction
Income Statement Prediction Income Statement Prediction
Income Statement Prediction Iman Najafi
 
Neslte India Ltd_Financial Model Working.pdf
Neslte India Ltd_Financial Model Working.pdfNeslte India Ltd_Financial Model Working.pdf
Neslte India Ltd_Financial Model Working.pdfDeepakKumar234566
 
International Contractor Overviews Q2 2017
International Contractor Overviews Q2 2017International Contractor Overviews Q2 2017
International Contractor Overviews Q2 2017Jonathan Hunt
 
Aminullah assagaf mp2 manajemen proyek
Aminullah assagaf mp2 manajemen proyekAminullah assagaf mp2 manajemen proyek
Aminullah assagaf mp2 manajemen proyekAminullah Assagaf
 
Aminullah assagaf mp2 manajemen proyek
Aminullah assagaf mp2 manajemen proyekAminullah assagaf mp2 manajemen proyek
Aminullah assagaf mp2 manajemen proyekAminullah Assagaf
 

Similar to Cash Flow Dashboard in Excel (20)

Muthengi mike bamburi financial model - enhancement
Muthengi mike   bamburi financial model - enhancementMuthengi mike   bamburi financial model - enhancement
Muthengi mike bamburi financial model - enhancement
 
GuessBox Financial Model 2017
GuessBox Financial Model 2017GuessBox Financial Model 2017
GuessBox Financial Model 2017
 
Aminullah assagaf mk19 ch 5
Aminullah assagaf mk19 ch 5Aminullah assagaf mk19 ch 5
Aminullah assagaf mk19 ch 5
 
Final work improved 6_revised (1)
Final work improved 6_revised (1)Final work improved 6_revised (1)
Final work improved 6_revised (1)
 
Work sample
Work sampleWork sample
Work sample
 
Investment In Business Assets PowerPoint Presentation Slides
Investment In Business Assets PowerPoint Presentation SlidesInvestment In Business Assets PowerPoint Presentation Slides
Investment In Business Assets PowerPoint Presentation Slides
 
Horniman Horticulture, FIL 349 ( Advanced Financial Theory and Problems)
Horniman Horticulture, FIL 349 ( Advanced Financial Theory and Problems)Horniman Horticulture, FIL 349 ( Advanced Financial Theory and Problems)
Horniman Horticulture, FIL 349 ( Advanced Financial Theory and Problems)
 
MF
MFMF
MF
 
bKash equity valuation 2018
bKash equity valuation 2018bKash equity valuation 2018
bKash equity valuation 2018
 
120981064 new-doll
120981064 new-doll120981064 new-doll
120981064 new-doll
 
8 Metrics for Creative Service Companies
8 Metrics for Creative Service Companies8 Metrics for Creative Service Companies
8 Metrics for Creative Service Companies
 
Financial model
Financial modelFinancial model
Financial model
 
How to Prepare Budgets & Projections
How to Prepare Budgets &  ProjectionsHow to Prepare Budgets &  Projections
How to Prepare Budgets & Projections
 
Fixed Investment Analysis PowerPoint Presentation Slides
Fixed Investment Analysis PowerPoint Presentation SlidesFixed Investment Analysis PowerPoint Presentation Slides
Fixed Investment Analysis PowerPoint Presentation Slides
 
Income Statement Prediction
Income Statement Prediction Income Statement Prediction
Income Statement Prediction
 
Neslte India Ltd_Financial Model Working.pdf
Neslte India Ltd_Financial Model Working.pdfNeslte India Ltd_Financial Model Working.pdf
Neslte India Ltd_Financial Model Working.pdf
 
International Contractor Overviews Q2 2017
International Contractor Overviews Q2 2017International Contractor Overviews Q2 2017
International Contractor Overviews Q2 2017
 
INVESTAURA_Business-Planning-Template.pdf
INVESTAURA_Business-Planning-Template.pdfINVESTAURA_Business-Planning-Template.pdf
INVESTAURA_Business-Planning-Template.pdf
 
Aminullah assagaf mp2 manajemen proyek
Aminullah assagaf mp2 manajemen proyekAminullah assagaf mp2 manajemen proyek
Aminullah assagaf mp2 manajemen proyek
 
Aminullah assagaf mp2 manajemen proyek
Aminullah assagaf mp2 manajemen proyekAminullah assagaf mp2 manajemen proyek
Aminullah assagaf mp2 manajemen proyek
 

Recently uploaded

Industrialised data - the key to AI success.pdf
Industrialised data - the key to AI success.pdfIndustrialised data - the key to AI success.pdf
Industrialised data - the key to AI success.pdfLars Albertsson
 
Halmar dropshipping via API with DroFx
Halmar  dropshipping  via API with DroFxHalmar  dropshipping  via API with DroFx
Halmar dropshipping via API with DroFxolyaivanovalion
 
Schema on read is obsolete. Welcome metaprogramming..pdf
Schema on read is obsolete. Welcome metaprogramming..pdfSchema on read is obsolete. Welcome metaprogramming..pdf
Schema on read is obsolete. Welcome metaprogramming..pdfLars Albertsson
 
Ukraine War presentation: KNOW THE BASICS
Ukraine War presentation: KNOW THE BASICSUkraine War presentation: KNOW THE BASICS
Ukraine War presentation: KNOW THE BASICSAishani27
 
Generative AI on Enterprise Cloud with NiFi and Milvus
Generative AI on Enterprise Cloud with NiFi and MilvusGenerative AI on Enterprise Cloud with NiFi and Milvus
Generative AI on Enterprise Cloud with NiFi and MilvusTimothy Spann
 
CebaBaby dropshipping via API with DroFX.pptx
CebaBaby dropshipping via API with DroFX.pptxCebaBaby dropshipping via API with DroFX.pptx
CebaBaby dropshipping via API with DroFX.pptxolyaivanovalion
 
VIP High Class Call Girls Jamshedpur Anushka 8250192130 Independent Escort Se...
VIP High Class Call Girls Jamshedpur Anushka 8250192130 Independent Escort Se...VIP High Class Call Girls Jamshedpur Anushka 8250192130 Independent Escort Se...
VIP High Class Call Girls Jamshedpur Anushka 8250192130 Independent Escort Se...Suhani Kapoor
 
Unveiling Insights: The Role of a Data Analyst
Unveiling Insights: The Role of a Data AnalystUnveiling Insights: The Role of a Data Analyst
Unveiling Insights: The Role of a Data AnalystSamantha Rae Coolbeth
 
BigBuy dropshipping via API with DroFx.pptx
BigBuy dropshipping via API with DroFx.pptxBigBuy dropshipping via API with DroFx.pptx
BigBuy dropshipping via API with DroFx.pptxolyaivanovalion
 
Delhi Call Girls Punjabi Bagh 9711199171 ☎✔👌✔ Whatsapp Hard And Sexy Vip Call
Delhi Call Girls Punjabi Bagh 9711199171 ☎✔👌✔ Whatsapp Hard And Sexy Vip CallDelhi Call Girls Punjabi Bagh 9711199171 ☎✔👌✔ Whatsapp Hard And Sexy Vip Call
Delhi Call Girls Punjabi Bagh 9711199171 ☎✔👌✔ Whatsapp Hard And Sexy Vip Callshivangimorya083
 
Log Analysis using OSSEC sasoasasasas.pptx
Log Analysis using OSSEC sasoasasasas.pptxLog Analysis using OSSEC sasoasasasas.pptx
Log Analysis using OSSEC sasoasasasas.pptxJohnnyPlasten
 
Week-01-2.ppt BBB human Computer interaction
Week-01-2.ppt BBB human Computer interactionWeek-01-2.ppt BBB human Computer interaction
Week-01-2.ppt BBB human Computer interactionfulawalesam
 
Delhi Call Girls CP 9711199171 ☎✔👌✔ Whatsapp Hard And Sexy Vip Call
Delhi Call Girls CP 9711199171 ☎✔👌✔ Whatsapp Hard And Sexy Vip CallDelhi Call Girls CP 9711199171 ☎✔👌✔ Whatsapp Hard And Sexy Vip Call
Delhi Call Girls CP 9711199171 ☎✔👌✔ Whatsapp Hard And Sexy Vip Callshivangimorya083
 
VIP High Profile Call Girls Amravati Aarushi 8250192130 Independent Escort Se...
VIP High Profile Call Girls Amravati Aarushi 8250192130 Independent Escort Se...VIP High Profile Call Girls Amravati Aarushi 8250192130 Independent Escort Se...
VIP High Profile Call Girls Amravati Aarushi 8250192130 Independent Escort Se...Suhani Kapoor
 
Invezz.com - Grow your wealth with trading signals
Invezz.com - Grow your wealth with trading signalsInvezz.com - Grow your wealth with trading signals
Invezz.com - Grow your wealth with trading signalsInvezz1
 
Brighton SEO | April 2024 | Data Storytelling
Brighton SEO | April 2024 | Data StorytellingBrighton SEO | April 2024 | Data Storytelling
Brighton SEO | April 2024 | Data StorytellingNeil Barnes
 
Call me @ 9892124323 Cheap Rate Call Girls in Vashi with Real Photo 100% Secure
Call me @ 9892124323  Cheap Rate Call Girls in Vashi with Real Photo 100% SecureCall me @ 9892124323  Cheap Rate Call Girls in Vashi with Real Photo 100% Secure
Call me @ 9892124323 Cheap Rate Call Girls in Vashi with Real Photo 100% SecurePooja Nehwal
 
Midocean dropshipping via API with DroFx
Midocean dropshipping via API with DroFxMidocean dropshipping via API with DroFx
Midocean dropshipping via API with DroFxolyaivanovalion
 
꧁❤ Greater Noida Call Girls Delhi ❤꧂ 9711199171 ☎️ Hard And Sexy Vip Call
꧁❤ Greater Noida Call Girls Delhi ❤꧂ 9711199171 ☎️ Hard And Sexy Vip Call꧁❤ Greater Noida Call Girls Delhi ❤꧂ 9711199171 ☎️ Hard And Sexy Vip Call
꧁❤ Greater Noida Call Girls Delhi ❤꧂ 9711199171 ☎️ Hard And Sexy Vip Callshivangimorya083
 
FESE Capital Markets Fact Sheet 2024 Q1.pdf
FESE Capital Markets Fact Sheet 2024 Q1.pdfFESE Capital Markets Fact Sheet 2024 Q1.pdf
FESE Capital Markets Fact Sheet 2024 Q1.pdfMarinCaroMartnezBerg
 

Recently uploaded (20)

Industrialised data - the key to AI success.pdf
Industrialised data - the key to AI success.pdfIndustrialised data - the key to AI success.pdf
Industrialised data - the key to AI success.pdf
 
Halmar dropshipping via API with DroFx
Halmar  dropshipping  via API with DroFxHalmar  dropshipping  via API with DroFx
Halmar dropshipping via API with DroFx
 
Schema on read is obsolete. Welcome metaprogramming..pdf
Schema on read is obsolete. Welcome metaprogramming..pdfSchema on read is obsolete. Welcome metaprogramming..pdf
Schema on read is obsolete. Welcome metaprogramming..pdf
 
Ukraine War presentation: KNOW THE BASICS
Ukraine War presentation: KNOW THE BASICSUkraine War presentation: KNOW THE BASICS
Ukraine War presentation: KNOW THE BASICS
 
Generative AI on Enterprise Cloud with NiFi and Milvus
Generative AI on Enterprise Cloud with NiFi and MilvusGenerative AI on Enterprise Cloud with NiFi and Milvus
Generative AI on Enterprise Cloud with NiFi and Milvus
 
CebaBaby dropshipping via API with DroFX.pptx
CebaBaby dropshipping via API with DroFX.pptxCebaBaby dropshipping via API with DroFX.pptx
CebaBaby dropshipping via API with DroFX.pptx
 
VIP High Class Call Girls Jamshedpur Anushka 8250192130 Independent Escort Se...
VIP High Class Call Girls Jamshedpur Anushka 8250192130 Independent Escort Se...VIP High Class Call Girls Jamshedpur Anushka 8250192130 Independent Escort Se...
VIP High Class Call Girls Jamshedpur Anushka 8250192130 Independent Escort Se...
 
Unveiling Insights: The Role of a Data Analyst
Unveiling Insights: The Role of a Data AnalystUnveiling Insights: The Role of a Data Analyst
Unveiling Insights: The Role of a Data Analyst
 
BigBuy dropshipping via API with DroFx.pptx
BigBuy dropshipping via API with DroFx.pptxBigBuy dropshipping via API with DroFx.pptx
BigBuy dropshipping via API with DroFx.pptx
 
Delhi Call Girls Punjabi Bagh 9711199171 ☎✔👌✔ Whatsapp Hard And Sexy Vip Call
Delhi Call Girls Punjabi Bagh 9711199171 ☎✔👌✔ Whatsapp Hard And Sexy Vip CallDelhi Call Girls Punjabi Bagh 9711199171 ☎✔👌✔ Whatsapp Hard And Sexy Vip Call
Delhi Call Girls Punjabi Bagh 9711199171 ☎✔👌✔ Whatsapp Hard And Sexy Vip Call
 
Log Analysis using OSSEC sasoasasasas.pptx
Log Analysis using OSSEC sasoasasasas.pptxLog Analysis using OSSEC sasoasasasas.pptx
Log Analysis using OSSEC sasoasasasas.pptx
 
Week-01-2.ppt BBB human Computer interaction
Week-01-2.ppt BBB human Computer interactionWeek-01-2.ppt BBB human Computer interaction
Week-01-2.ppt BBB human Computer interaction
 
Delhi Call Girls CP 9711199171 ☎✔👌✔ Whatsapp Hard And Sexy Vip Call
Delhi Call Girls CP 9711199171 ☎✔👌✔ Whatsapp Hard And Sexy Vip CallDelhi Call Girls CP 9711199171 ☎✔👌✔ Whatsapp Hard And Sexy Vip Call
Delhi Call Girls CP 9711199171 ☎✔👌✔ Whatsapp Hard And Sexy Vip Call
 
VIP High Profile Call Girls Amravati Aarushi 8250192130 Independent Escort Se...
VIP High Profile Call Girls Amravati Aarushi 8250192130 Independent Escort Se...VIP High Profile Call Girls Amravati Aarushi 8250192130 Independent Escort Se...
VIP High Profile Call Girls Amravati Aarushi 8250192130 Independent Escort Se...
 
Invezz.com - Grow your wealth with trading signals
Invezz.com - Grow your wealth with trading signalsInvezz.com - Grow your wealth with trading signals
Invezz.com - Grow your wealth with trading signals
 
Brighton SEO | April 2024 | Data Storytelling
Brighton SEO | April 2024 | Data StorytellingBrighton SEO | April 2024 | Data Storytelling
Brighton SEO | April 2024 | Data Storytelling
 
Call me @ 9892124323 Cheap Rate Call Girls in Vashi with Real Photo 100% Secure
Call me @ 9892124323  Cheap Rate Call Girls in Vashi with Real Photo 100% SecureCall me @ 9892124323  Cheap Rate Call Girls in Vashi with Real Photo 100% Secure
Call me @ 9892124323 Cheap Rate Call Girls in Vashi with Real Photo 100% Secure
 
Midocean dropshipping via API with DroFx
Midocean dropshipping via API with DroFxMidocean dropshipping via API with DroFx
Midocean dropshipping via API with DroFx
 
꧁❤ Greater Noida Call Girls Delhi ❤꧂ 9711199171 ☎️ Hard And Sexy Vip Call
꧁❤ Greater Noida Call Girls Delhi ❤꧂ 9711199171 ☎️ Hard And Sexy Vip Call꧁❤ Greater Noida Call Girls Delhi ❤꧂ 9711199171 ☎️ Hard And Sexy Vip Call
꧁❤ Greater Noida Call Girls Delhi ❤꧂ 9711199171 ☎️ Hard And Sexy Vip Call
 
FESE Capital Markets Fact Sheet 2024 Q1.pdf
FESE Capital Markets Fact Sheet 2024 Q1.pdfFESE Capital Markets Fact Sheet 2024 Q1.pdf
FESE Capital Markets Fact Sheet 2024 Q1.pdf
 

Cash Flow Dashboard in Excel

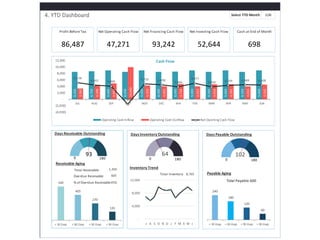
  • 1. 4. YTD Dashboard JUNSelect YTD Month Cash at End of MonthProfit Before Tax Net Operating Cash Flow Net Financing Cash Flow Net Investing Cash Flow 86,487 47,271 93,242 52,644 698 Days Inventory Outstanding Receivable Aging Total Receivable 1,350 Overdue Receivable 605 Days Receivable Outstanding Inventory Trend Days Payable Outstanding Payable Aging 8,500 8,700 9,000 8,500 9,000 8,500 8,600 9,000 8,500 9,000 8,500 9,000 3,362 4,298 4,901 10,000 4,250 4,002 4,734 4,023 4,650 4,701 4,016 4,592 5,138 4,402 4,099 (1,500) 4,750 4,498 3,866 4,977 3,850 4,299 4,484 4,408 (4,000) (2,000) - 2,000 4,000 6,000 8,000 10,000 12,000 JUL AUG SEP OCT NOV DEC JAN FEB MAR APR MAY JUN Operating Cash Inflow Operating Cash Outflow Net Operting Cash Flow 93 540 405 270 135 < 30 Days < 60 Days < 90 Days > 90 Days 64 - 4,000 8,000 12,000 J A S O N D J F M A M J 240 180 120 60 < 30 Days < 60 Days < 90 Days > 90 Days 102 % of Overdue Receivable45% Cash Flow 0 180 0 180 0 180 Total Payable:600 Total Inventory 8,765
  • 2. 1. Indicators 1. Indicators 2. Enter Data 1. Indicators Start Month: JUL 3. Monthly Dashboard Start Month: Current Year: 2019-20 4. YTD Dashboard Current Year: Particular 2. Enter Data 3. Monthly Dashboard 4. YTD Dashboard Month JAN FEB MAR APR MAY JUN JUL AUG SEP OCT NOV DEC TOTAL
  • 3. 2. Enter Data Month Dashboard YTD Dashboard 1. Indicators MAY JUN 2. Enter Data Sl Particular JUL AUG SEP OCT NOV DEC JAN FEB MAR APR MAY JUN Calculation Type Selected Month YTD 3. Monthly Dashboard 1 Profit Before Tax 6,767 5,678 6,789 9,876 -2,500 8,765 9,087 6,543 7,865 8,976 9,876 8,765 Sum 9,876 86,487 4. YTD Dashboard 2 Operating Cash Inflow 8,500 8,700 9,000 8,500 9,000 8,500 8,600 9,000 8,500 9,000 8,500 9,000 Sum 8,500 104,800 3 Operating Cash Outflow 3,362 4,298 4,901 10,000 4,250 4,002 4,734 4,023 4,650 4,701 4,016 4,592 Sum 4,016 57,529 4 Net Operating Cash Flow 5,138 4,402 4,099 -1,500 4,750 4,498 3,866 4,977 3,850 4,299 4,484 4,408 Sum 4,484 47,271 5 Financing Cash Inflow 3,994 7,562 10,469 13,908 17,836 21,383 24,457 29,935 33,598 37,723 42,377 45,000 Sum 42,377 288,242 6 Financing Cash Outflow 5,000 7,000 9,000 11,000 13,000 15,000 17,000 19,000 20,000 23,000 26,000 30,000 Sum 26,000 195,000 7 Net Financing Cash Flow -1,006 562 1,469 2,908 4,836 6,383 7,457 10,935 13,598 14,723 16,377 15,000 Sum 16,377 93,242 8 Investing Cash Inflow 8,500 8,700 9,000 8,500 9,000 8,500 8,600 9,000 8,500 9,000 8,500 9,000 Sum 8,500 104,800 9 Investing Cash Otflow 3,362 4,298 4,901 4,627 4,250 4,002 4,734 4,023 4,650 4,701 4,016 4,592 Sum 4,016 52,156 10 Net Investing Cash Flow 5,138 4,402 4,099 3,873 4,750 4,498 3,866 4,977 3,850 4,299 4,484 4,408 Sum 4,484 52,644 11 Cash at End of Month 544 507 557 613 570 644 525 559 622 789 813 698 Last Value 813 698 12 Inventory 6,767 5,678 6,789 9,876 9,090 8,765 9,087 6,543 7,865 8,976 9,876 8,765 Last Value 9,876 8,765 13 Days Inventory Outstanding 30 86 33 79 33 43 68 84 74 61 37 64 Last Value 37 64 14 Accounts Receivable 1,275 1,305 1,350 1,275 1,350 1,275 1,290 1,350 1,275 1,350 1,275 1,350 Last Value 1,275 1,350 15 Days Receivable Outstanding 81 39 94 53 99 29 58 87 40 110 89 93 Last Value 89 93 16 Overdue Accounts Receivable 511 435 465 586 570 553 622 572 430 642 409 605 Last Value 409 605 17 % of Overdue Receivable 40% 33% 34% 46% 42% 43% 48% 42% 34% 48% 32% 45% Last Value 32% 45% 18 Accounts Receivable Aging 19 <30 Days 510 522 540 510 540 510 516 540 510 540 510 540 Last Value 510 540 20 <60 Days 383 392 405 383 405 383 387 405 383 405 383 405 Last Value 383 405 21 <90 Days 255 261 270 255 270 255 258 270 255 270 255 270 Last Value 255 270 22 >90 Days 128 131 135 128 135 128 129 135 128 135 128 135 Last Value 128 135 23 Toal Accounts Receivable 1,275 1,305 1,350 1,275 1,350 1,275 1,290 1,350 1,275 1,350 1,275 1,350 (Total Accounts Receivable and Total of Receivable Aging must be equal) - - - - - - - - - - - - 24 Accounts Payable 800 900 750 1,000 1,200 1,500 900 800 700 600 700 600 Last Value 700 600 25 Days Payable Outstanding 162 57 56 94 92 39 51 60 127 158 145 102 Last Value 145 102 26 Accounts Payable Aging 27 <30 Days 320 360 300 400 480 600 360 320 280 240 280 240 Last Value 280 240 28 <60 Days 240 270 225 300 360 450 270 240 210 180 210 180 Last Value 210 180 29 <90 Days 160 180 150 200 240 300 180 160 140 120 140 120 Last Value 140 120 30 >90 Days 80 90 75 100 120 150 90 80 70 60 70 60 Last Value 70 60 31 Toal Accounts Payable 800 900 750 1,000 1,200 1,500 900 800 700 600 700 600 (Total Accounts Payable and Total of Payable Aging must be equal) - - - - - - - - - - - -
  • 4. 3. Monthly Dashboard MAY 1. Indicators 2. Enter Data 3. Monthly Dashboard 4. YTD Dashboard Net Investing Cash Flow 4,484 Cash at End of Month 813 Select Month Net Financing Cash Flow 16,377 Profit Before Tax 9,876 Net Operating Cash Flow 4,484 8,500 8,700 9,000 8,500 9,000 8,500 8,600 9,000 8,500 9,000 8,500 3,362 4,298 4,901 10,000 4,250 4,002 4,734 4,023 4,650 4,701 4,016 5,138 4,402 4,099 (1,500) 4,750 4,498 3,866 4,977 3,850 4,299 4,484 (5,000) - 5,000 10,000 15,000 JUL AUG SEP OCT NOV DEC JAN FEB MAR APR MAY Operating Cash Inflow Operating Cash Outflow Net Operting Cash Flow 510 383 255 128 < 30 Days < 60 Days < 90 Days > 90 Days Days Inventory Outstanding 89 Receivable Aging Total Receivable 1,275 Overdue Receivable 409 37 Days Receivable Outstanding Inventory Trend 145 Days Payable Outstanding 280 210 140 70 < 30 Days < 60 Days < 90 Days > 90 Days Payable Aging Total Payable:700 - 4,000 8,000 12,000 J A S O N D J F M A M % of Overdue Receivable 32% Cash Flow 0 180 0 180 0 180 Total Inventory 9,876
  • 5. 4. YTD Dashboard JUN 1. Indicators 2. Enter Data 3. Monthly Dashboard 4. YTD Dashboard 86,487 47,271 93,242 52,644 698 Select YTD Month Cash at End of MonthProfit Before Tax Net Operating Cash Flow Net Financing Cash Flow Net Investing Cash Flow Days Inventory Outstanding Receivable Aging Total Receivable 1,350 Overdue Receivable 605 Days Receivable Outstanding Inventory Trend Days Payable Outstanding Payable Aging 8,500 8,700 9,000 8,500 9,000 8,500 8,600 9,000 8,500 9,000 8,500 9,000 3,362 4,298 4,901 10,000 4,250 4,002 4,734 4,023 4,650 4,701 4,016 4,592 5,138 4,402 4,099 (1,500) 4,750 4,498 3,866 4,977 3,850 4,299 4,484 4,408 (4,000) (2,000) - 2,000 4,000 6,000 8,000 10,000 12,000 JUL AUG SEP OCT NOV DEC JAN FEB MAR APR MAY JUN Operating Cash Inflow Operating Cash Outflow Net Operting Cash Flow 93 540 405 270 135 < 30 Days < 60 Days < 90 Days > 90 Days 64 - 4,000 8,000 12,000 J A S O N D J F M A M J 240 180 120 60 < 30 Days < 60 Days < 90 Days > 90 Days 102 % of Overdue Receivable45% Cash Flow 0 180 0 180 0 180 Total Payable:600 Total Inventory 8,765