SlideShare a Scribd company logo
1 of 68
Download to read offline
VOL 2, No 46 (2019)
Sciences of Europe
(Praha, Czech Republic)
ISSN 3162-2364
The journal is registered and published in Czech Republic.
Articles in all spheres of sciences are published in the journal.
Journal is published in Czech, English, Polish, Russian, Chinese, German and French.
Articles are accepted each month.
Frequency: 12 issues per year.
Format - A4
All articles are reviewed
Free access to the electronic version of journal
All manuscripts are peer reviewed by experts in the respective field. Authors of the manuscripts bear responsibil-
ity for their content, credibility and reliability.
Editorial board doesn’t expect the manuscripts’ authors to always agree with its opinion.
Chief editor: Petr Bohacek
Managing editor: Michal Hudecek
 Jiří Pospíšil (Organic and Medicinal Chemistry) Zentiva
 Jaroslav Fähnrich (Organic Chemistry) Institute of Organic Chemistry and Biochemistry
Academy of Sciences of the Czech Republic
 Smirnova Oksana K., Doctor of Pedagogical Sciences, Professor, Department of History
(Moscow, Russia);
 Rasa Boháček – Ph.D. člen Česká zemědělská univerzita v Praze
 Naumov Jaroslav S., MD, Ph.D., assistant professor of history of medicine and the social
sciences and humanities. (Kiev, Ukraine)
 Viktor Pour – Ph.D. člen Univerzita Pardubice
 Petrenko Svyatoslav, PhD in geography, lecturer in social and economic geography.
(Kharkov, Ukraine)
 Karel Schwaninger – Ph.D. člen Vysoká škola báňská – Technická univerzita Ostrava
 Kozachenko Artem Leonidovich, Doctor of Pedagogical Sciences, Professor, Department
of History (Moscow, Russia);
 Václav Pittner -Ph.D. člen Technická univerzita v Liberci
 Dudnik Oleg Arturovich, Doctor of Physical and Mathematical Sciences, Professor, De-
partment of Physical and Mathematical management methods. (Chernivtsi, Ukraine)
 Konovalov Artem Nikolaevich, Doctor of Psychology, Professor, Chair of General Psy-
chology and Pedagogy. (Minsk, Belarus)
«Sciences of Europe» -
Editorial office: Křižíkova 384/101 Karlín, 186 00 Praha
E-mail: info@european-science.org
Web: www.european-science.org
CONTENT
ECONOMIC SCIENCES
Kuchciński A.
THE ROLE OF GUARANTEE FUNDS IN SUPPORTING
ENTREPRENEURSHIP IN POLAND ................................3
Aksenov V., Panfilova M.
SUPPLY AND DEMAND IN THE DEVELOPMENT OF
INBOUND TOURISM NIZHNY NOVGOROD REGION ....9
Aksenov V.
OPERATIONAL MANAGEMENT: THE PRACTICE OF
SMALL MANUFACTURING ENTERPRISES...................12
Karasova N.
MODELS OF AGRICULTURE EXPORT CAPACITY
DEVELOPMENT..........................................................17
Kozina K.
REGIONAL MARKETS OF FREIGHT MOTOR
TRANSPORT TRANSPORTATIONS AS CONSTITUENT OF
INFRASTRUCTURAL PROVIDING OF COMPLEX
DEVELOPMENT OF REGIONS.....................................22
Palant O., Stamatin V.
TRENDS OF DEVELOPMENT OF EXISTING SYSTEMS
AND PROSPECTS OF APPLICATION OF AUTOMATIC
TRAIN OPERATION SYSTEMS IN SUBWAYS OF THE
WORLD ......................................................................26
Yakhina E., Zaripova A.
IMPROVEMENT OF TAX ACCOUNTING IN SMALL
BUSINESSES ...............................................................33
HISTORICAL SCIENCES
Tkachuk A.
IMPLEMENTATION OF THE ASSOCIATION
AGREEMENT BETWEEN UKRAINE AND THE
EUROPEAN UNION IN THE CONTEXT OF RUSSIAN
AGGRESSION: THE SECURITY ASPECT .......................37
PEDAGOGICAL SCIENCES
Romanovskyi O., Zіnchenko L.
SPIRITUAL AND MORAL EDUCATION OF STUDENTS
SPECIALTY «PHYSICAL EDUCATION AND SPORT» AS A
GUARANTEE OF FORMING A PROFESSIONAL
ESPONSIBILITYFUTURE SPECIALIST ...........................41
Kozhyna H.
ANALYSIS OF THE RESEARCH OF THE ROLE OF SOCIAL
INSTITUTIONS IN THE PREVENTION OF AGGRESSIVE
BEHAVIOR OF TEENAGERS ........................................44
Darniak I.
EVOLUTION OF ACADEMIC CAREER STRUCTURES:
BEST PRACTICES ARE INSTITUTIONAL
TRANSFORMATIONS..................................................50
PHILOLOGICAL SCIENCES
Kulumbetova A., Shvaikovskiy A.
ABOUT PERCEPTION OF THE PAST AND THE PRESENT
IN THE SYSTEM OF THE POEM IN PROSE “KAMEN’” BY
I.S. TURGENEV...........................................................54
PSYCHOLOGICAL SCIENCES
Vavryniv O.
EMPATHY IN THE PERSONALITY STRUCTURE OF
FUTURE RESCUERS AS SPECIALISTS IN EXTREME
ACTIVITIES .................................................................59
Panova V.
INTERRELATION BETWEEN LEADERSHIP QUALITIES
AND LEVEL OF RESPONSIBILITY OF STUDENTS OF
NATIONAL UNIVERSITY CIVIL DEFENSE
OF UKRAINE...............................................................64
Sciences of Europe # 46, (2019) 3
ECONOMIC SCIENCES
THE ROLE OF GUARANTEE FUNDS IN SUPPORTING ENTREPRENEURSHIP IN POLAND
Kuchciński A.
PhD in economics, assistant professor
University of Social Sciences in Lodz
ABSTRACT
The problem of financing enterprises is a serious barrier that hinders the development of SME in Poland.
Attempts to solve the problem are being made by the guarantee funds, i.e. financial institutions that provide credit
guarantees for enterprises.
The aim of the article is to present the important activity of guarantee funds in Poland and to identify their
role. To achieve this goal, the author used the method of literature and source data analysis.
Keywords: guarantee funds, entrepreneurship, SME sector.
Introduction
The issue of financing activities is a "sensitive"
problem faced by companies at different stages of their
development. Enterprises (mainly micro and small) are
more willing to use their own resources when choosing
a source of financing. The abandonment of other forms
of financing is due to fear of their use and lack of cre-
ditworthiness. It is therefore important to create pro-
grammes that help companies to raise finance, as the
obstacles to obtaining credit or loans are not the interest
rate, but the conditions they have to meet [1, p.30].
Lack of credit history, required collaterals or high costs
of application processing constitute barriers to access
to external capital. One of the instruments by means of
which enterprises will increase their ability to obtain
external financial resources are non-banking sources of
financing, such as guarantee funds [2, p.503.].
Guarantee funds are financial institutions that take
over credit risk from banks. They are a source of long-
term financing for enterprises, i.e. they are an instru-
ment that meets capital needs. These funds are part of a
financial combination of innovative support for the de-
velopment of small and medium-sized enterprises.
They provide aid mainly to enterprises of the SME sec-
tor in the form of guarantees. The guarantee itself is a
security for the repayment of a debt (credit or loan) that
a company has contracted with a given financial insti-
tution [3, p.187].
Guarantee funds are are non-profit organisations.
The potential profit cannot be used for dividend pay-
ments, but only increases the guarantee capital, which
increases the security and credibility of the fund. The
guarantee fund is primarily capital. The fund secures
loans with its own financial resources, which it holds,
i.e. guarantee capital (fund). Capital is also a guarantee
for the bank that the guarantees granted are covered and
the fund is sol vent [4, p.116-118].
The purpose of the guarantee funds is to facilitate
access to external financial resources in the form of
guarantees for micro, small and medium-sized enter-
prises. Their activities affect not only the development
of local and regional entrepreneurship, but also have a
positive impact on the economy as a whole, as they in-
crease its competitiveness and innovation. It should be
stressed that these funds do not directly provide finan-
cial resources for businesses, nor do they help to obtain
or improve their creditworthiness. They provide sup-
port only to those entrepreneurs whose only shortcom-
ing is the lack or inadequacy of debt security. Support
is implemented in the following areas, namely reducing
the risk of financing the enterprise and building its
credit history, providing support in the area of loan se-
curity, verifying the financial analyses contained in the
business plan [5, p.223].
Importance of guarantee funds
In response to the steadily deteriorating position of
SME enterprises in relation to large companies in terms
of access to services offered by banks, guarantee funds
were established. Despite the fact that in the time of
growing competition among various financial institu-
tions also on the banking services market confidence in
small and medium enterprises is growing, it seems that
assistance from the guarantee funds is still necessary,
especially in the scope of providing support to the un-
employed who want to run their own business [6,
p.105-106].
Surety funds operate on the basis of general legal
regulations, i.e. the provisions of the Civil Law and the
provisions of the Commercial Companies Act, and are
not subject to any special control. Although the funds
were established at the beginning of the 1990s, no com-
prehensive legislative solutions have been developed to
date. On the one hand, the fund's activities are based on
regulations that regulate normal economic relations,
while on the other hand, they benefit from the provi-
sions of national and regional programmes they imple-
ment, which are financed from public funds and struc-
tural funds. The current legal acts, which regulate,
among others, the rules of granting sureties and guar-
antees by the State Treasury, do not cover the issue of
activity of entities in the form of sureties funds [7,
p.89].
Funds are characterized by a diversified structure
in terms of organizational and legal form, the size of the
capital held, the procedures for granting guarantees or
the territorial scope of their activities. They form a
group of independent entities specialized exclusively in
the field of guarantee activity, but there are also such
funds which are one of the elements of a larger entity's
activity. It is difficult to determine the exact number of
functioning institutions of this type, mainly due to the
4 Sciences of Europe # 46, (2019)
fact that it is a licensed activity and no special registra-
tion procedure is required [1, p.31]. A large number of
guarantee funds have been set up by local authorities,
local organisations and associations. Most often they
operate in the form of a company, associations and
foundations.
Taking into account the value of capital held by
credit guarantee funds, the following funds are distin-
guished [8, p.10]:
 very small - guarantee capital < PLN 2 million,
 small - PLN 2 million ≤ guarantee capital <
PLN 10 million,
 average - PLN 10 million ≤ guarantee capital
< PLN 20 million,
 large - PLN 20 million ≤ guarantee capital <
PLN 50 million,
 very large - PLN 50 million ≤ guarantee capi-
tal.
In order for a company to be able to apply for a
loan guarantee, it must meet certain conditions. Firstly,
it is important to have the status of an entrepreneur and
its activity must be conducted in the territory of the Re-
public of Poland. An application for a loan or credit
should be submitted to such a financial institution, e.g.
a bank or a loan fund, which on the basis of a concluded
agreement cooperates with a given guarantee fund. A
surety may cover a loan or a credit if the financial re-
sources are used for purposes related to commencing or
conducting business activity. If the entrepreneur is
obliged to repay the previously received public aid, the
surety cannot be granted. The value of the granted
surety may not exceed 5% of the guarantee fund's eq-
uity. The maximum value of a surety may be granted
up to 80% of the loan amount, while the value of the
surety may not exceed 80% of the amount of current
liabilities resulting from the credit/loan agreement.
Surety funds grant a surety for a maximum period of
approx. 60 months, and fees and commissions are
charged from the moment the agreement is concluded
until the surety expires. The amount of the commission
depends mainly on the duration of the loan agreement.
Funds enable entrepreneurs to repay their commitments
in installments [9, p.47].
The common element in all the credit guarantee
funds operating in Poland is the bank's primary role,
which means that the initiation of the procedure for
granting or refusing a guarantee in the fund depends on
the bank's positive assessment of the possibility of fi-
nancing the project. The entrepreneur first submits the
required application to a given guarantee fund together
with supporting documentation [10, p.31]. The scope of
such documentation should correspond to the docu-
mentation required by banks, as funds aim at standard-
ising their documentation with that used by banks.
Therefore, in addition to the application, the results of
the analysis of the application of the entrepreneur ap-
plying for a loan and the results of the assessment of the
investment project together with the documents on the
basis of which the results were achieved are attached.
Both the analysis and the assessment were carried out
in accordance with the procedures in force in the bank.
Current registration and statutory documents not older
than 3 months are also required, as well as documents
confirming that the entrepreneur has no arrears with the
Social Insurance Institution and the State Treasury. The
application is also accompanied by a copy of the agree-
ment or decision on granting a loan [11, p.85].
Under a guarantee agreement, the fund undertakes
to reimburse the bank for any loan or part thereof in the
event that the borrower fails to repay the loan to the
bank. As a result, the bank receives credible collateral,
while the borrower may obtain funds in the form of a
loan [12, p.153].
In each of the Funds there are two bodies which
take part in the evaluation of the applications. The first
body (usually the fund director) evaluates the formal
and substantive aspects of the application, while the fi-
nal decision to grant a guarantee is made by the second
body, i.e. the selection committee based on the fund di-
rector's analysis and information about the entrepre-
neur. This committee consists of managing and/or su-
pervising bodies and persons from outside the fund [10,
p. 32].
Guarantee funds as parabank institutions grant
guarantees for loans and credits to enterprises, mainly
for activities related to starting or further development
of the company, financing its activities and invest-
ments, for purposes related to the implementation of in-
novative technological solutions or creation of new
jobs [13, p.330]. In addition to assuming the risk of in-
solvency of the company, these funds also provide
other services such as helping clients with formalities
to obtain credit and organizing various additional train-
ing courses. They also take over the obligation to mon-
itor borrowers in order to strengthen their cooperation
with banks [14, p.330].
Despite the existence of many credit guarantee
funds based essentially on a single mechanism, there
are some differences between them which affect their
differentiation. For example, there is a diversity in
terms of defining the target client of the fund. Sureties
are granted mainly to the SME sector, however, there
are some preferences. Funds established on the basis of
the resources of the Agricultural Property Agency of
the Treasury may be guaranteed to a person residing in
a rural area. The individual character of the funds' ac-
tivity is also reflected in the amount of the surety of-
fered [15, p.21]. Table 1 presents typical features of
guarantee products, which in some respects may differ
from the products offered by individual funds, but these
differences are negligible and do not have a significant
impact on the functioning of the guarantee funds sys-
tem in Poland.
Sciences of Europe # 46, (2019) 5
Table 1.
Standard features of surety products in Poland [16, p.157]
Beneficiaries of the
guarantee
 Micro, small and medium-sized enterprises conducting business activity and not
being in a difficult situation within the meaning of EU regulations, usually operating
on the market for at least 3 months,
Application proce-
dure for surety
 The beneficiary should submit an application for a loan/loan guarantee through a
financing institution (commercial bank or loan fund) together with the documents re-
quired by the financing institution and the guarantee fund. The period for applying for
the surety is at least 7 days from the date of submission of the necessary documents,
the maximum waiting time may be 1 month. As a rule, documents submitted to the
financing institution are sufficient to apply for a guarantee. It is necessary to submit a
short application for a guarantee to the guarantee fund via a financial institution. The
Guarantee Fund shall carry out a risk assessment of the beneficiary independent of the
financing institution.
Surety amount
 It depends on the amount of the fund's guarantee capital - not more than 5% of the
fund's guarantee capital.
 A surety for one entrepreneur or entrepreneurs related by capital may not be higher
than 80% of the loan value.
 As a rule, guarantee funds apply the guarantee principle up to 70% of the loan value,
but on average 60%.
 Taking into account the largest guarantee fund in Poland, POLFUND FPK with the
largest capital at its disposal (excluding KFPK and FPU Funds), the maximum guaran-
tee is PLN 3,150 thousand.
Surety period
 Hand-guaranteed for a standard period of 12 months with a maximum period of 60
months.
Purpose of the guar-
antee
Sureties may be used for any credit and loan purpose related to the conducted business
activity, including e.g. for purposes related to the conducted business activity:
 investment,
 rotatable,
 turnover and investment.
Surety security
 Beneficiary's blank promissory note together with a promissory note declaration -
authorizing the guarantee fund to fill in the promissory note in case of problems with
the execution of the guarantee.
 Very rarely other forms of material security.
Surety fees
 No fees shall be charged for the acceptance and processing of a request for surety,
unless it concerns changes in the terms and conditions of a surety during the term of a
surety agreement.
 Surety fee depends on the period for which the surety was granted.
 Surety fees are divided into an initial fee and an annual or quarterly fee for the
duration of the surety.
 The one-time preliminary fee for a surety varies from 0.5 to 3% of the value of the
surety amount.
 The annual fee is maximum 1.5% of the value of the active guarantee.
Method of payment
of the guarantee to
the sponsoring un-
dertaking
 The payment of the value of the surety due to the institution shall normally take
place within 1 to 6 months of the institution's becoming aware of its creditworthiness.
Recovery of
amounts receivable
 Recovery is usually carried out by a guarantee fund, often in cooperation with a
bank.
Guarantee fund op-
erating area/ availa-
bility of guarantees
Guarantee funds are local, regional or national in scope. The possibility of using the
offer of the guarantee fund depends on the amount of its capital and the scope of its
activity. As a rule, in order to be able to use the funds offered, an entrepreneur must
have a registered office or, in the case of a natural person, a place of residence or main
place of business within the area where the guarantee fund operates, and a contract with
a financing institution is important.
Guarantee funds have become a key element of the
financial market and the system supporting the devel-
opment of the SME sector. The strategic goal of the
guarantee funds is to facilitate access to external
sources of financing for micro, small and medium en-
terprises. The objectives of their functioning are cov-
ered by barriers faced by enterprises in accessing fi-
nancing. In this connection, the functions performed by
the funds include: reducing financial risk and creating
6 Sciences of Europe # 46, (2019)
credit history of enterprises and creating collateral for
bank loans. They also verify business plans drawn up
by companies and enable banks to obtain information
about a given economic entity [16, p.155].
The above functions performed by the guarantee
funds result in their two main objectives of activity, i.e.
overarching and intermediate objectives. Within the
scope of overriding objectives, the funds provide enter-
prises with easy access to external forms of financing
and create an integrated, effective and secure system of
guarantee funds. On the other hand, intermediate objec-
tives include increasing corporate lending and having a
positive impact on the labour market, as they contribute
to the creation of new jobs and the preservation of ex-
isting ones [16, p.137].
Thanks to the support that micro, small and me-
dium enterprises may receive from the guarantee funds,
it is possible for a situation to appear in the poviat or
commune where the dynamics of their economic devel-
opment increases. Therefore, it is very important for lo-
cal authorities to provide support to both new and ex-
isting guarantee funds [17, p.490].
Activity of guarantee funds
Guarantee funds are one of the business support
institutions which have adopted as their main objective
the provision of assistance to various business entities
in the form of material guarantees to those entities
which apply for financing [18, p.273]. The offer of
credit guarantee funds is characterized by complemen-
tarity mainly with services offered by banks and loan
products offered by various financial institutions.
Therefore, the granted guarantees must be provided to-
gether with a package of services of commercial banks,
loan institutions and public entities (e.g. poviat employ-
ment offices). In order for the guarantee funds to be
able to conduct effective activity, it is required to for-
mulate common rules and forms of their functioning
within the scope of services provided to local entrepre-
neurs [19, p.91].
The guarantee market accessible to small and me-
dium-sized enterprises is shaped by the “Bank Gospo-
darstwa Krajowego”, which provides guarantees and is
a co-owner of a large number of guarantee funds, as
well as local, subregion and regional guarantee funds
[20, p.65].
An important role in the functioning and develop-
ment of guarantee funds is played by the National Guar-
antee Group, which integrates local and regional guar-
antee funds with the participation of local government
units and Bank Gospodarstwa Krajowego. Currently
there are 19 local and regional guarantee funds operat-
ing within the Group and its objective is to support
shareholders in the guarantee activity by means of co-
operation with institutions responsible for formulating
legal regulations concerning the guarantee market and
work on standardization of the processes occurring in
the funds. The Group deals with advertising and pub-
lishing activities, provides consulting and training ser-
vices, manages the database and supports the use of IT
tools. The National Guarantee Group together with the
Polish Banks Association has developed common
standards of guarantee activity [20, p.47].
A very important element for the functioning of
guarantee funds are associations, namely the National
Association of Guarantee Funds. The Association was
established in 1996 at the time of liberalization and de-
velopment of financial services and consists of people
who are engaged in activities aimed at the development
of the financial market for the SME sector and various
financial institutions and economic and social organi-
zations supporting the development of these enter-
prises. The aim of the National Association of Guaran-
tee Funds is primarily to support the development of the
system of credit guarantee funds and to cooperate with
those institutions (government, local government, fi-
nancial) that also operate in this field. They also pro-
mote guarantee funds and disseminate knowledge and
exchange experiences in the field of guarantee activity.
The Association cooperates with Bank Gospodarstwa
Krajowego, the Polish Agency for Enterprise Develop-
ment and various agencies involved in building a sys-
tem of financial instruments, especially guarantees
[21].
Guarantee funds in Poland cooperate with various
business entities, mainly with commercial banks, but
also with a group of loan funds and financial institu-
tions. The activity of these funds is reflected in the
amounts of loans and credits disbursed thanks to the
following guarantees [19, p.92].
The activity of guarantee funds depends on many
factors, including the amount of capital held. The gov-
ernmental program "Capital for entrepreneurs" imple-
mented in 2002-2006, which at the end of 2007 allowed
51 credit guarantee funds to have about PLN 589 mil-
lion of funds from subsidies under the Sectoral Opera-
tional Program Improvement of the Competitiveness of
Enterprises and contributed shares and stocks of Bank
Gospodarstwa Krajowego, was of significant im-
portance for the development and size of the capital
held by the guarantee funds. In 2009, the document
"Directions of development of loan and guarantee
funds for small and medium enterprises in the years
2009-2013" was adopted, where in this financial per-
spective these funds received support for development
within the framework of organizational and economic
activities. The funds could apply for capitalisation of
their activities from the Regional Operational Pro-
grammes and from the Framework Programme for
Competitiveness and Innovation [22, p.3-4].
As at 31.12.2016, the funds had capital of approx-
imately PLN 1.1 billion, which in comparison to the
previous year meant a decrease by approximately PLN
29 million. This situation is mainly related to the fact
that some of the guarantees granted were recognised as
repaid and that 44 guarantee funds operated in 2015
[23, p.6-7].
The activity of the funds, on the other hand, is
measured by the number of guarantees granted. Ac-
cording to the report of the National Association of
Guarantee Funds, at the end of 2016, 7453 guarantees
were granted, where an annual increase in the number
of granted guarantees is observed over a period of 5
years. As shown in Figure 4, the value of sureties
granted has also increased. Compared to the previous
year, this value increased by PLN 25 million and as at
Sciences of Europe # 46, (2019) 7
31.12.2016 amounted to PLN 949 million. The high
value of guarantees is close to the situation where in the
years 2011-2012 the value was around PLN 1 billion.
The observed growth of these entities is a consequence
of the adaptation of the guarantee funds to the function-
ing of the competitive offer of de minimis guarantees
and granting guarantees as tender deposits [23, p.8].
As can be seen from Graph 1, the most frequent
guarantees are granted to enterprises employing up to 9
persons, where they constitute 60% of all guarantees
granted at the end of 2016. In the three presented enti-
ties in the years 2014-2016, an increase in the number
of such sureties can be observed.
Graph 1. Number and value of sureties granted by the funds in 2012-2016
Graph 2. The guarantees provided by the funds over the period 2014-2016 by size of enterprise
Summary
Micro, small and medium enterprises play a key
role in the shaping of the country's economy, as evi-
denced by the fact that they constitute 99% of all enter-
prises. The SME sector contributes not only to the cre-
ation of new jobs but also has a significant share in the
creation of the gross domestic product, therefore sup-
porting the development of enterprises by various na-
tional, regional and local institutions is so important.
The main problem of enterprises, which limits the
possibility of continuous development, expansion of
their activity, undertaking new investments, is the fi-
nancial factor, namely the issue of obtaining funds for
the implementation of planned activities. In many
cases, the financing of new projects with only own cap-
ital is insufficient, and entrepreneurs then resort to ex-
ternal forms of raising capital. Unfortunately, due to the
specific nature of business activity of enterprises, their
availability and possibility of using financial resources
from external sources is limited.
Therefore, financial institutions such as guarantee
funds try to fill in a specific financial gap. Their pur-
pose and character of the measure allows for granting
support to enterprises which have no chance to take ad-
vantage of e.g. bank credit or other forms due to the
5 678
6 175
5 578
6 336
7 453
1 190
877 833 924 949
0
1 000
2 000
3 000
4 000
5 000
6 000
7 000
8 000
2012 2013 2014 2015 2016
Number of guarantees Value (mln PLN)
3 827 3 909
4 495
1 497
1 871
2 583
253 349 352200 207
23
0
1 000
2 000
3 000
4 000
5 000
2014 2015 2016
micro small medium other
8 Sciences of Europe # 46, (2019)
strict requirements imposed on them. When granting fi-
nancial support to enterprises in the form of guarantees,
these funds are guided not only by the development of
the SME sector, but also by the development of the re-
gion in which they operate.
The analysis of the functioning of the funds
showed how important their role in the system of sup-
porting entrepreneurship in Poland is. Therefore, it is
important to undertake such actions that will be focused
on the development of these institutions, which may
translate into regional and national development.
References
1. Bieńkowska B., Fundusze poręczeniowe jako
wsparcie dla finansowania działalności MSP (Bielski
Fundusz Poręczeń Kredytowych) „Zeszyty Naukowe
Uniwersytetu Szczecińskiego. Ekonomiczne Problemy
Usług.”, nr 34, 2009.
2. Sieradzka K., Działalność funduszy poręczeń
kredytowych na rzecz rozwoju przedsiębiorczości w
Polsce, „Zeszyty Naukowe Uniwersytetu
Szczecińskiego. Finanse, Rynki Finansowe,
Ubezpieczenia.”, nr 37, 2011.
3. Kuchciński A., Fundusze poręczeniowe w
Polsce, [in:] Finansowanie działalności
przedsiębiorstw a społeczna odpowiedzialność
biznesu, ed. A. Krzysztofek, Kraków 2014.
4. Dylikowski K., Praktyczne aspekty
funkcjonowania funduszy poręczeniowych w Polsce na
przykładzie Poznańskiego Funduszu Poręczeń
Kredytowych, [in:] Fundusze poręczeniowe i
pożyczkowe w finansowym wspieraniu sektora mikro-
, małych i średnich przedsiębiorstw w Polsce, ed. A.
Janc, K. Waliszewski, Warszawa 2014.
5. Frydrych Ł., Sektor MSP oraz warunki jego
funkcjonowania w Polsce, [in:] Promocja małej i
średniej przedsiębiorczości w Unii Europejskiej:
szanse, wizerunki, korzyści, ed. A. Hess, Kraków 2007.
6. Waniak – Michalak H., Pozabankowe źródła
finansowania małych i średnich przedsiębiorstw,
Kraków 2007.
7. Walczyna Ł., Uwarunkowania formalnoprawne
dotyczące korzystania z funduszy poręczeniowych i
pożyczkowych w Polsce, [in:] Fundusze poręczeniowe
i pożyczkowe w finansowym wspieraniu sektora
mikro-, małych i średnich przedsiębiorstw w Polsce,
ed. A. Janc, K. Waliszewski, Warszawa 2014.
8. Raport o stanie funduszy poręczeniowych w
Polsce – na dzień 31.12.2016 r., Krajowe
Stowarzyszenie Funduszy Poręczeniowych, Warszawa
2017.
9. Hryniewiecka M., Fundusze pożyczkowe i
poręczeniowe dla przedsiębiorstw, „Myśl
Ekonomiczna i Polityczna”, nr 2, 2014.
10. Gajewski M., Kiliański T, Szczucki J., Zasady
organizacji i funkcjonowania funduszy poręczeń
kredytowych, Polska Agencja Rozwoju
Przedsiębiorczości, Warszawa 2000.
11. Kuchciński A., Analiza działalności funduszy
poręczeniowych w województwach świętokrzyskim i
podkarpackim w latach 2010-2016, [in:] Stan i
perspektywy rozwoju przedsiębiorczości – wymiar
krajowy, regionalny, lokalny ze szczególnym
uwzględnieniem powiatu tarnobrzeskiego, ed. G. Wilk-
Jakubowski, A. Buś-Bidas, Wydawnictwo Społecznej
Akademii Nauk, Łódź-Warszawa 2018.
12. Brzegowa E., Czajkowska J., Projektowanie
organizacji nowego przedsiębiorstwa, [in:]
Współczesne trendy w zarządzaniu projektami, ed. M.
Sołtysik, M. Wesołowska, Kraków 2016.
13. Makarska-Cynk M., Fundusze poręczeń w
Polsce – Podkarpacki Fundusz Poręczeń Kredytowych
spółka z o.o. „Zeszyty Naukowe Uniwersytetu
Szczecińskiego. Finanse, Rnki Finansowe,
Ubezpieczenia.”, nr 50, 2012.
14. Waniak – Michalak H., Gwarancje i
poręczenia kredytowe jako instrumenty wsparcia
małych i średnich przedsiębiorstw – znaczenie i
prezentacja w sprawozdaniach finansowych gwaranta i
beneficjenta, [in:] System rachunkowości w okresie
kryzysu gospodarczego, ed. I. Sobańska, P. Kabalski,
Łódź 2010.
15. Hausner J., Frączek M., Sułkowski R. (ed.),
Fundusze Rozwoju Regionalnego i Lokalnego,
Warszawa 2001.
16. Bartkowiak B., Fundusze pożyczkowe i
poręczeniowe w finansowaniu małych i średnich
przedsiębiorstw w Polsce, Warszawa 2009.
17. Pluskota P., Fundusze poręczeń kredytowych
w Polsce [in:] Instytucje rynku finansowego w Polsce,
ed. A. Szelągowska, Warszawa 2014.
18. Szopik – Depczyńska K., Depczyński R.,
Instytucje wsparcia innowacji, „Studia i Prace
Wydziału Nauk Ekonomicznych i Zarządzania”, nr 34,
2013.
19. Alińska A., Rola lokalnych i regionalnych
funduszy poręczeniowych w kreowaniu rozwoju
społeczno – ekonomicznego regionów, „Zagadnienia
Ekonomiki Rolnej”, nr 1, 2007,
20. Janc A, Waliszewski K., (ed.), Fundusze
poręczeniowe i pożyczkowe w finansowym wspieraniu
sektora mikro-, małych i średnich przedsiębiorstw w
Polsce, Warszawa 2014.
21. Krajowe Stowarzyszenie Funduszy
Poręczeniowych, https://ksfp.org.pl/o-ksfp/
22. Kierunki rozwoju funduszy pożyczkowych i
poręczeniowych dla małych średnich przedsiębiorstw
w latach 2009-2013, Ministerstwo Gospodarki,
Warszawa 2009.
23. Rynek Funduszy Pożyczkowych w Polsce.
Raport 2016, Polski Związek Funduszy
Pożyczkowych, Warszawa 2017.
Sciences of Europe # 46, (2019) 9
СПРОС И ПРЕДЛОЖЕНИЕ В РАЗВИТИИ ВЪЕЗДНОГО ТУРИЗМА НИЖЕГОРОДСКОГО
РЕГИОНА
Аксенов В.А.
к.и.н., доцент
Панфилова М.
магистрант
Нижегородский госуниверситет им. Н.И. Лобачевского, Нижний Новгород
SUPPLY AND DEMAND IN THE DEVELOPMENT OF INBOUND TOURISM NIZHNY NOVGOROD
REGION
Aksenov V.
Ph. D., associate Professor
Panfilova M.
undergraduate
Lobachevsky state University of Nizhny Novgorod, Nizhny Novgorod
АННОТАЦИЯ
Авторы рассматривают вопрос о факторах рынка вьездного туризма в российских регионах, анализи-
руют спрос и предложение в сфере индустрии гостеприимства Нижегородской области. Предлагают свое
видение региональных пролем и решений.
ABSTRACT
The authors consider the factors of the market of inbound tourism in the Russian regions, analyze the supply
and demand in the hospitality industry of the Nizhny Novgorod region. They offer their own vision of regional
problems and solutions
Ключевые слова: въездной туризм, коллективные средства размещения, структура спроса на турист-
ские услуги.
Keywords: inbound tourism, collective accommodation facilities, structure of demand for tourist services
В мае 2018 г. Распоряжением Правительства
РФ утверждена новая концепция Федеральной це-
левой программы «Развитие туризма внутреннего и
въездного туризма в РФ (2019-2025 годы)» с про-
гнозным объемом финансирования за счет средств
федерального бюджета в размере около 70 млрд.
рублей. При этом на каждый рубль бюджетных
средств необходимо привлечь не менее 2,2 рубля
внебюджетных инвестиций. Как указано в концеп-
ции, конечным результатом программы будет яв-
ляться рост совокупного туристского потока по
России до уровня 93 млн. человек (рост в 28%), что
позволит достичь запланированного увеличения
вклада туризма в валовой внутренний продукт РФ
более чем на 70% к концу 2025 года.
Сделать это можно только сделав ставку на
развитие внутреннего и вьездного туризма в регио-
нах России.
Современный рынок туристических услуг в
Нижегородской области показывает заметный рост
въезда иностранных гостей за 2017-2019 годы.
Итоги Национального рейтинга въездного туризма
за 2018 и 1-е полугодие 2019 года показали эту тен-
денцию (см. Таблица 1).
Таблица 1.
Данные по въездному туризму TOP-20 регионов России по итогам Рейтинга за 2017, 2018 и 1-ое полуго-
дие 2019 года1
Место
за 2019
год
Наименование субъекта РФ
Общее
кол-во
баллов
Всего туристов,
чел. 2018г.
туристов на 1000
жителей 2018г.
прирост иностран-
ных туристов
2018г.
1
Город федерального
значения Москва
25,5 4 971 435 432 1 180 757
2 Город Санкт-Петербург 25,2 1 865 132 382 197 409
3 Приморский край 24,8 393 865 201 137 886
4 Московская область 24 395 584 56 102 538
5 Краснодарский край 23,5 249 320 48 77 949
6 Калининградская область 23,4 109 582 115 40 988
7 Нижегородская область 23,3 144 202 44 104 012
Нижегородская область зафиксировала рост
иностранных гостей в 2018 г. в 3,5 раза больше, чем
в 2017 (4 место в рейтинге регионов). Входя в
первую, «золотую», группу рейтинга с условным
1 составлено авторами на основании данных Росстата, журнал «Отдых в России» и ряда других источников
названием «5 звезд» (20 регионов), Нижегородская
область с девятого места в 2018 году поднялась на
седьмое, обогнав Татарстан и Свердловскую об-
10 Sciences of Europe # 46, (2019)
ласть, столицы которых крупнейшие деловые цен-
тры Казань и Екатеринбург также проводили матчи
Чемпионата по футболу.
Мы исходим из гипотезы о сохранении этой
тенденции, что отчасти подтверждается данными
по первой половине 2019 года. При этом, надо
учесть, что на вторую половину года приходится
пик туристического сезона. В рамках этой тенден-
ции постепенно выстраиваются стратегия, планы,
инвестиционные программы региона.
Вторым долговременным фактором, влияю-
щим на программы и планы региона является бли-
зость его к столице Российской Федерации Москве
и ее туристским потокам. Доля Москвы в общем ко-
личестве иностранных граждан, размещенных в
коллективных средствах размещения (без учета
микропредприятий), среди посетивших Россию в
2017 г.туристов, составила более 47%. Эта доля ста-
бильно высока была в течение всех последних лет.
За предшествующие годы она колебалась в преде-
лах от 39% до 42%, а в 2017 г. существенно выросла
(с 41% до 47%). Возьмем статистические данные о
численности иностранных граждан, размещенных в
КСР (коллективных средствах размещения) по го-
дам (см. Таблицу 2).
Таблица 2.
Численность иностранных граждан, размещенных в КСР (без учета микропредприятий)[4]
2009 2010 2011 2012 2013 2014 2015 2016 2017
Российская Федерация 3055,4 3413,4 3865,9 4213,6 4443,6 4607,9 5033,5 6092,2 8028,8
Московская область 135,4 103,1 102,1 173,2 169,6 139,5 164,7 227,9 293,0
г. Москва 1194,8 1402,3 1622,0 1734,4 1822,8 1827,0 2074,5 2516,6 3790,7
Таблица составлена по данным сайта: https://www.russiatourism.ru/contents/statistika/
Рост доли Москвы произошел за счет абсолют-
ного притока иностранных граждан в город. При-
чем, надо отметить, что с учетом других средств
размещения Москву в 2017 году посетило более 4,8
миллиона иностранных туристов [1].
Нижний Новгород располагает с учетом логи-
стики неплохим доступом к турпотокам Москвы.
Собственный международный аэропорт (резерв-
ный для столицы), 3,5-часовой железнодорожный
маршрут и водный маршрут по великой русской
реке Волге на круизных теплоходах позволяет вос-
пользоваться сложившимся положением. Поэтому
достигнутые результаты въездного потока в Ниже-
городский регион, зафиксированные в 2018-2019
годах, нельзя назвать потолком роста.
Ожидаемый рост спроса на рынке иностран-
ного въездного туризма в Нижегородской области
требует изменений в сфере предложения услуг в ре-
гионе. Рассмотрим динамику предложения.
Одним из важнейших факторов рынка предло-
жения в индустрии гостеприимства является состо-
яние гостиничного комплекса (коллективные сред-
ства размещения, микропредприятия и т.п.).
Нижегородская область вошла в десятку веду-
щих субъектов РФ по развитию гостиничного ком-
плекса, сообщили РБК-НН в региональной службе
статистики [11]. По данным Нижегородстата, к
концу 2018 года в регионе насчитывалось 517 кол-
лективных средств размещения, 355 из которых
имели общее назначение (в том числе гостиницы,
меблированные комнаты и общежития для приез-
жих), еще 162 — специальное (к таковым относятся
санатории, санатории-профилактории, кемпинги,
дома и базы отдыха).
По количеству средств коллективного разме-
щения Нижегородская область занимает 10 место в
РФ. При этом показатель обеспеченности региона
гостиничной инфраструктурой в расчете на 1 тыс.
жителей по результатам 2018 года составил 368
мест, что является вторым результатом в Приволж-
ском федеральном округе после Республики Татар-
стан.
Гостиничный комплекс региона состоит из 245
гостиниц, почти половина из которых сосредото-
чена в Нижнем Новгороде, 22 мотелей и 40 хосте-
лов. Большая часть объектов относится к малому
бизнесу: треть средств коллективного размещения
(33,9%) основаны как микропредприятия, еще 38%
зарегистрированы в форме ИП. Категория от двух
до пяти звезд присвоена 101 гостинице, где в общей
сложности создано 4,8 тыс. номеров. Из них две
гостиницы (Sheraton Nizhny Novgorod Kremlin и
парк-отель «Кулибин») являются пятизвездоч-
ными, 16 имеют категорию «четыре звезды», 55 —
«три звезды» и 28 гостиниц — «две звезды».
Основным драйвером развития комплекса сыг-
рало проведение в Нижнем Новгороде этапа чемпи-
оната мира по футболу в 2018 году. За минувшие
пять лет в гостиничную индустрию региона было
вложено более 3,3 млрд руб. (первый пик инвести-
ций пришелся на 2015 год - 1,047 млрд. рублей, а
второй на 2018 - 924,8 млн.). При этом, благодаря
чемпионату мира доля иностранных туристов уве-
личилась с 19,2% в 2017 году до 42,2% в 2018. Но
стоит отметить и то, что, если по итогам года услу-
гами нижегородского гостиничного комплекса вос-
пользовались более 1,18 млн. человек, в том числе
почти 96,7 тыс. иностранцев (8,1%), то большин-
ство гостей региона (47,8% россиян и 45,7% ино-
странцев) как и ранее приезжали в Нижегородскую
область в рамках профессиональных и деловых по-
ездок.
Насколько структура предложения соответ-
ствует характеру предложения судить сложно.
Научные аналитические исследования данного во-
проса, по всей вероятности, имеются только в рас-
поряжении крупных консалтинговых фирм или
маркетинговых служб гостиничных сетей. Можно
отметить только некоторые экспертные оценки.
Анализ гостиничного рынка по типам номер-
ного фонда показывает несоответствие уровня,
обеспечиваемого предпринимателями, предпочте-
ниям потребителей. В существующей классифика-
Sciences of Europe # 46, (2019) 11
ции номерного фонда обычным туристам разо-
браться достаточно трудно, поэтому к ней чаще
прибегают организаторы массовых поездок, коман-
дированные работники. В Нижегородской области
гостиничные предприятия самостоятельно выби-
рают единую стратегию «компоновки» тарифов.
Это различные виды номерного фонда в одной
точке продаж, наличие дополнительных услуг,
оплачиваемых отдельно. Ярким примером такого
обслуживания является питание или предоставле-
ния лечения (в санаториях). Таким образом потре-
бителю оставляют право выбрать набор сервиса,
который ему доступен по потребностям и бюджету.
С внедрением программы целевого развития к
2018 году средняя загрузка номерного фонда вы-
росла с 49 до 54%. это позволяет обеспечивать оку-
паемость бизнеса (см. Таблица 3).
Таблица 3
Плановая окупаемость гостиниц на 2019 год
Тем не менее, гостиничный бизнес в России
согласно статистике, сильно отстает от мирового
уровня. И дело здесь не столько в сервисе, сколько
умелом управлении.
С точки зрения инвестиционной привлекатель-
ности горизонты окупаемости бизнеса находятся в
диапазоне от 5 до 15 лет. Несмотря на явную рента-
бельность не хватающего фонда среднего класса
девелоперы продолжают делать упор именно на об-
новление гостиниц до высшего класса или по-
стройку новых зданий, ориентируясь на тх более
быструю окупаемость. При этом, в Нижнем Новго-
роде часть недостроенных объектов размещения, в
прошлом году пришлось перепродавать.
Нижний Новгород входит в десятку самых по-
сещаемых иностранными туристами городов евро-
пейской России. Он уступает только Москве,
Санкт-Петербургу и городам «Золотого кольца»
(Владимир-Суздаль-Ярославль). К сожалению, в
«TOP объектов для показа» нижегородские досто-
примечательности не входят. Единственное дости-
жение — в TOP-5 лучших экологических маршру-
тов входят круизы по Волге. Это существенный не-
достаток исправлять надо на уровне региональной
власти. Отчасти в этом направлении действует
крупнейщий на данный момент региональный про-
ект формирования Саровско-Дивеевского кластера,
на развитие которого до 2021 года планируется
направить 14,3 млрд. рублей.
Аналитическими агентствами часто указыва-
ется на такой недостаток как отсутствие взаимодей-
ствия с очевидно смежными отраслями. Пожалуй
самой острой проблемой управления в индустрии
гостеприимства является сезонность спроса. Пре-
одоление ее возможно в рамках так называемого
«событийного туризма». Создание ивент-компа-
ний, которые специализируются на привлечении в
регион международных конференций, празников,
соревнований и проведении их — практика зару-
бежного бизнеса. Сегодня создана российская Ас-
социация подобных компаний. Включение в ее ра-
боту с ощутимыми результатами возможно лишь
при заинтересованном отношении региональных
властей.
Недостаток потенциала кроется и в низком
уровне готовности к лавированию сервисом. К при-
меру группа корпоративных туристов перед от-
правлением запрашивает в месте будущего пребы-
вания определенное количество номеров опреде-
ленного уровня. При отсутствии предложения в
полном объеме компания, обрабатывающая заявку,
сможет обеспечить либо часть потребности, либо
рискует совсем потерять клиента. В этом отноше-
нии «звездность» гостиниц согласно сложившейся
классификации имеет двойственную эффектив-
ность. Туристы из одной группы, поселенные в раз-
ные гостиницы одной «звездности» могут столк-
нуться с заметным различием сервиса. Проблемой
является и привлечение транспортных компаний
для организации трансфертов, взаимодействие с
12 Sciences of Europe # 46, (2019)
местными властями и работниками органов внут-
ренних дел. Лучше дело обстоит во взаимодействии
с органами культуры. Собственные лингвистиче-
ский, педагогический и классический универси-
теты позволяют иметь в Нижнем Новгороде квали-
фицированных переводчиков, гидов, экскурсово-
дов с налаженными связями с органами культуры.
Хуже дело обстоит с кадрами других институтов
индустрии гостеприимства. Повышения квалифи-
кации имеющихся и переход к планомерной подго-
товке будущих специалистов находится в стадии
становления. Плюс Нижнего Новгорода в том, что
за последнее время появились целый ряд отелей,
представляющих международные гостиничные
сети [6, С.468-473] или находящиеся под управле-
нием крупных сетевых компаний. Они привносят
не только новые технологии, но и могут быть базой
для подготовки молодых специалистов.
Все вышесказанное еще раз доказывает, что
индустрия гостеприимства работает идеально в со-
стоянии симбиоза всех элементов комплекса.
Литература
1. Сайт Investmoscow.ru - Инвестиционный
портал города Москвы //
https://investmoscow.ru/investment/priority-
sectors/tourism/
2. Сайт Турпром //
www.tourprom.ru/news/39242/
3. Сайт ТурСтат//
http://turstat.com/inboundtravelrussia9month2018
4. Сайт Федерального Агентства по туризму.
МЭР РФ//
https://www.russiatourism.ru/contents/statistika/
5. Сайт «Мир без границ»// http://www.visit-
russia.ru/rossiysko-kitayskiy-turizm/statistika
6. Ефремова М.В., Богатырева Л.Г. Анализ
финансово-экономических показателей в
гостиничном менеджменте// Инновационная
экономика: глобальные и региональные тренды.
Материалы XI Межународной научно-
практической конференции (Нижний Новгород. 31
мая-1 июня 2019 г.) - Нижний новгород. ННГУ им.
Н.И.Лобачевского, 2019. - С.468-473.
7. Вестник АТОР / Иностранный турпоток в
Россию вырос на 25%. 12.08.2019 
https://www.atorus.ru/news/press-
centre/new/48103.html
8. ТАСС / 12 АВГ, 12:05. 13:38 / Въездной
турпоток в Россию в первом полугодии 2019 года
вырос на 25% // https://tass.ru/obschestvo/6754844
9. Сайт ОТДЫХ В РОССИИ / ТОП-30 стран
по числу въездных туристских поездок их граждан
в Россию за 1-ое полугодие 2019 года. 15.11.2019 /
http://rustur.ru/top-30-stran-po-chislu-vezdnyx-
turistskix-poezdok-ix-grazhdan-v-rossiyu-za-1-oe-
polugodie-2019-goda
10. Сайт NEWSNN.RU / В Нижегородской
области номерной гостиничный фонд за пять лет
вырос вдвое. 10 сентября 2018, 14:03 Екатерина
Чичурина. https://newsnn.ru/news/society/10-09-
2018/v-nizhegorodskoy-oblasti-nomernoy-
gostinichnyy-fond-za-pyat-let-vyros-vdvoe
11. РБК. НН // Нижегородская область вошла в
топ-10 регионов по развитию гостиниц/
Н.Новгород, 17 июля, 15:04
https://nn.rbc.ru/nn/freenews/5d2efe5e9a79477765169
c74?from=regional_newsfeed
12. Сайт АльтераИнвест // Анализ рынка
гостиниц 2018. Варламов Ринат. Эксперт по
маркетингу. 19.07.2018
https://alterainvest.ru/rus/blogi/analiz-rynka-gostinits-
2018/
ОПЕРАЦИОННЫЙ МЕНЕДЖМЕНТ: ПРАКТИКА МАЛЫХ ПРОИЗВОДСТВЕННЫХ
ПРЕДПРИЯТИЙ
Аксенов В.А.
к.и.н., доцент
Нижегородский государственный университет им. Н.И. Лобачевского
Нижний Новгород
OPERATIONAL MANAGEMENT: THE PRACTICE OF SMALL MANUFACTURING
ENTERPRISES
Aksenov V.
associate Professor
Nizhny Novgorod state University. N. Lobachevsky
АННОТАЦИЯ
В последнее время в научно-практической литературе появляется все больше концепций и подходов,
связываемых с операционным менеджментом. На взгляд автора, это отражает какую-то тенденцию в раз-
витии практики управления. Он пытается представить свой взгляд на это явление.
ABSTRACT
Recently, more and more concepts and approaches related to operational management have appeared in the
scientific and practical literature. In the author's opinion, this reflects some trend in the development of manage-
ment practice. He tries to present his view on this phenomenon.
Ключевые слова: операционный менеджмент, стратегия операционного менеджмента, бережливое
производство, бизнес-процесс.
Sciences of Europe # 46, (2019) 13
Keywords: operational management, lean production (lean manufacturing, lean production), business-pro-
cess.
В последнее время в научно-практической ли-
тературе появляется все больше концепций и под-
ходов, связываемых с операционным менеджмен-
том. Это и «Бережливое производство» (Lean man-
ufacturing, Lean production), и системы Канбан,
Кайдзен, и TPM (Total Productive Maintenance), и
JIT (Just-In-Time) [13]. На наш взгляд, это отражает
какую-то тенденцию в развитии практики управле-
ния. Попытаемся представить наш взгляд на это яв-
ление.
Понятие операционного менеджмента появи-
лось в период становления классических концеп-
ций и связано было с именами Тейлора, Файоля
[1,C.168-171]. Первоначально оно подразумевало,
прежде всего, управление производством, техноло-
гическими операциями. Организационно-техноло-
гический уровень считался низшим уровнем «пира-
миды» управления организацией (см.: Рис. 1).
Рисунок 1 – Иерархия уровней управления организацией
При этом, в качестве основного инструмента
операционного менеджмента рассматривалось
управленческое решение. Менеджер низшего
уровня, в соответствие с заданиями, которые полу-
чал «сверху», обязан был координировать техноло-
гический процесс, не допуская отклонений от за-
данных параметров, решая возникавшие проблемы.
В самом общем виде «управление по отклоне-
ниям», можно представить следующим образом
(см. Рис. 2).
Рисунок 2 – Процесс управления на основе принятия управленческих решений
Естественно, методами операционного менеджмента считались, прежде всего, следующие методы
(см.: Рис. 3).
14 Sciences of Europe # 46, (2019)
Рисунок 3 – Методы операционного менеджмента
В современных условиях понятие операцион-
ного менеджмента расширяется. Уход от иерархи-
ческих структур к гибким, матричным, проектным,
сетевым приводит к постановке в центр внимания
не объектов, участков, цехов, а бизнес-процессов.
Сквозные сети, связывающие все объекты процес-
сом удовлетворения клиентов, потребителей, при-
водят к расширению сферы внимания менеджера
низшего уровня. Кроме координации технологиче-
ских операций его начинают все более беспокоить
по вопросам экономическим (себестоимость, каль-
куляция затрат времени и ресурсов, т.п.). Операци-
онный менеджмент вторгается в более высокую
сферу (уровень) тактики и даже стратегии. Появля-
ется даже подход к формулировке стратегии опера-
тивного менеджмента. Причиной данной тенден-
ции, на наш взгляд, является не только ускорение
НТП, развитие инновационных процессов, но и
рост образованности специалистов, квалификации,
их психологической готовности к такой работе. То
есть, не только объективно нужен такой подход, но
и субъективно он возможен.
Рассмотрим достаточно интересный, на наш
взгляд, пример из практики малого производствен-
ного предприятия.
ООО «Аргон – РС», расположенное в Нижего-
родской области поставляет свою продукцию на
ряд крупных машиностроительных предприятий
разных регионов России. Заказы идут в рамках дол-
госрочных Договоров постоянно два или три раза в
квартал. Оплата производится по факту приемки
товара. Кроме достаточно крупных заказов есть и
мелкие, средние заказы. Структура предприятия
включает коммерческий отдел, который занимается
приемом заказов, определением цены и контролем,
сопровождением выполнения заказов, отдел произ-
водства с несколькими участками (резки, гибки,
сварки) и склад сырья, материалов, комплектую-
щих и готовых изделий (см. Рис. 4).
Рисунок 4 — Структура предприятия «Аргон»
Sciences of Europe # 46, (2019) 15
Бизнес-процессы носят в «Аргоне» достаточно
стабильный, стандартный характер по крупным за-
казам. Цена, себестоимость заказчикам в целом по-
нятна и не вызывает замечаний.
Однако, на первом этапе сотрудничества с
крупными партнерами у «Аргона» периодически
возникали не очень понятные проблемы. Дело в
том, что доставка заказанного товара, продукции
осуществлялась либо сторонними транспортными
фирмами, либо самими заказчиками, получате-
лями, потребителями. Сложность состояла в том,
что заказчик, получатель и потребитель продукции
не во всех случаях являлись одним и тем же юриди-
ческим лицом. Так, для группы «ГАЗ» закупала ма-
териалы и комплектующие специальная фирма,
входящая в группу, «ТЗК». Доставка осуществля-
лась на ответственное хранение на консигнацион-
ный склад и отпускалась в производство подразде-
ления дивизиона «Автобусы» по мере необходимо-
сти по Заявкам. В момент списания осуществлялась
приемка товара ООО «Аргон» по качеству и коли-
честву. Периодически возникал вопрос либо о
недостаче, либо о несоответствии по качеству. Ди-
ректор, ООО «Аргон» должен был выезжать, полу-
чая претензионные письма. Как правило, доказать
ничего не удавалось и приходилось либо дополни-
тельно поставлять товар, либо делать возврат де-
нежных средств. Директор, как правило, просил
комплектовщиков увеличивать количество единиц
продукции в упаковке («на всякий случай») и за
счет наценки формировал фонд наличных денеж-
ных средств для разрешения конфликта в случае
выезда к потребителю.
В процессе внедрения информационных тех-
нологий было решено внести изменения в процесс
отгрузки товара со склада ООО «Аргон». Специ-
ально была оборудована видеоаппаратурой специ-
альная зона, где осуществляли упаковку и ком-
плектацию продукции. Видеозапись с шести точек
позволяла на видео-файл записать все действия со-
трудников, занимавшихся комплектацией, упаков-
кой и отгрузкой продукции. Видео-запись фиксиро-
вала детально постоянное участие представителя
заказчика в процессе отгрузки и его ответ на вопрос
о наличии претензий и замечаний к сотрудникам
«Аргона». Видеозапись в режиме реального вре-
мени фиксируется в облаке ООО «Аргон». Флеш-
карта передается в завершение представителю за-
казчика, который подписывает Акт приема ее2
.
В результате реорганизации часть ответствен-
ности перекладывается на предприятие-заказчика
товара, оно вовлекается в процесс учета и контроля
товара, поставляемого ООО «Аргон», повышается
2 - Акт приемки товара подписывался представителями
потребителя и заказчика без участия транспортировщика
и производителя (ООО «Аргон»)
3 - затраты на оборудование зоны отгрузки
видеооборудованием (а также освещение, флэш-карты и
аренда Облака, т.п.) сопровождались некоторым
снижением резервных единиц продукции в упаковках,
уменьшением командировок руководителя (кроме
производств Группы «ГАЗ» в других городах, можно
заинтересованность в деле выяснения причин от-
клонения исполненного заказа от условий Дого-
вора.
Таким образом, в результате принятых и реа-
лизованных решений были снижены текущие рас-
ходы ООО «Аргон»3
, удалось поднять престиж
фирмы в глазах и заказчика, и потребителя, снизить
риск роста претензий и «выживания» с рынка по-
ставщиков крупной компании (Группы «ГАЗ»)4
.
При этом, заказчику были снижены цены на выпол-
нение работ после получения от руководства
Письма-Благодарности за вклад в оптимизацию
бизнес-процессов компаний Группы.
Надо сказать, что поиск новых путей в разви-
тии операционного, да и всего менеджмента, на
наш взгляд, быстрее всего идет в предприятиях ма-
лого бизнеса. Несмотря на малую долю, эти пред-
приятия накапливают критическую массу компе-
тенций, квалификации и инновационного потенци-
ала, который может вызвать в определенный
период качественный прорыв в развитии эконо-
мики (и в ее структуре, и в темпах роста). Пока же
положение в целом не такое как хотелось бы руко-
водству страны.
В РФ инновационная активность малых
предприятий низка. В промышленности невелика
доля продукции пятого технологического уклада
(электроника, оптико-волоконная техника, про-
граммно-математическое обеспечение, телекомму-
никации, роботостроение), доминируют изделия
четвертого и третьего укладов (автомобилестро-
ение, электротехническое машиностроение, т.д.).
Авто и иные сервисы, заправки, стоянки необхо-
димы, но они связаны с накоплением капитала, а не
с инвестициями в инновации. В ведущих странах
мира производительность техники с применением
систем интеллектуализации производства выше,
чем обычного универсального оборудования в де-
сятки раз. По ряду регионов инновационно-актив-
ных предприятий насчитывается не более 5%, хотя
в расчете на рубль затрат инновации и в РФ обес-
печивает объемы производства в 7-8 раз больше,
чем при традиционных технологиях. Опросы гово-
рят, что даже при инновациях в 2010-2018 гг. глав-
ным целевым показателем было обеспечение мак-
симально быстрой отдачи вложенных средств.
Поэтому около половины затрат были связаны с
приобретением оборудования, необходимого для
освоения продуктовых и технологических иннова-
ций. К этому надо еще добавить расходы на техно-
логическую подготовку производства, что состав-
ляет еще 10-15% затрат на нововведения [данные
подобраны из указанных источников и экспертных
оценок]. Исследования и разработки занимают
говорить о приблизительно похожих подобных
результатах в г. Ростове и г. Бор Нижегородской области)
и выплат компенсаций.
4 - среди возможных причин можно предположить
конкуренцию внутри компаний - покупателей, с
другими предприятиями, поставляющими подобную
продукцию этим покупателям, обычные хищения
низшего или среднего персонала компаний покупателей
и заказчиков и ряд других вариантов.
16 Sciences of Europe # 46, (2019)
скромную долю (около 10%), преимущественно
ориентируясь на конечные этапы инновационного
цикла, то есть доработку, коммерциализацию уже
имеющихся научных разработок.
Принято выделять две группы отраслей, в од-
ной из которых преобладают процессные иннова-
ции. Это топливная, химическая и нефтехимиче-
ская промышленность, металлообработка, лесной
комплекс и пищевая промышленность. Тут иннова-
ционные технологии обеспечивают снижение мате-
риальных затрат, переработку отходов крупных
производственных компаний. Здесь в основном
выше интенсивность экспорта и эффективнее инно-
вации. Вторая группа — это отрасли, где домини-
руют продуктовые инновации. Это машинострое-
ние, промышленность строительных материалов,
легкая и медицинская промышленность, в которых
значительную роль играют повышение качества,
расширение ассортимента продукции и снижение
зависимости от импортного сырья, материалов и
полуфабрикатов. Инноваций здесь стало больше
после введения санкций, но эффективность, в ос-
новном, ниже, чем в первой группе отраслей. Тут
период от разработок новой (особенно принципи-
ально новой) продукции до освоения ее, если ори-
ентироваться на отечественную производственную
базу, достаточно большой. Без взаимодействия с
крупным бизнесом и государственными предприя-
тиями (РОСТЕХ, ОАК) практически невозможна и
нецелесообразна, за исключением тех видов про-
дукции, выпуск которых связан с существующим
оборудованием и не требует создания новых техно-
логических процессов и аппаратов. Соотношение
продуктовых и процессных инноваций приблизи-
тельно 50% на 50%. А вот затраты на маркетинг у
малых инновационных предприятий в целом очень
низка (1-5%). Еще меньше затраты на персонал. В
обучение для работы по новым технологиям вкла-
дывается до 0,6%. Прежде всего, здесь сказываются
слабая новизна и наукоемкость инноваций.
Санкции усугубили положение инновацион-
ной сферы малых предприятий, как наименее кон-
курентоспособного субъекта инвестиционного
рынка. В условиях резкого увеличения инвестиций
от государства на инновации государственная под-
держка через национальные проекты идет по
крупным, системным инновациям. Но оборачивае-
мость вложенных средств здесь имеет свои гра-
ницы. Наибольший эффект тут возможен в малом и
среднем бизнесе, особенно в некапиталоемких от-
раслях с быстрым оборотом капитала, высокой эф-
фективностью и минимальной стоимостью созда-
ния новых рабочих мест, за счет освоения научных
заделов. Это требует только одного, чтобы пред-
приниматели, заработанные средства хотели тра-
тить не только на личное потребление, но и на ин-
вестиции в инновации, на их качественное обнов-
ление.
Литература
1. Анисимов В.В. От Фредерика Тейлора до
системы «Бережливое производство» //
Современные проблемы теории машин. 2016. №4-
1. С. 168-171.
2. Бухалков М.И., Кузьмин М.А.,
Применение норм труда в совершенствовании
оперативного планирования бережливого
производства // Нормирование и оплата труда в
промышленности. 2019. №1. С.15-25.
3. Балашова Е.С., Громова Е.А. Оценка
результатов внедрения российскими компаниями
концепции бережливого производства // Известия
Юго-Западного государственного университета.
Серия: Экономика. Социология. Менеджмент.
2015. № 2 (15) С. 37-43.
4. Бережливое производство: итоги и задачи
// Железнодорожный транспорт. 2919. №2. С.70-74.
5. Кондратьев Э. Взгляд на управленческие
патологии через призму бережливого производства
// Проблемы теории и практики управления. 2015.
№3. С. 109-118.
6. Кокарева В.В., Смелов В.Г., Шитарев И.Л.
Имитационное моделирование производственных
процессов в рамках концепции «бережливого
производства» // Вестник Самарского
государственного аэрокосмического университета
им. Академика С.П.Королева (НИУ). 2012. №3-5
(34). С. 131-136.
7. Корнева М.С., Хомякова А.А.
Совершенствование системы управления
производством на основе внедрения концепции
«бережливого производства» //Сборник научных
трудов вузов России «Проблемы экономики,
финансов и управления производством». 2016.
№39. С. 73-81.
8. Кравченко Е.В. Сравнительная оценка
современных концепций управления:
методический аспект // Методы менеджмента
качества. 2015. №9. С. 4-8.
9. Медведева В.Р., Коренков М.М.
Формирование эффективной системы управления
наукоемким производством через призму
концепции «бережливое производство» (На
примере ПАО «Казаньоргсинтез») // Управление
устойчивым развитием. 2017Ю №3 (10). С.31-44.
10. Митыпова Н.В., Шарапова С.М.
Повышение эффективности управления
производственным процессом на основе концепции
бережливого производства / Известия Тульского
государственного университета. Технические
науки. 2015. №8-2. С.100-109.
11. Шибанов К.С. Исследование особенностей
технологии бережливого производства //
Экономика и предпринимательство. 2019. №1
(102). С. 1045-1049.
12. Шибанов К.С. Проблемы внедрения
«бережливого производства» на отечественных
предприятиях // Экономика в промышленности.
2017. Т.10. №4. С.335-343.
13. Practicum.Group / Категория: Менеджмент,
Статьи. https://practicum-
group.com/blogs/stati/metodika-berezhlivogo-
proizvodstva/
Sciences of Europe # 46, (2019) 17
MODELS OF AGRICULTURE EXPORT CAPACITY DEVELOPMENT
Karasova N.
Doctor of Economics, Associate Professor
Kyiv National University of Culture and Arts,
Ukraine
ORCID:0000-0002-8471-3870
ABSTRACT
Export-oriented capacity building depends on the country’s advance in economically efficient exchange,
which is based on proper definition of priorities of the general agricultural policy and adequate concentration of
regulatory instruments and resources in strategic directions. The objective of this article is to study the types of the
agriculturе export-oriented models and to determine the specific features of regulatory policies of the leading
countries for further use of the bast practices. The article analyses the conceptual approaches to regulation of social
and economic relations in the agricultural sector across the world, classifies export-oriented models of the agricul-
tural sector, and studies the models that ensures permanent growth of export of products (services) specific to the
Latin American countries as well as steady export in the EU countries.
Keywords: export-oriented model, agricultural sector, agricultural policy, steady growth, state support.
JEL classification: Q17, F15.
1. Introduction. Open economy treats export an
instrument to ensure the extended market space for re-
structured branches and productions capable of inten-
sive international competition. Export-oriented capac-
ity building, dynamisation of economic growth in the
agricultural sector, improvement of well-being and life
quality of population today depend on the country’s ad-
vance in economically efficient exchange, which is
based on proper definition of priorities of the general
agricultural policy and adequate concentration of regu-
latory instruments and resources in strategic directions.
Therefore, the study of bast practices of the leading
countries in creating and building export potential is
currently relevant.
Global best practices in development and imple-
mentation of the agricultural policies in order to imple-
ment their positive aspects in Ukraine has been studied
by a number of researchers such as O. M. Bubliienko,
I. V. Klymenko, B. M. Kryvoruk, Yu. O. Ulianchenko,
N. O. Shevchenko, N. V. Shybaieva, T. M. Kviatko, V.
H., Kremin, and others. These researchers have studied
specific features of the agricultural policies of the EU,
the US and Canada. Some researchers such as I. M.
Kulish and O. I. Tkach studied development of agricul-
ture regulatory policies of the Latin American coun-
tries. The studies cover numerous aspects of state sup-
port of the industry. Fewer works study export support
programs. Therefore, the objective of the article is to
study the types of the agricultural sector’s export-ori-
ented models to determine the specific features of reg-
ulatory policies of the leading countries for further use
of the best practices in Ukraine.
Presentation of Basic Materials. The analysis of
conceptual approaches to regulation of social and eco-
nomic relations in the agriculture of different countries
allows to distinguish the following two types of the ag-
ricultural policies:
- Product agricultural policies, which ensure high
productivity, efficiency, intensity and steady export ca-
pability of the industry. This type of agricultural poli-
cies is common in the most OECD countries, in partic-
ular the EU countries and the US, as well as specific to
some countries of Asia, Northern and Southern Amer-
ica, Among them, the most outstanding results and
leadership in the world market were reached by China,
Brazil, Argentina and the Philippines. As evidenced by
the study materials, success in development of the ag-
ricultural sector of these countries is associated with
and depends directly on significant capital investments
and support from the state [1; 6];
- Consumer agricultural policy characterized with
low productivity, efficiency and intensity. This type of
agricultural policy is common in many developing
countries, and outputs of the agricultural sector in these
countries are mostly used for domestic consumption.
The study of the agricultural policies of the first
type is relevant for scientific justification and imple-
mentation of the model of development in the develop-
ing countries, which seek to gain a foothold in the
global agriculture and food market, while the task of
developing and building the agricultural sector’s export
potential must be centred around the general agriculture
and food policies of the state and comply with their
principles.
The studies lack systematization of the agricul-
tural sector’s export-orienter models; however, scien-
tific materials [3; 5; 7; 8; 15] and analytical data [10]
reveal the following two main types of export-oriented
models: the model that ensures permanent growth of
export of the agricultural sector’s products (services)
used in the Latin American countries as well as the
model that ensures steady export specific to the EU
countries.
The first model is focused on increasing product
competitiveness and export as well as sales market ex-
pansion. The advantages of export-oriented develop-
ment of the agricultural sectors of the US, Brazil, Ar-
gentina, Columbia and other countries include the land
and labour resources as well as the management sys-
tem. The state policies in this case are aimed at stimu-
lation of development of large-scale export-oriented
agricultural productions. In view of steady increase in
export volumes, the governments chose the consoli-
dated sector governance system, which had been devel-
oping for many years. For instance, in the US, 70% of
export products account for 14% of large-scale agricul-
tural households. In Brazil and Argentina, around 80%
of all the cultivated lands are occupied with large lati-
fundia accounting for almost all the export crop prod-
ucts.
The leadership of the US in the global agriculture
and food market is ensured both by resources and ef-
fective state support, the main instruments of which are
the price control and the export programs. The farm in-
come is maintained at the level of income of workers in
other economy sectors by stabilisation of prices for ag-
ricultural products and reduction of non-distributed
stocks.
As evidences by the study materials [1; 2; 13; 14],
the US provides federal subsidies in case of reduction
of market prices to agricultural products below the
guaranteed level. A special government organisation
takes products in pledge from producers at guaranteed
prices, and in case the market price exceeds the pledge
rate, the producer takes its commodities out of pledge
and sells them in the market. If the prices are lower than
18 Sciences of Europe # 46, (2019)
the pledge rates, the commodities are kept by the gov-
ernment organisation. This way, the US, which is the
biggest exporter of agricultural products, supports its
domestic producers through maintaining the price
range which allows the domestic producers to benefit
from the conditions and the state to control the level of
world prices. At the same time, the US neither regulates
nor subsidises the prices for agricultural resources and
the interest rate provided under the state agricultural
credit programs. This allows to keep prices balanced
(key characteristics of the American agricultural pol-
icy) and to avoid creating preconditions to compensate
farmers for the capital goods acquisition. On the other
hand, the government helps farmers establish coopera-
tives for purchase and, in some cases, production of ag-
ricultural machinery and equipment.
According to the Food Security Act of 1985, the
US Government also initiated the application of direct
export subsidies, which was caused by the pressure of
the subsidised products from Europe rather than inter-
nal factors (increase in grain stocks and, consequently,
the negative impact of overvalued dollar and commod-
ity credit rates). Such programs provide for payment of
cash bonuses to exporters upon delivery of commodi-
ties to the countries and within the scope established by
the Foreign Agricultural Service. These payments al-
lowed the American farmers to sell agricultural prod-
ucts in the external market at a price below total pro-
duction costs. For the purpose of fulfilment of obliga-
tions to the WTO, the subsidies were partially
eliminated in 2011 and 2013. However, according to
the WTO [18], 13 export subsidy (XS) programs aimed
at support of competitiveness of certain types of dairy
products, eggs, meat (pork, chicken, beef), oil, rice, and
wheat are still in effect in the US today.
Moreover, the US offers the export credit guaran-
tee programs, with the first ones being introduced under
the Agricultural Trade Act in 1978, to facilitate financ-
ing of operations related to export and increase in pro-
duction volumes [13; 14]. To date, there are two pro-
grams of this category, including:
- Export Credit Guarantee Program (GSM-102).
The US Commodity Credit Corporation (ССС) pro-
vides guarantees for export credits issued by private
banks using the irrevocable dollar letter of credit for
purchase of the American agricultural products and
supplies by the importer;
- Facility Guarantee Program (FGP) for export
credits to establish the agricultural infrastructure. The
program is aimed at expansion of export of agricultural
products to the developing countries. The program in-
volves provision of guarantees for export credits for
supply of goods and services produced in the US, which
are aimed to provide the exporter with the required in-
frastructure, such as storage facilities, refrigeration
equipment, etc. This program requires the importer to
provide an obligatory initial payment amounting to
15% of the export delivery cost. Further payments are
made semi-annually for 1 to 10 years. The FGP guar-
antee covers 95% of the principal loan and interest
amount.
Various direct payments and state support of farm-
ers are crucial for development of the agricultural sec-
tor’s export in the US. Particularly, the budgetary sub-
sidies include a set of reforms, such as compensation
payments under the programs of livestock reduction
and change of cropping structure; subsidising of invest-
ments for consolidation of agricultural productions;
payments to agricultural commodity producers per unit
of area or head of livestock; reimbursement of expenses
on water supply, irrigation, gasification; various com-
pensations and tax allowances (turnover tax), etc.
The measures of general state support of the sector
aimed at structural changes include [9; 13; 14] the fol-
lowing: 1) Agricultural crediting; 2) Scientific support
of the agricultural sector development. There are pro-
grams aimed at increase of efficiency of agricultural
production through development of agricultural science
and education; 3) Infrastructure development. Farms in
rural areas are supported with loans, grants as well as
housing construction, powering, water treatment loan
guarantees. The Rural Development implements its
programs through the extensive network of representa-
tive offices that includes 47 regional (state level) and
450 local offices; 4) Environmental measures. A num-
ber of technical support programs are aimed at protec-
tion and preservation of the national natural heritage
and environment. For instance, in 2013, the land con-
servation programs covered 358 million ha of the US
lands, and the total conservation budget was USD 6.2
billion.
Thus, in spite of strategic goals for increasing ex-
port volumes, the US agricultural policy is also aimed
at development of rural areas, preserving small farms
and providing them with equitable access to production
resources, as well ensuring low footprint of farming.
With their agricultural sector being strongly ex-
port-oriented, the Latin American policies are some-
what different from the US policies due to numerous
factors. The financial support is a major tool for inten-
sifying agricultural production, adapting agriculture to
the capital accumulation needs and increasing export
potential in these countries. In particular, the first step
in Brazil was the creation of the national rural crediting
system (Sistema Nacional de Crédito Rural). The sys-
tem had given rise to changes in Brazil’s agriculture.
The use of new technologies and advanced materials
was encouraged. Subsidies for agricultural production
stimulated increase in demand for agricultural equip-
ment and supplies, which, in its turn, contributed to in-
creased employment in agriculture [3]. To date, Brazil
also has 16 programs of direct export subsidies for ag-
ricultural and food commodities. The main beneficiar-
ies of state support programs were medium and large-
scale agro-industrial producers, who received large
grants and loans, with small businesses also benefiting
in some ways [11]. However, in view of the number of
economic crises that the Latin American countries have
faced, the main goal of state policies was to achieve full
capacities of rural areas and reorient traditional agricul-
ture with focus on monoculture cultivation based on
global exports. This policy was particularly large-
scaled in Argentina, where mass cultivation of genet-
ically modified organisms (primarily soybeans) was
launched, and millions of hectares of the agricultural
heartland have been bought up by banks and then fur-
ther sold to foreign corporations and private investors.
Apart from the seed itself, the chemicals for growth and
pest control were actively used, which negatively af-
fected the environment. The state’s unsound interfer-
ence with agricultural production, driven by global
trends and desire to maximize benefits of the industry’s
export potential, resulted in structural transformations
in Argentina, which put numerous production lines at
threat of disappearance and could lead to the loss of
food self-sufficiency.
Another model to ensure sustainable export of the
agricultural sector’s products has been implemented in
the EU countries. It is developed on the platform of the
socially-oriented market economy and within the
framework of the Common Agricultural Policy of the
EU (CAP), which aims to ensure multifunctionality,
sustainable development and high competitiveness of
agriculture. The main principles of the CAP are the in-
crease in productivity of the agricultural sector by pro-
moting technological progress; ensuring optimal use of
Vol 2-no-46-2019
Vol 2-no-46-2019
Vol 2-no-46-2019
Vol 2-no-46-2019
Vol 2-no-46-2019
Vol 2-no-46-2019
Vol 2-no-46-2019
Vol 2-no-46-2019
Vol 2-no-46-2019
Vol 2-no-46-2019
Vol 2-no-46-2019
Vol 2-no-46-2019
Vol 2-no-46-2019
Vol 2-no-46-2019
Vol 2-no-46-2019
Vol 2-no-46-2019
Vol 2-no-46-2019
Vol 2-no-46-2019
Vol 2-no-46-2019
Vol 2-no-46-2019
Vol 2-no-46-2019
Vol 2-no-46-2019
Vol 2-no-46-2019
Vol 2-no-46-2019
Vol 2-no-46-2019
Vol 2-no-46-2019
Vol 2-no-46-2019
Vol 2-no-46-2019
Vol 2-no-46-2019
Vol 2-no-46-2019
Vol 2-no-46-2019
Vol 2-no-46-2019
Vol 2-no-46-2019
Vol 2-no-46-2019
Vol 2-no-46-2019
Vol 2-no-46-2019
Vol 2-no-46-2019
Vol 2-no-46-2019
Vol 2-no-46-2019
Vol 2-no-46-2019
Vol 2-no-46-2019
Vol 2-no-46-2019
Vol 2-no-46-2019
Vol 2-no-46-2019
Vol 2-no-46-2019
Vol 2-no-46-2019
Vol 2-no-46-2019
Vol 2-no-46-2019
Vol 2-no-46-2019
Vol 2-no-46-2019

More Related Content

Similar to Vol 2-no-46-2019

Консультаційна робота «МСП та держава: як відновити взаємну довіру?»
Консультаційна робота «МСП та держава: як відновити взаємну довіру?»Консультаційна робота «МСП та держава: як відновити взаємну довіру?»
Консультаційна робота «МСП та держава: як відновити взаємну довіру?»USAID LEV
 
Sciences of Europe No 77 (2021) Vol. 2
Sciences of Europe No 77 (2021) Vol. 2Sciences of Europe No 77 (2021) Vol. 2
Sciences of Europe No 77 (2021) Vol. 2Sciences of Europe
 
Sciences of Europe No 83 (2021) Vol. 3
Sciences of Europe No 83 (2021) Vol. 3Sciences of Europe No 83 (2021) Vol. 3
Sciences of Europe No 83 (2021) Vol. 3Sciences of Europe
 
Торговельне регулювання в Україні: Як знизити витрати українських МСП для вих...
Торговельне регулювання в Україні: Як знизити витрати українських МСП для вих...Торговельне регулювання в Україні: Як знизити витрати українських МСП для вих...
Торговельне регулювання в Україні: Як знизити витрати українських МСП для вих...USAID LEV
 
Адаптація переселенців в Україні №28 (69) (6 - 12 липня 2017 р.)
Адаптація переселенців в Україні №28 (69) (6 - 12 липня 2017 р.)Адаптація переселенців в Україні №28 (69) (6 - 12 липня 2017 р.)
Адаптація переселенців в Україні №28 (69) (6 - 12 липня 2017 р.)DonbassFullAccess
 
Проект Рекомендацій парламентських слухань "РОЗВИТОК ПІДПРИЄМНИЦТВА В УКРАЇНІ...
Проект Рекомендацій парламентських слухань "РОЗВИТОК ПІДПРИЄМНИЦТВА В УКРАЇНІ...Проект Рекомендацій парламентських слухань "РОЗВИТОК ПІДПРИЄМНИЦТВА В УКРАЇНІ...
Проект Рекомендацій парламентських слухань "РОЗВИТОК ПІДПРИЄМНИЦТВА В УКРАЇНІ...Viktor Halasiuk, PhD
 
Путівник експортера. Випуск №1
Путівник експортера. Випуск №1Путівник експортера. Випуск №1
Путівник експортера. Випуск №1USAID LEV
 
A new role of marketing and communication technologies in business and societ...
A new role of marketing and communication technologies in business and societ...A new role of marketing and communication technologies in business and societ...
A new role of marketing and communication technologies in business and societ...Ruslan Khusainov
 
A new role of marketing and communication technologies in business and societ...
A new role of marketing and communication technologies in business and societ...A new role of marketing and communication technologies in business and societ...
A new role of marketing and communication technologies in business and societ...Ruslan Husainov
 
Sciences of Europe No 81 (2021) Vol. 2
Sciences of Europe No 81 (2021) Vol. 2Sciences of Europe No 81 (2021) Vol. 2
Sciences of Europe No 81 (2021) Vol. 2Sciences of Europe
 

Similar to Vol 2-no-46-2019 (20)

Консультаційна робота «МСП та держава: як відновити взаємну довіру?»
Консультаційна робота «МСП та держава: як відновити взаємну довіру?»Консультаційна робота «МСП та держава: як відновити взаємну довіру?»
Консультаційна робота «МСП та держава: як відновити взаємну довіру?»
 
Консультаційна робота «МСП та держава: як відновити взаємну довіру?»
Консультаційна робота «МСП та держава: як відновити взаємну довіру?»Консультаційна робота «МСП та держава: як відновити взаємну довіру?»
Консультаційна робота «МСП та держава: як відновити взаємну довіру?»
 
МСП та держава: як відновити взаємну довіру?
МСП та держава: як відновити взаємну довіру?МСП та держава: як відновити взаємну довіру?
МСП та держава: як відновити взаємну довіру?
 
NJD_72_2.pdf
NJD_72_2.pdfNJD_72_2.pdf
NJD_72_2.pdf
 
Путівник експортера. Випуск №6
Путівник експортера. Випуск №6Путівник експортера. Випуск №6
Путівник експортера. Випуск №6
 
VOL 1, No 7 (7) (2016)
VOL 1, No 7 (7) (2016)VOL 1, No 7 (7) (2016)
VOL 1, No 7 (7) (2016)
 
Sciences of Europe No 77 (2021) Vol. 2
Sciences of Europe No 77 (2021) Vol. 2Sciences of Europe No 77 (2021) Vol. 2
Sciences of Europe No 77 (2021) Vol. 2
 
VOL-4-No-50-50-2020
VOL-4-No-50-50-2020VOL-4-No-50-50-2020
VOL-4-No-50-50-2020
 
Sciences of Europe No 83 (2021) Vol. 3
Sciences of Europe No 83 (2021) Vol. 3Sciences of Europe No 83 (2021) Vol. 3
Sciences of Europe No 83 (2021) Vol. 3
 
Торговельне регулювання в Україні: Як знизити витрати українських МСП для вих...
Торговельне регулювання в Україні: Як знизити витрати українських МСП для вих...Торговельне регулювання в Україні: Як знизити витрати українських МСП для вих...
Торговельне регулювання в Україні: Як знизити витрати українських МСП для вих...
 
Торговельне регулювання в Україні: Як знизити витрати українських МСП для вих...
Торговельне регулювання в Україні: Як знизити витрати українських МСП для вих...Торговельне регулювання в Україні: Як знизити витрати українських МСП для вих...
Торговельне регулювання в Україні: Як знизити витрати українських МСП для вих...
 
Адаптація переселенців в Україні №28 (69) (6 - 12 липня 2017 р.)
Адаптація переселенців в Україні №28 (69) (6 - 12 липня 2017 р.)Адаптація переселенців в Україні №28 (69) (6 - 12 липня 2017 р.)
Адаптація переселенців в Україні №28 (69) (6 - 12 липня 2017 р.)
 
NRES_Kyiv-Oblast_July_FINAL.pdf
NRES_Kyiv-Oblast_July_FINAL.pdfNRES_Kyiv-Oblast_July_FINAL.pdf
NRES_Kyiv-Oblast_July_FINAL.pdf
 
Проект Рекомендацій парламентських слухань "РОЗВИТОК ПІДПРИЄМНИЦТВА В УКРАЇНІ...
Проект Рекомендацій парламентських слухань "РОЗВИТОК ПІДПРИЄМНИЦТВА В УКРАЇНІ...Проект Рекомендацій парламентських слухань "РОЗВИТОК ПІДПРИЄМНИЦТВА В УКРАЇНІ...
Проект Рекомендацій парламентських слухань "РОЗВИТОК ПІДПРИЄМНИЦТВА В УКРАЇНІ...
 
Путівник експортера. Випуск №1
Путівник експортера. Випуск №1Путівник експортера. Випуск №1
Путівник експортера. Випуск №1
 
A new role of marketing and communication technologies in business and societ...
A new role of marketing and communication technologies in business and societ...A new role of marketing and communication technologies in business and societ...
A new role of marketing and communication technologies in business and societ...
 
A new role of marketing and communication technologies in business and societ...
A new role of marketing and communication technologies in business and societ...A new role of marketing and communication technologies in business and societ...
A new role of marketing and communication technologies in business and societ...
 
Sciences of Europe No 81 (2021) Vol. 2
Sciences of Europe No 81 (2021) Vol. 2Sciences of Europe No 81 (2021) Vol. 2
Sciences of Europe No 81 (2021) Vol. 2
 
NRES_Kyiv-Oblast_June_FINAL.pdf
NRES_Kyiv-Oblast_June_FINAL.pdfNRES_Kyiv-Oblast_June_FINAL.pdf
NRES_Kyiv-Oblast_June_FINAL.pdf
 
Norwegian Journal of development of the International Science №36 part 3
Norwegian Journal of development of the International Science №36 part 3Norwegian Journal of development of the International Science №36 part 3
Norwegian Journal of development of the International Science №36 part 3
 

More from Sciences of Europe

Sciences of Europe journal No 139 (2024).pdf
Sciences of Europe journal No 139 (2024).pdfSciences of Europe journal No 139 (2024).pdf
Sciences of Europe journal No 139 (2024).pdfSciences of Europe
 
Sciences of Europe journal No 138 (2024)
Sciences of Europe journal No 138 (2024)Sciences of Europe journal No 138 (2024)
Sciences of Europe journal No 138 (2024)Sciences of Europe
 
Sciences of Europe journal No 137 (2024)
Sciences of Europe journal No 137 (2024)Sciences of Europe journal No 137 (2024)
Sciences of Europe journal No 137 (2024)Sciences of Europe
 
Sciences of Europe journal No 136 (2024)
Sciences of Europe journal No 136 (2024)Sciences of Europe journal No 136 (2024)
Sciences of Europe journal No 136 (2024)Sciences of Europe
 
"Sciences of Europe" journal No 135 (2024)
"Sciences of Europe" journal No 135 (2024)"Sciences of Europe" journal No 135 (2024)
"Sciences of Europe" journal No 135 (2024)Sciences of Europe
 
Sciences of Europe No 134 (2024)
Sciences of Europe No 134 (2024)Sciences of Europe No 134 (2024)
Sciences of Europe No 134 (2024)Sciences of Europe
 
Sciences of Europe No 133 (2024)
Sciences of Europe No 133 (2024)Sciences of Europe No 133 (2024)
Sciences of Europe No 133 (2024)Sciences of Europe
 
Sciences of Europe No 132 (2023)
Sciences of Europe No 132 (2023)Sciences of Europe No 132 (2023)
Sciences of Europe No 132 (2023)Sciences of Europe
 
Sciences of Europe No 131 (2023)
Sciences of Europe No 131 (2023)Sciences of Europe No 131 (2023)
Sciences of Europe No 131 (2023)Sciences of Europe
 
Sciences of Europe No 130 (2023)
Sciences of Europe No 130 (2023)Sciences of Europe No 130 (2023)
Sciences of Europe No 130 (2023)Sciences of Europe
 
Sciences of Europe No 129 (2023)
Sciences of Europe No 129 (2023)Sciences of Europe No 129 (2023)
Sciences of Europe No 129 (2023)Sciences of Europe
 
Sciences of Europe No 128 (2023)
Sciences of Europe No 128 (2023)Sciences of Europe No 128 (2023)
Sciences of Europe No 128 (2023)Sciences of Europe
 
Sciences of Europe No 127 (2023)
Sciences of Europe No 127 (2023)Sciences of Europe No 127 (2023)
Sciences of Europe No 127 (2023)Sciences of Europe
 
Sciences of Europe No 126 (2023)
Sciences of Europe No 126 (2023)Sciences of Europe No 126 (2023)
Sciences of Europe No 126 (2023)Sciences of Europe
 
Sciences of Europe No 125 (2023)
Sciences of Europe No 125 (2023)Sciences of Europe No 125 (2023)
Sciences of Europe No 125 (2023)Sciences of Europe
 
Sciences of Europe No 124 (2023)
Sciences of Europe No 124 (2023)Sciences of Europe No 124 (2023)
Sciences of Europe No 124 (2023)Sciences of Europe
 
Sciences of Europe No 123 (2023)
Sciences of Europe No 123 (2023)Sciences of Europe No 123 (2023)
Sciences of Europe No 123 (2023)Sciences of Europe
 
Sciences of Europe No 122 (2023)
Sciences of Europe No 122 (2023)Sciences of Europe No 122 (2023)
Sciences of Europe No 122 (2023)Sciences of Europe
 
Sciences of Europe No 121 (2023)
Sciences of Europe No 121 (2023)Sciences of Europe No 121 (2023)
Sciences of Europe No 121 (2023)Sciences of Europe
 
Sciences of Europe No 120 (2023)
Sciences of Europe No 120 (2023)Sciences of Europe No 120 (2023)
Sciences of Europe No 120 (2023)Sciences of Europe
 

More from Sciences of Europe (20)

Sciences of Europe journal No 139 (2024).pdf
Sciences of Europe journal No 139 (2024).pdfSciences of Europe journal No 139 (2024).pdf
Sciences of Europe journal No 139 (2024).pdf
 
Sciences of Europe journal No 138 (2024)
Sciences of Europe journal No 138 (2024)Sciences of Europe journal No 138 (2024)
Sciences of Europe journal No 138 (2024)
 
Sciences of Europe journal No 137 (2024)
Sciences of Europe journal No 137 (2024)Sciences of Europe journal No 137 (2024)
Sciences of Europe journal No 137 (2024)
 
Sciences of Europe journal No 136 (2024)
Sciences of Europe journal No 136 (2024)Sciences of Europe journal No 136 (2024)
Sciences of Europe journal No 136 (2024)
 
"Sciences of Europe" journal No 135 (2024)
"Sciences of Europe" journal No 135 (2024)"Sciences of Europe" journal No 135 (2024)
"Sciences of Europe" journal No 135 (2024)
 
Sciences of Europe No 134 (2024)
Sciences of Europe No 134 (2024)Sciences of Europe No 134 (2024)
Sciences of Europe No 134 (2024)
 
Sciences of Europe No 133 (2024)
Sciences of Europe No 133 (2024)Sciences of Europe No 133 (2024)
Sciences of Europe No 133 (2024)
 
Sciences of Europe No 132 (2023)
Sciences of Europe No 132 (2023)Sciences of Europe No 132 (2023)
Sciences of Europe No 132 (2023)
 
Sciences of Europe No 131 (2023)
Sciences of Europe No 131 (2023)Sciences of Europe No 131 (2023)
Sciences of Europe No 131 (2023)
 
Sciences of Europe No 130 (2023)
Sciences of Europe No 130 (2023)Sciences of Europe No 130 (2023)
Sciences of Europe No 130 (2023)
 
Sciences of Europe No 129 (2023)
Sciences of Europe No 129 (2023)Sciences of Europe No 129 (2023)
Sciences of Europe No 129 (2023)
 
Sciences of Europe No 128 (2023)
Sciences of Europe No 128 (2023)Sciences of Europe No 128 (2023)
Sciences of Europe No 128 (2023)
 
Sciences of Europe No 127 (2023)
Sciences of Europe No 127 (2023)Sciences of Europe No 127 (2023)
Sciences of Europe No 127 (2023)
 
Sciences of Europe No 126 (2023)
Sciences of Europe No 126 (2023)Sciences of Europe No 126 (2023)
Sciences of Europe No 126 (2023)
 
Sciences of Europe No 125 (2023)
Sciences of Europe No 125 (2023)Sciences of Europe No 125 (2023)
Sciences of Europe No 125 (2023)
 
Sciences of Europe No 124 (2023)
Sciences of Europe No 124 (2023)Sciences of Europe No 124 (2023)
Sciences of Europe No 124 (2023)
 
Sciences of Europe No 123 (2023)
Sciences of Europe No 123 (2023)Sciences of Europe No 123 (2023)
Sciences of Europe No 123 (2023)
 
Sciences of Europe No 122 (2023)
Sciences of Europe No 122 (2023)Sciences of Europe No 122 (2023)
Sciences of Europe No 122 (2023)
 
Sciences of Europe No 121 (2023)
Sciences of Europe No 121 (2023)Sciences of Europe No 121 (2023)
Sciences of Europe No 121 (2023)
 
Sciences of Europe No 120 (2023)
Sciences of Europe No 120 (2023)Sciences of Europe No 120 (2023)
Sciences of Europe No 120 (2023)
 

Vol 2-no-46-2019

  • 1. VOL 2, No 46 (2019) Sciences of Europe (Praha, Czech Republic) ISSN 3162-2364 The journal is registered and published in Czech Republic. Articles in all spheres of sciences are published in the journal. Journal is published in Czech, English, Polish, Russian, Chinese, German and French. Articles are accepted each month. Frequency: 12 issues per year. Format - A4 All articles are reviewed Free access to the electronic version of journal All manuscripts are peer reviewed by experts in the respective field. Authors of the manuscripts bear responsibil- ity for their content, credibility and reliability. Editorial board doesn’t expect the manuscripts’ authors to always agree with its opinion. Chief editor: Petr Bohacek Managing editor: Michal Hudecek  Jiří Pospíšil (Organic and Medicinal Chemistry) Zentiva  Jaroslav Fähnrich (Organic Chemistry) Institute of Organic Chemistry and Biochemistry Academy of Sciences of the Czech Republic  Smirnova Oksana K., Doctor of Pedagogical Sciences, Professor, Department of History (Moscow, Russia);  Rasa Boháček – Ph.D. člen Česká zemědělská univerzita v Praze  Naumov Jaroslav S., MD, Ph.D., assistant professor of history of medicine and the social sciences and humanities. (Kiev, Ukraine)  Viktor Pour – Ph.D. člen Univerzita Pardubice  Petrenko Svyatoslav, PhD in geography, lecturer in social and economic geography. (Kharkov, Ukraine)  Karel Schwaninger – Ph.D. člen Vysoká škola báňská – Technická univerzita Ostrava  Kozachenko Artem Leonidovich, Doctor of Pedagogical Sciences, Professor, Department of History (Moscow, Russia);  Václav Pittner -Ph.D. člen Technická univerzita v Liberci  Dudnik Oleg Arturovich, Doctor of Physical and Mathematical Sciences, Professor, De- partment of Physical and Mathematical management methods. (Chernivtsi, Ukraine)  Konovalov Artem Nikolaevich, Doctor of Psychology, Professor, Chair of General Psy- chology and Pedagogy. (Minsk, Belarus) «Sciences of Europe» - Editorial office: Křižíkova 384/101 Karlín, 186 00 Praha E-mail: info@european-science.org Web: www.european-science.org
  • 2. CONTENT ECONOMIC SCIENCES Kuchciński A. THE ROLE OF GUARANTEE FUNDS IN SUPPORTING ENTREPRENEURSHIP IN POLAND ................................3 Aksenov V., Panfilova M. SUPPLY AND DEMAND IN THE DEVELOPMENT OF INBOUND TOURISM NIZHNY NOVGOROD REGION ....9 Aksenov V. OPERATIONAL MANAGEMENT: THE PRACTICE OF SMALL MANUFACTURING ENTERPRISES...................12 Karasova N. MODELS OF AGRICULTURE EXPORT CAPACITY DEVELOPMENT..........................................................17 Kozina K. REGIONAL MARKETS OF FREIGHT MOTOR TRANSPORT TRANSPORTATIONS AS CONSTITUENT OF INFRASTRUCTURAL PROVIDING OF COMPLEX DEVELOPMENT OF REGIONS.....................................22 Palant O., Stamatin V. TRENDS OF DEVELOPMENT OF EXISTING SYSTEMS AND PROSPECTS OF APPLICATION OF AUTOMATIC TRAIN OPERATION SYSTEMS IN SUBWAYS OF THE WORLD ......................................................................26 Yakhina E., Zaripova A. IMPROVEMENT OF TAX ACCOUNTING IN SMALL BUSINESSES ...............................................................33 HISTORICAL SCIENCES Tkachuk A. IMPLEMENTATION OF THE ASSOCIATION AGREEMENT BETWEEN UKRAINE AND THE EUROPEAN UNION IN THE CONTEXT OF RUSSIAN AGGRESSION: THE SECURITY ASPECT .......................37 PEDAGOGICAL SCIENCES Romanovskyi O., Zіnchenko L. SPIRITUAL AND MORAL EDUCATION OF STUDENTS SPECIALTY «PHYSICAL EDUCATION AND SPORT» AS A GUARANTEE OF FORMING A PROFESSIONAL ESPONSIBILITYFUTURE SPECIALIST ...........................41 Kozhyna H. ANALYSIS OF THE RESEARCH OF THE ROLE OF SOCIAL INSTITUTIONS IN THE PREVENTION OF AGGRESSIVE BEHAVIOR OF TEENAGERS ........................................44 Darniak I. EVOLUTION OF ACADEMIC CAREER STRUCTURES: BEST PRACTICES ARE INSTITUTIONAL TRANSFORMATIONS..................................................50 PHILOLOGICAL SCIENCES Kulumbetova A., Shvaikovskiy A. ABOUT PERCEPTION OF THE PAST AND THE PRESENT IN THE SYSTEM OF THE POEM IN PROSE “KAMEN’” BY I.S. TURGENEV...........................................................54 PSYCHOLOGICAL SCIENCES Vavryniv O. EMPATHY IN THE PERSONALITY STRUCTURE OF FUTURE RESCUERS AS SPECIALISTS IN EXTREME ACTIVITIES .................................................................59 Panova V. INTERRELATION BETWEEN LEADERSHIP QUALITIES AND LEVEL OF RESPONSIBILITY OF STUDENTS OF NATIONAL UNIVERSITY CIVIL DEFENSE OF UKRAINE...............................................................64
  • 3. Sciences of Europe # 46, (2019) 3 ECONOMIC SCIENCES THE ROLE OF GUARANTEE FUNDS IN SUPPORTING ENTREPRENEURSHIP IN POLAND Kuchciński A. PhD in economics, assistant professor University of Social Sciences in Lodz ABSTRACT The problem of financing enterprises is a serious barrier that hinders the development of SME in Poland. Attempts to solve the problem are being made by the guarantee funds, i.e. financial institutions that provide credit guarantees for enterprises. The aim of the article is to present the important activity of guarantee funds in Poland and to identify their role. To achieve this goal, the author used the method of literature and source data analysis. Keywords: guarantee funds, entrepreneurship, SME sector. Introduction The issue of financing activities is a "sensitive" problem faced by companies at different stages of their development. Enterprises (mainly micro and small) are more willing to use their own resources when choosing a source of financing. The abandonment of other forms of financing is due to fear of their use and lack of cre- ditworthiness. It is therefore important to create pro- grammes that help companies to raise finance, as the obstacles to obtaining credit or loans are not the interest rate, but the conditions they have to meet [1, p.30]. Lack of credit history, required collaterals or high costs of application processing constitute barriers to access to external capital. One of the instruments by means of which enterprises will increase their ability to obtain external financial resources are non-banking sources of financing, such as guarantee funds [2, p.503.]. Guarantee funds are financial institutions that take over credit risk from banks. They are a source of long- term financing for enterprises, i.e. they are an instru- ment that meets capital needs. These funds are part of a financial combination of innovative support for the de- velopment of small and medium-sized enterprises. They provide aid mainly to enterprises of the SME sec- tor in the form of guarantees. The guarantee itself is a security for the repayment of a debt (credit or loan) that a company has contracted with a given financial insti- tution [3, p.187]. Guarantee funds are are non-profit organisations. The potential profit cannot be used for dividend pay- ments, but only increases the guarantee capital, which increases the security and credibility of the fund. The guarantee fund is primarily capital. The fund secures loans with its own financial resources, which it holds, i.e. guarantee capital (fund). Capital is also a guarantee for the bank that the guarantees granted are covered and the fund is sol vent [4, p.116-118]. The purpose of the guarantee funds is to facilitate access to external financial resources in the form of guarantees for micro, small and medium-sized enter- prises. Their activities affect not only the development of local and regional entrepreneurship, but also have a positive impact on the economy as a whole, as they in- crease its competitiveness and innovation. It should be stressed that these funds do not directly provide finan- cial resources for businesses, nor do they help to obtain or improve their creditworthiness. They provide sup- port only to those entrepreneurs whose only shortcom- ing is the lack or inadequacy of debt security. Support is implemented in the following areas, namely reducing the risk of financing the enterprise and building its credit history, providing support in the area of loan se- curity, verifying the financial analyses contained in the business plan [5, p.223]. Importance of guarantee funds In response to the steadily deteriorating position of SME enterprises in relation to large companies in terms of access to services offered by banks, guarantee funds were established. Despite the fact that in the time of growing competition among various financial institu- tions also on the banking services market confidence in small and medium enterprises is growing, it seems that assistance from the guarantee funds is still necessary, especially in the scope of providing support to the un- employed who want to run their own business [6, p.105-106]. Surety funds operate on the basis of general legal regulations, i.e. the provisions of the Civil Law and the provisions of the Commercial Companies Act, and are not subject to any special control. Although the funds were established at the beginning of the 1990s, no com- prehensive legislative solutions have been developed to date. On the one hand, the fund's activities are based on regulations that regulate normal economic relations, while on the other hand, they benefit from the provi- sions of national and regional programmes they imple- ment, which are financed from public funds and struc- tural funds. The current legal acts, which regulate, among others, the rules of granting sureties and guar- antees by the State Treasury, do not cover the issue of activity of entities in the form of sureties funds [7, p.89]. Funds are characterized by a diversified structure in terms of organizational and legal form, the size of the capital held, the procedures for granting guarantees or the territorial scope of their activities. They form a group of independent entities specialized exclusively in the field of guarantee activity, but there are also such funds which are one of the elements of a larger entity's activity. It is difficult to determine the exact number of functioning institutions of this type, mainly due to the
  • 4. 4 Sciences of Europe # 46, (2019) fact that it is a licensed activity and no special registra- tion procedure is required [1, p.31]. A large number of guarantee funds have been set up by local authorities, local organisations and associations. Most often they operate in the form of a company, associations and foundations. Taking into account the value of capital held by credit guarantee funds, the following funds are distin- guished [8, p.10]:  very small - guarantee capital < PLN 2 million,  small - PLN 2 million ≤ guarantee capital < PLN 10 million,  average - PLN 10 million ≤ guarantee capital < PLN 20 million,  large - PLN 20 million ≤ guarantee capital < PLN 50 million,  very large - PLN 50 million ≤ guarantee capi- tal. In order for a company to be able to apply for a loan guarantee, it must meet certain conditions. Firstly, it is important to have the status of an entrepreneur and its activity must be conducted in the territory of the Re- public of Poland. An application for a loan or credit should be submitted to such a financial institution, e.g. a bank or a loan fund, which on the basis of a concluded agreement cooperates with a given guarantee fund. A surety may cover a loan or a credit if the financial re- sources are used for purposes related to commencing or conducting business activity. If the entrepreneur is obliged to repay the previously received public aid, the surety cannot be granted. The value of the granted surety may not exceed 5% of the guarantee fund's eq- uity. The maximum value of a surety may be granted up to 80% of the loan amount, while the value of the surety may not exceed 80% of the amount of current liabilities resulting from the credit/loan agreement. Surety funds grant a surety for a maximum period of approx. 60 months, and fees and commissions are charged from the moment the agreement is concluded until the surety expires. The amount of the commission depends mainly on the duration of the loan agreement. Funds enable entrepreneurs to repay their commitments in installments [9, p.47]. The common element in all the credit guarantee funds operating in Poland is the bank's primary role, which means that the initiation of the procedure for granting or refusing a guarantee in the fund depends on the bank's positive assessment of the possibility of fi- nancing the project. The entrepreneur first submits the required application to a given guarantee fund together with supporting documentation [10, p.31]. The scope of such documentation should correspond to the docu- mentation required by banks, as funds aim at standard- ising their documentation with that used by banks. Therefore, in addition to the application, the results of the analysis of the application of the entrepreneur ap- plying for a loan and the results of the assessment of the investment project together with the documents on the basis of which the results were achieved are attached. Both the analysis and the assessment were carried out in accordance with the procedures in force in the bank. Current registration and statutory documents not older than 3 months are also required, as well as documents confirming that the entrepreneur has no arrears with the Social Insurance Institution and the State Treasury. The application is also accompanied by a copy of the agree- ment or decision on granting a loan [11, p.85]. Under a guarantee agreement, the fund undertakes to reimburse the bank for any loan or part thereof in the event that the borrower fails to repay the loan to the bank. As a result, the bank receives credible collateral, while the borrower may obtain funds in the form of a loan [12, p.153]. In each of the Funds there are two bodies which take part in the evaluation of the applications. The first body (usually the fund director) evaluates the formal and substantive aspects of the application, while the fi- nal decision to grant a guarantee is made by the second body, i.e. the selection committee based on the fund di- rector's analysis and information about the entrepre- neur. This committee consists of managing and/or su- pervising bodies and persons from outside the fund [10, p. 32]. Guarantee funds as parabank institutions grant guarantees for loans and credits to enterprises, mainly for activities related to starting or further development of the company, financing its activities and invest- ments, for purposes related to the implementation of in- novative technological solutions or creation of new jobs [13, p.330]. In addition to assuming the risk of in- solvency of the company, these funds also provide other services such as helping clients with formalities to obtain credit and organizing various additional train- ing courses. They also take over the obligation to mon- itor borrowers in order to strengthen their cooperation with banks [14, p.330]. Despite the existence of many credit guarantee funds based essentially on a single mechanism, there are some differences between them which affect their differentiation. For example, there is a diversity in terms of defining the target client of the fund. Sureties are granted mainly to the SME sector, however, there are some preferences. Funds established on the basis of the resources of the Agricultural Property Agency of the Treasury may be guaranteed to a person residing in a rural area. The individual character of the funds' ac- tivity is also reflected in the amount of the surety of- fered [15, p.21]. Table 1 presents typical features of guarantee products, which in some respects may differ from the products offered by individual funds, but these differences are negligible and do not have a significant impact on the functioning of the guarantee funds sys- tem in Poland.
  • 5. Sciences of Europe # 46, (2019) 5 Table 1. Standard features of surety products in Poland [16, p.157] Beneficiaries of the guarantee  Micro, small and medium-sized enterprises conducting business activity and not being in a difficult situation within the meaning of EU regulations, usually operating on the market for at least 3 months, Application proce- dure for surety  The beneficiary should submit an application for a loan/loan guarantee through a financing institution (commercial bank or loan fund) together with the documents re- quired by the financing institution and the guarantee fund. The period for applying for the surety is at least 7 days from the date of submission of the necessary documents, the maximum waiting time may be 1 month. As a rule, documents submitted to the financing institution are sufficient to apply for a guarantee. It is necessary to submit a short application for a guarantee to the guarantee fund via a financial institution. The Guarantee Fund shall carry out a risk assessment of the beneficiary independent of the financing institution. Surety amount  It depends on the amount of the fund's guarantee capital - not more than 5% of the fund's guarantee capital.  A surety for one entrepreneur or entrepreneurs related by capital may not be higher than 80% of the loan value.  As a rule, guarantee funds apply the guarantee principle up to 70% of the loan value, but on average 60%.  Taking into account the largest guarantee fund in Poland, POLFUND FPK with the largest capital at its disposal (excluding KFPK and FPU Funds), the maximum guaran- tee is PLN 3,150 thousand. Surety period  Hand-guaranteed for a standard period of 12 months with a maximum period of 60 months. Purpose of the guar- antee Sureties may be used for any credit and loan purpose related to the conducted business activity, including e.g. for purposes related to the conducted business activity:  investment,  rotatable,  turnover and investment. Surety security  Beneficiary's blank promissory note together with a promissory note declaration - authorizing the guarantee fund to fill in the promissory note in case of problems with the execution of the guarantee.  Very rarely other forms of material security. Surety fees  No fees shall be charged for the acceptance and processing of a request for surety, unless it concerns changes in the terms and conditions of a surety during the term of a surety agreement.  Surety fee depends on the period for which the surety was granted.  Surety fees are divided into an initial fee and an annual or quarterly fee for the duration of the surety.  The one-time preliminary fee for a surety varies from 0.5 to 3% of the value of the surety amount.  The annual fee is maximum 1.5% of the value of the active guarantee. Method of payment of the guarantee to the sponsoring un- dertaking  The payment of the value of the surety due to the institution shall normally take place within 1 to 6 months of the institution's becoming aware of its creditworthiness. Recovery of amounts receivable  Recovery is usually carried out by a guarantee fund, often in cooperation with a bank. Guarantee fund op- erating area/ availa- bility of guarantees Guarantee funds are local, regional or national in scope. The possibility of using the offer of the guarantee fund depends on the amount of its capital and the scope of its activity. As a rule, in order to be able to use the funds offered, an entrepreneur must have a registered office or, in the case of a natural person, a place of residence or main place of business within the area where the guarantee fund operates, and a contract with a financing institution is important. Guarantee funds have become a key element of the financial market and the system supporting the devel- opment of the SME sector. The strategic goal of the guarantee funds is to facilitate access to external sources of financing for micro, small and medium en- terprises. The objectives of their functioning are cov- ered by barriers faced by enterprises in accessing fi- nancing. In this connection, the functions performed by the funds include: reducing financial risk and creating
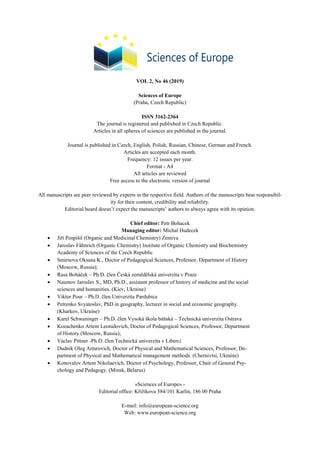
  • 6. 6 Sciences of Europe # 46, (2019) credit history of enterprises and creating collateral for bank loans. They also verify business plans drawn up by companies and enable banks to obtain information about a given economic entity [16, p.155]. The above functions performed by the guarantee funds result in their two main objectives of activity, i.e. overarching and intermediate objectives. Within the scope of overriding objectives, the funds provide enter- prises with easy access to external forms of financing and create an integrated, effective and secure system of guarantee funds. On the other hand, intermediate objec- tives include increasing corporate lending and having a positive impact on the labour market, as they contribute to the creation of new jobs and the preservation of ex- isting ones [16, p.137]. Thanks to the support that micro, small and me- dium enterprises may receive from the guarantee funds, it is possible for a situation to appear in the poviat or commune where the dynamics of their economic devel- opment increases. Therefore, it is very important for lo- cal authorities to provide support to both new and ex- isting guarantee funds [17, p.490]. Activity of guarantee funds Guarantee funds are one of the business support institutions which have adopted as their main objective the provision of assistance to various business entities in the form of material guarantees to those entities which apply for financing [18, p.273]. The offer of credit guarantee funds is characterized by complemen- tarity mainly with services offered by banks and loan products offered by various financial institutions. Therefore, the granted guarantees must be provided to- gether with a package of services of commercial banks, loan institutions and public entities (e.g. poviat employ- ment offices). In order for the guarantee funds to be able to conduct effective activity, it is required to for- mulate common rules and forms of their functioning within the scope of services provided to local entrepre- neurs [19, p.91]. The guarantee market accessible to small and me- dium-sized enterprises is shaped by the “Bank Gospo- darstwa Krajowego”, which provides guarantees and is a co-owner of a large number of guarantee funds, as well as local, subregion and regional guarantee funds [20, p.65]. An important role in the functioning and develop- ment of guarantee funds is played by the National Guar- antee Group, which integrates local and regional guar- antee funds with the participation of local government units and Bank Gospodarstwa Krajowego. Currently there are 19 local and regional guarantee funds operat- ing within the Group and its objective is to support shareholders in the guarantee activity by means of co- operation with institutions responsible for formulating legal regulations concerning the guarantee market and work on standardization of the processes occurring in the funds. The Group deals with advertising and pub- lishing activities, provides consulting and training ser- vices, manages the database and supports the use of IT tools. The National Guarantee Group together with the Polish Banks Association has developed common standards of guarantee activity [20, p.47]. A very important element for the functioning of guarantee funds are associations, namely the National Association of Guarantee Funds. The Association was established in 1996 at the time of liberalization and de- velopment of financial services and consists of people who are engaged in activities aimed at the development of the financial market for the SME sector and various financial institutions and economic and social organi- zations supporting the development of these enter- prises. The aim of the National Association of Guaran- tee Funds is primarily to support the development of the system of credit guarantee funds and to cooperate with those institutions (government, local government, fi- nancial) that also operate in this field. They also pro- mote guarantee funds and disseminate knowledge and exchange experiences in the field of guarantee activity. The Association cooperates with Bank Gospodarstwa Krajowego, the Polish Agency for Enterprise Develop- ment and various agencies involved in building a sys- tem of financial instruments, especially guarantees [21]. Guarantee funds in Poland cooperate with various business entities, mainly with commercial banks, but also with a group of loan funds and financial institu- tions. The activity of these funds is reflected in the amounts of loans and credits disbursed thanks to the following guarantees [19, p.92]. The activity of guarantee funds depends on many factors, including the amount of capital held. The gov- ernmental program "Capital for entrepreneurs" imple- mented in 2002-2006, which at the end of 2007 allowed 51 credit guarantee funds to have about PLN 589 mil- lion of funds from subsidies under the Sectoral Opera- tional Program Improvement of the Competitiveness of Enterprises and contributed shares and stocks of Bank Gospodarstwa Krajowego, was of significant im- portance for the development and size of the capital held by the guarantee funds. In 2009, the document "Directions of development of loan and guarantee funds for small and medium enterprises in the years 2009-2013" was adopted, where in this financial per- spective these funds received support for development within the framework of organizational and economic activities. The funds could apply for capitalisation of their activities from the Regional Operational Pro- grammes and from the Framework Programme for Competitiveness and Innovation [22, p.3-4]. As at 31.12.2016, the funds had capital of approx- imately PLN 1.1 billion, which in comparison to the previous year meant a decrease by approximately PLN 29 million. This situation is mainly related to the fact that some of the guarantees granted were recognised as repaid and that 44 guarantee funds operated in 2015 [23, p.6-7]. The activity of the funds, on the other hand, is measured by the number of guarantees granted. Ac- cording to the report of the National Association of Guarantee Funds, at the end of 2016, 7453 guarantees were granted, where an annual increase in the number of granted guarantees is observed over a period of 5 years. As shown in Figure 4, the value of sureties granted has also increased. Compared to the previous year, this value increased by PLN 25 million and as at
  • 7. Sciences of Europe # 46, (2019) 7 31.12.2016 amounted to PLN 949 million. The high value of guarantees is close to the situation where in the years 2011-2012 the value was around PLN 1 billion. The observed growth of these entities is a consequence of the adaptation of the guarantee funds to the function- ing of the competitive offer of de minimis guarantees and granting guarantees as tender deposits [23, p.8]. As can be seen from Graph 1, the most frequent guarantees are granted to enterprises employing up to 9 persons, where they constitute 60% of all guarantees granted at the end of 2016. In the three presented enti- ties in the years 2014-2016, an increase in the number of such sureties can be observed. Graph 1. Number and value of sureties granted by the funds in 2012-2016 Graph 2. The guarantees provided by the funds over the period 2014-2016 by size of enterprise Summary Micro, small and medium enterprises play a key role in the shaping of the country's economy, as evi- denced by the fact that they constitute 99% of all enter- prises. The SME sector contributes not only to the cre- ation of new jobs but also has a significant share in the creation of the gross domestic product, therefore sup- porting the development of enterprises by various na- tional, regional and local institutions is so important. The main problem of enterprises, which limits the possibility of continuous development, expansion of their activity, undertaking new investments, is the fi- nancial factor, namely the issue of obtaining funds for the implementation of planned activities. In many cases, the financing of new projects with only own cap- ital is insufficient, and entrepreneurs then resort to ex- ternal forms of raising capital. Unfortunately, due to the specific nature of business activity of enterprises, their availability and possibility of using financial resources from external sources is limited. Therefore, financial institutions such as guarantee funds try to fill in a specific financial gap. Their pur- pose and character of the measure allows for granting support to enterprises which have no chance to take ad- vantage of e.g. bank credit or other forms due to the 5 678 6 175 5 578 6 336 7 453 1 190 877 833 924 949 0 1 000 2 000 3 000 4 000 5 000 6 000 7 000 8 000 2012 2013 2014 2015 2016 Number of guarantees Value (mln PLN) 3 827 3 909 4 495 1 497 1 871 2 583 253 349 352200 207 23 0 1 000 2 000 3 000 4 000 5 000 2014 2015 2016 micro small medium other
  • 8. 8 Sciences of Europe # 46, (2019) strict requirements imposed on them. When granting fi- nancial support to enterprises in the form of guarantees, these funds are guided not only by the development of the SME sector, but also by the development of the re- gion in which they operate. The analysis of the functioning of the funds showed how important their role in the system of sup- porting entrepreneurship in Poland is. Therefore, it is important to undertake such actions that will be focused on the development of these institutions, which may translate into regional and national development. References 1. Bieńkowska B., Fundusze poręczeniowe jako wsparcie dla finansowania działalności MSP (Bielski Fundusz Poręczeń Kredytowych) „Zeszyty Naukowe Uniwersytetu Szczecińskiego. Ekonomiczne Problemy Usług.”, nr 34, 2009. 2. Sieradzka K., Działalność funduszy poręczeń kredytowych na rzecz rozwoju przedsiębiorczości w Polsce, „Zeszyty Naukowe Uniwersytetu Szczecińskiego. Finanse, Rynki Finansowe, Ubezpieczenia.”, nr 37, 2011. 3. Kuchciński A., Fundusze poręczeniowe w Polsce, [in:] Finansowanie działalności przedsiębiorstw a społeczna odpowiedzialność biznesu, ed. A. Krzysztofek, Kraków 2014. 4. Dylikowski K., Praktyczne aspekty funkcjonowania funduszy poręczeniowych w Polsce na przykładzie Poznańskiego Funduszu Poręczeń Kredytowych, [in:] Fundusze poręczeniowe i pożyczkowe w finansowym wspieraniu sektora mikro- , małych i średnich przedsiębiorstw w Polsce, ed. A. Janc, K. Waliszewski, Warszawa 2014. 5. Frydrych Ł., Sektor MSP oraz warunki jego funkcjonowania w Polsce, [in:] Promocja małej i średniej przedsiębiorczości w Unii Europejskiej: szanse, wizerunki, korzyści, ed. A. Hess, Kraków 2007. 6. Waniak – Michalak H., Pozabankowe źródła finansowania małych i średnich przedsiębiorstw, Kraków 2007. 7. Walczyna Ł., Uwarunkowania formalnoprawne dotyczące korzystania z funduszy poręczeniowych i pożyczkowych w Polsce, [in:] Fundusze poręczeniowe i pożyczkowe w finansowym wspieraniu sektora mikro-, małych i średnich przedsiębiorstw w Polsce, ed. A. Janc, K. Waliszewski, Warszawa 2014. 8. Raport o stanie funduszy poręczeniowych w Polsce – na dzień 31.12.2016 r., Krajowe Stowarzyszenie Funduszy Poręczeniowych, Warszawa 2017. 9. Hryniewiecka M., Fundusze pożyczkowe i poręczeniowe dla przedsiębiorstw, „Myśl Ekonomiczna i Polityczna”, nr 2, 2014. 10. Gajewski M., Kiliański T, Szczucki J., Zasady organizacji i funkcjonowania funduszy poręczeń kredytowych, Polska Agencja Rozwoju Przedsiębiorczości, Warszawa 2000. 11. Kuchciński A., Analiza działalności funduszy poręczeniowych w województwach świętokrzyskim i podkarpackim w latach 2010-2016, [in:] Stan i perspektywy rozwoju przedsiębiorczości – wymiar krajowy, regionalny, lokalny ze szczególnym uwzględnieniem powiatu tarnobrzeskiego, ed. G. Wilk- Jakubowski, A. Buś-Bidas, Wydawnictwo Społecznej Akademii Nauk, Łódź-Warszawa 2018. 12. Brzegowa E., Czajkowska J., Projektowanie organizacji nowego przedsiębiorstwa, [in:] Współczesne trendy w zarządzaniu projektami, ed. M. Sołtysik, M. Wesołowska, Kraków 2016. 13. Makarska-Cynk M., Fundusze poręczeń w Polsce – Podkarpacki Fundusz Poręczeń Kredytowych spółka z o.o. „Zeszyty Naukowe Uniwersytetu Szczecińskiego. Finanse, Rnki Finansowe, Ubezpieczenia.”, nr 50, 2012. 14. Waniak – Michalak H., Gwarancje i poręczenia kredytowe jako instrumenty wsparcia małych i średnich przedsiębiorstw – znaczenie i prezentacja w sprawozdaniach finansowych gwaranta i beneficjenta, [in:] System rachunkowości w okresie kryzysu gospodarczego, ed. I. Sobańska, P. Kabalski, Łódź 2010. 15. Hausner J., Frączek M., Sułkowski R. (ed.), Fundusze Rozwoju Regionalnego i Lokalnego, Warszawa 2001. 16. Bartkowiak B., Fundusze pożyczkowe i poręczeniowe w finansowaniu małych i średnich przedsiębiorstw w Polsce, Warszawa 2009. 17. Pluskota P., Fundusze poręczeń kredytowych w Polsce [in:] Instytucje rynku finansowego w Polsce, ed. A. Szelągowska, Warszawa 2014. 18. Szopik – Depczyńska K., Depczyński R., Instytucje wsparcia innowacji, „Studia i Prace Wydziału Nauk Ekonomicznych i Zarządzania”, nr 34, 2013. 19. Alińska A., Rola lokalnych i regionalnych funduszy poręczeniowych w kreowaniu rozwoju społeczno – ekonomicznego regionów, „Zagadnienia Ekonomiki Rolnej”, nr 1, 2007, 20. Janc A, Waliszewski K., (ed.), Fundusze poręczeniowe i pożyczkowe w finansowym wspieraniu sektora mikro-, małych i średnich przedsiębiorstw w Polsce, Warszawa 2014. 21. Krajowe Stowarzyszenie Funduszy Poręczeniowych, https://ksfp.org.pl/o-ksfp/ 22. Kierunki rozwoju funduszy pożyczkowych i poręczeniowych dla małych średnich przedsiębiorstw w latach 2009-2013, Ministerstwo Gospodarki, Warszawa 2009. 23. Rynek Funduszy Pożyczkowych w Polsce. Raport 2016, Polski Związek Funduszy Pożyczkowych, Warszawa 2017.
  • 9. Sciences of Europe # 46, (2019) 9 СПРОС И ПРЕДЛОЖЕНИЕ В РАЗВИТИИ ВЪЕЗДНОГО ТУРИЗМА НИЖЕГОРОДСКОГО РЕГИОНА Аксенов В.А. к.и.н., доцент Панфилова М. магистрант Нижегородский госуниверситет им. Н.И. Лобачевского, Нижний Новгород SUPPLY AND DEMAND IN THE DEVELOPMENT OF INBOUND TOURISM NIZHNY NOVGOROD REGION Aksenov V. Ph. D., associate Professor Panfilova M. undergraduate Lobachevsky state University of Nizhny Novgorod, Nizhny Novgorod АННОТАЦИЯ Авторы рассматривают вопрос о факторах рынка вьездного туризма в российских регионах, анализи- руют спрос и предложение в сфере индустрии гостеприимства Нижегородской области. Предлагают свое видение региональных пролем и решений. ABSTRACT The authors consider the factors of the market of inbound tourism in the Russian regions, analyze the supply and demand in the hospitality industry of the Nizhny Novgorod region. They offer their own vision of regional problems and solutions Ключевые слова: въездной туризм, коллективные средства размещения, структура спроса на турист- ские услуги. Keywords: inbound tourism, collective accommodation facilities, structure of demand for tourist services В мае 2018 г. Распоряжением Правительства РФ утверждена новая концепция Федеральной це- левой программы «Развитие туризма внутреннего и въездного туризма в РФ (2019-2025 годы)» с про- гнозным объемом финансирования за счет средств федерального бюджета в размере около 70 млрд. рублей. При этом на каждый рубль бюджетных средств необходимо привлечь не менее 2,2 рубля внебюджетных инвестиций. Как указано в концеп- ции, конечным результатом программы будет яв- ляться рост совокупного туристского потока по России до уровня 93 млн. человек (рост в 28%), что позволит достичь запланированного увеличения вклада туризма в валовой внутренний продукт РФ более чем на 70% к концу 2025 года. Сделать это можно только сделав ставку на развитие внутреннего и вьездного туризма в регио- нах России. Современный рынок туристических услуг в Нижегородской области показывает заметный рост въезда иностранных гостей за 2017-2019 годы. Итоги Национального рейтинга въездного туризма за 2018 и 1-е полугодие 2019 года показали эту тен- денцию (см. Таблица 1). Таблица 1. Данные по въездному туризму TOP-20 регионов России по итогам Рейтинга за 2017, 2018 и 1-ое полуго- дие 2019 года1 Место за 2019 год Наименование субъекта РФ Общее кол-во баллов Всего туристов, чел. 2018г. туристов на 1000 жителей 2018г. прирост иностран- ных туристов 2018г. 1 Город федерального значения Москва 25,5 4 971 435 432 1 180 757 2 Город Санкт-Петербург 25,2 1 865 132 382 197 409 3 Приморский край 24,8 393 865 201 137 886 4 Московская область 24 395 584 56 102 538 5 Краснодарский край 23,5 249 320 48 77 949 6 Калининградская область 23,4 109 582 115 40 988 7 Нижегородская область 23,3 144 202 44 104 012 Нижегородская область зафиксировала рост иностранных гостей в 2018 г. в 3,5 раза больше, чем в 2017 (4 место в рейтинге регионов). Входя в первую, «золотую», группу рейтинга с условным 1 составлено авторами на основании данных Росстата, журнал «Отдых в России» и ряда других источников названием «5 звезд» (20 регионов), Нижегородская область с девятого места в 2018 году поднялась на седьмое, обогнав Татарстан и Свердловскую об-
  • 10. 10 Sciences of Europe # 46, (2019) ласть, столицы которых крупнейшие деловые цен- тры Казань и Екатеринбург также проводили матчи Чемпионата по футболу. Мы исходим из гипотезы о сохранении этой тенденции, что отчасти подтверждается данными по первой половине 2019 года. При этом, надо учесть, что на вторую половину года приходится пик туристического сезона. В рамках этой тенден- ции постепенно выстраиваются стратегия, планы, инвестиционные программы региона. Вторым долговременным фактором, влияю- щим на программы и планы региона является бли- зость его к столице Российской Федерации Москве и ее туристским потокам. Доля Москвы в общем ко- личестве иностранных граждан, размещенных в коллективных средствах размещения (без учета микропредприятий), среди посетивших Россию в 2017 г.туристов, составила более 47%. Эта доля ста- бильно высока была в течение всех последних лет. За предшествующие годы она колебалась в преде- лах от 39% до 42%, а в 2017 г. существенно выросла (с 41% до 47%). Возьмем статистические данные о численности иностранных граждан, размещенных в КСР (коллективных средствах размещения) по го- дам (см. Таблицу 2). Таблица 2. Численность иностранных граждан, размещенных в КСР (без учета микропредприятий)[4] 2009 2010 2011 2012 2013 2014 2015 2016 2017 Российская Федерация 3055,4 3413,4 3865,9 4213,6 4443,6 4607,9 5033,5 6092,2 8028,8 Московская область 135,4 103,1 102,1 173,2 169,6 139,5 164,7 227,9 293,0 г. Москва 1194,8 1402,3 1622,0 1734,4 1822,8 1827,0 2074,5 2516,6 3790,7 Таблица составлена по данным сайта: https://www.russiatourism.ru/contents/statistika/ Рост доли Москвы произошел за счет абсолют- ного притока иностранных граждан в город. При- чем, надо отметить, что с учетом других средств размещения Москву в 2017 году посетило более 4,8 миллиона иностранных туристов [1]. Нижний Новгород располагает с учетом логи- стики неплохим доступом к турпотокам Москвы. Собственный международный аэропорт (резерв- ный для столицы), 3,5-часовой железнодорожный маршрут и водный маршрут по великой русской реке Волге на круизных теплоходах позволяет вос- пользоваться сложившимся положением. Поэтому достигнутые результаты въездного потока в Ниже- городский регион, зафиксированные в 2018-2019 годах, нельзя назвать потолком роста. Ожидаемый рост спроса на рынке иностран- ного въездного туризма в Нижегородской области требует изменений в сфере предложения услуг в ре- гионе. Рассмотрим динамику предложения. Одним из важнейших факторов рынка предло- жения в индустрии гостеприимства является состо- яние гостиничного комплекса (коллективные сред- ства размещения, микропредприятия и т.п.). Нижегородская область вошла в десятку веду- щих субъектов РФ по развитию гостиничного ком- плекса, сообщили РБК-НН в региональной службе статистики [11]. По данным Нижегородстата, к концу 2018 года в регионе насчитывалось 517 кол- лективных средств размещения, 355 из которых имели общее назначение (в том числе гостиницы, меблированные комнаты и общежития для приез- жих), еще 162 — специальное (к таковым относятся санатории, санатории-профилактории, кемпинги, дома и базы отдыха). По количеству средств коллективного разме- щения Нижегородская область занимает 10 место в РФ. При этом показатель обеспеченности региона гостиничной инфраструктурой в расчете на 1 тыс. жителей по результатам 2018 года составил 368 мест, что является вторым результатом в Приволж- ском федеральном округе после Республики Татар- стан. Гостиничный комплекс региона состоит из 245 гостиниц, почти половина из которых сосредото- чена в Нижнем Новгороде, 22 мотелей и 40 хосте- лов. Большая часть объектов относится к малому бизнесу: треть средств коллективного размещения (33,9%) основаны как микропредприятия, еще 38% зарегистрированы в форме ИП. Категория от двух до пяти звезд присвоена 101 гостинице, где в общей сложности создано 4,8 тыс. номеров. Из них две гостиницы (Sheraton Nizhny Novgorod Kremlin и парк-отель «Кулибин») являются пятизвездоч- ными, 16 имеют категорию «четыре звезды», 55 — «три звезды» и 28 гостиниц — «две звезды». Основным драйвером развития комплекса сыг- рало проведение в Нижнем Новгороде этапа чемпи- оната мира по футболу в 2018 году. За минувшие пять лет в гостиничную индустрию региона было вложено более 3,3 млрд руб. (первый пик инвести- ций пришелся на 2015 год - 1,047 млрд. рублей, а второй на 2018 - 924,8 млн.). При этом, благодаря чемпионату мира доля иностранных туристов уве- личилась с 19,2% в 2017 году до 42,2% в 2018. Но стоит отметить и то, что, если по итогам года услу- гами нижегородского гостиничного комплекса вос- пользовались более 1,18 млн. человек, в том числе почти 96,7 тыс. иностранцев (8,1%), то большин- ство гостей региона (47,8% россиян и 45,7% ино- странцев) как и ранее приезжали в Нижегородскую область в рамках профессиональных и деловых по- ездок. Насколько структура предложения соответ- ствует характеру предложения судить сложно. Научные аналитические исследования данного во- проса, по всей вероятности, имеются только в рас- поряжении крупных консалтинговых фирм или маркетинговых служб гостиничных сетей. Можно отметить только некоторые экспертные оценки. Анализ гостиничного рынка по типам номер- ного фонда показывает несоответствие уровня, обеспечиваемого предпринимателями, предпочте- ниям потребителей. В существующей классифика-
  • 11. Sciences of Europe # 46, (2019) 11 ции номерного фонда обычным туристам разо- браться достаточно трудно, поэтому к ней чаще прибегают организаторы массовых поездок, коман- дированные работники. В Нижегородской области гостиничные предприятия самостоятельно выби- рают единую стратегию «компоновки» тарифов. Это различные виды номерного фонда в одной точке продаж, наличие дополнительных услуг, оплачиваемых отдельно. Ярким примером такого обслуживания является питание или предоставле- ния лечения (в санаториях). Таким образом потре- бителю оставляют право выбрать набор сервиса, который ему доступен по потребностям и бюджету. С внедрением программы целевого развития к 2018 году средняя загрузка номерного фонда вы- росла с 49 до 54%. это позволяет обеспечивать оку- паемость бизнеса (см. Таблица 3). Таблица 3 Плановая окупаемость гостиниц на 2019 год Тем не менее, гостиничный бизнес в России согласно статистике, сильно отстает от мирового уровня. И дело здесь не столько в сервисе, сколько умелом управлении. С точки зрения инвестиционной привлекатель- ности горизонты окупаемости бизнеса находятся в диапазоне от 5 до 15 лет. Несмотря на явную рента- бельность не хватающего фонда среднего класса девелоперы продолжают делать упор именно на об- новление гостиниц до высшего класса или по- стройку новых зданий, ориентируясь на тх более быструю окупаемость. При этом, в Нижнем Новго- роде часть недостроенных объектов размещения, в прошлом году пришлось перепродавать. Нижний Новгород входит в десятку самых по- сещаемых иностранными туристами городов евро- пейской России. Он уступает только Москве, Санкт-Петербургу и городам «Золотого кольца» (Владимир-Суздаль-Ярославль). К сожалению, в «TOP объектов для показа» нижегородские досто- примечательности не входят. Единственное дости- жение — в TOP-5 лучших экологических маршру- тов входят круизы по Волге. Это существенный не- достаток исправлять надо на уровне региональной власти. Отчасти в этом направлении действует крупнейщий на данный момент региональный про- ект формирования Саровско-Дивеевского кластера, на развитие которого до 2021 года планируется направить 14,3 млрд. рублей. Аналитическими агентствами часто указыва- ется на такой недостаток как отсутствие взаимодей- ствия с очевидно смежными отраслями. Пожалуй самой острой проблемой управления в индустрии гостеприимства является сезонность спроса. Пре- одоление ее возможно в рамках так называемого «событийного туризма». Создание ивент-компа- ний, которые специализируются на привлечении в регион международных конференций, празников, соревнований и проведении их — практика зару- бежного бизнеса. Сегодня создана российская Ас- социация подобных компаний. Включение в ее ра- боту с ощутимыми результатами возможно лишь при заинтересованном отношении региональных властей. Недостаток потенциала кроется и в низком уровне готовности к лавированию сервисом. К при- меру группа корпоративных туристов перед от- правлением запрашивает в месте будущего пребы- вания определенное количество номеров опреде- ленного уровня. При отсутствии предложения в полном объеме компания, обрабатывающая заявку, сможет обеспечить либо часть потребности, либо рискует совсем потерять клиента. В этом отноше- нии «звездность» гостиниц согласно сложившейся классификации имеет двойственную эффектив- ность. Туристы из одной группы, поселенные в раз- ные гостиницы одной «звездности» могут столк- нуться с заметным различием сервиса. Проблемой является и привлечение транспортных компаний для организации трансфертов, взаимодействие с
  • 12. 12 Sciences of Europe # 46, (2019) местными властями и работниками органов внут- ренних дел. Лучше дело обстоит во взаимодействии с органами культуры. Собственные лингвистиче- ский, педагогический и классический универси- теты позволяют иметь в Нижнем Новгороде квали- фицированных переводчиков, гидов, экскурсово- дов с налаженными связями с органами культуры. Хуже дело обстоит с кадрами других институтов индустрии гостеприимства. Повышения квалифи- кации имеющихся и переход к планомерной подго- товке будущих специалистов находится в стадии становления. Плюс Нижнего Новгорода в том, что за последнее время появились целый ряд отелей, представляющих международные гостиничные сети [6, С.468-473] или находящиеся под управле- нием крупных сетевых компаний. Они привносят не только новые технологии, но и могут быть базой для подготовки молодых специалистов. Все вышесказанное еще раз доказывает, что индустрия гостеприимства работает идеально в со- стоянии симбиоза всех элементов комплекса. Литература 1. Сайт Investmoscow.ru - Инвестиционный портал города Москвы // https://investmoscow.ru/investment/priority- sectors/tourism/ 2. Сайт Турпром // www.tourprom.ru/news/39242/ 3. Сайт ТурСтат// http://turstat.com/inboundtravelrussia9month2018 4. Сайт Федерального Агентства по туризму. МЭР РФ// https://www.russiatourism.ru/contents/statistika/ 5. Сайт «Мир без границ»// http://www.visit- russia.ru/rossiysko-kitayskiy-turizm/statistika 6. Ефремова М.В., Богатырева Л.Г. Анализ финансово-экономических показателей в гостиничном менеджменте// Инновационная экономика: глобальные и региональные тренды. Материалы XI Межународной научно- практической конференции (Нижний Новгород. 31 мая-1 июня 2019 г.) - Нижний новгород. ННГУ им. Н.И.Лобачевского, 2019. - С.468-473. 7. Вестник АТОР / Иностранный турпоток в Россию вырос на 25%. 12.08.2019 https://www.atorus.ru/news/press- centre/new/48103.html 8. ТАСС / 12 АВГ, 12:05. 13:38 / Въездной турпоток в Россию в первом полугодии 2019 года вырос на 25% // https://tass.ru/obschestvo/6754844 9. Сайт ОТДЫХ В РОССИИ / ТОП-30 стран по числу въездных туристских поездок их граждан в Россию за 1-ое полугодие 2019 года. 15.11.2019 / http://rustur.ru/top-30-stran-po-chislu-vezdnyx- turistskix-poezdok-ix-grazhdan-v-rossiyu-za-1-oe- polugodie-2019-goda 10. Сайт NEWSNN.RU / В Нижегородской области номерной гостиничный фонд за пять лет вырос вдвое. 10 сентября 2018, 14:03 Екатерина Чичурина. https://newsnn.ru/news/society/10-09- 2018/v-nizhegorodskoy-oblasti-nomernoy- gostinichnyy-fond-za-pyat-let-vyros-vdvoe 11. РБК. НН // Нижегородская область вошла в топ-10 регионов по развитию гостиниц/ Н.Новгород, 17 июля, 15:04 https://nn.rbc.ru/nn/freenews/5d2efe5e9a79477765169 c74?from=regional_newsfeed 12. Сайт АльтераИнвест // Анализ рынка гостиниц 2018. Варламов Ринат. Эксперт по маркетингу. 19.07.2018 https://alterainvest.ru/rus/blogi/analiz-rynka-gostinits- 2018/ ОПЕРАЦИОННЫЙ МЕНЕДЖМЕНТ: ПРАКТИКА МАЛЫХ ПРОИЗВОДСТВЕННЫХ ПРЕДПРИЯТИЙ Аксенов В.А. к.и.н., доцент Нижегородский государственный университет им. Н.И. Лобачевского Нижний Новгород OPERATIONAL MANAGEMENT: THE PRACTICE OF SMALL MANUFACTURING ENTERPRISES Aksenov V. associate Professor Nizhny Novgorod state University. N. Lobachevsky АННОТАЦИЯ В последнее время в научно-практической литературе появляется все больше концепций и подходов, связываемых с операционным менеджментом. На взгляд автора, это отражает какую-то тенденцию в раз- витии практики управления. Он пытается представить свой взгляд на это явление. ABSTRACT Recently, more and more concepts and approaches related to operational management have appeared in the scientific and practical literature. In the author's opinion, this reflects some trend in the development of manage- ment practice. He tries to present his view on this phenomenon. Ключевые слова: операционный менеджмент, стратегия операционного менеджмента, бережливое производство, бизнес-процесс.
  • 13. Sciences of Europe # 46, (2019) 13 Keywords: operational management, lean production (lean manufacturing, lean production), business-pro- cess. В последнее время в научно-практической ли- тературе появляется все больше концепций и под- ходов, связываемых с операционным менеджмен- том. Это и «Бережливое производство» (Lean man- ufacturing, Lean production), и системы Канбан, Кайдзен, и TPM (Total Productive Maintenance), и JIT (Just-In-Time) [13]. На наш взгляд, это отражает какую-то тенденцию в развитии практики управле- ния. Попытаемся представить наш взгляд на это яв- ление. Понятие операционного менеджмента появи- лось в период становления классических концеп- ций и связано было с именами Тейлора, Файоля [1,C.168-171]. Первоначально оно подразумевало, прежде всего, управление производством, техноло- гическими операциями. Организационно-техноло- гический уровень считался низшим уровнем «пира- миды» управления организацией (см.: Рис. 1). Рисунок 1 – Иерархия уровней управления организацией При этом, в качестве основного инструмента операционного менеджмента рассматривалось управленческое решение. Менеджер низшего уровня, в соответствие с заданиями, которые полу- чал «сверху», обязан был координировать техноло- гический процесс, не допуская отклонений от за- данных параметров, решая возникавшие проблемы. В самом общем виде «управление по отклоне- ниям», можно представить следующим образом (см. Рис. 2). Рисунок 2 – Процесс управления на основе принятия управленческих решений Естественно, методами операционного менеджмента считались, прежде всего, следующие методы (см.: Рис. 3).
  • 14. 14 Sciences of Europe # 46, (2019) Рисунок 3 – Методы операционного менеджмента В современных условиях понятие операцион- ного менеджмента расширяется. Уход от иерархи- ческих структур к гибким, матричным, проектным, сетевым приводит к постановке в центр внимания не объектов, участков, цехов, а бизнес-процессов. Сквозные сети, связывающие все объекты процес- сом удовлетворения клиентов, потребителей, при- водят к расширению сферы внимания менеджера низшего уровня. Кроме координации технологиче- ских операций его начинают все более беспокоить по вопросам экономическим (себестоимость, каль- куляция затрат времени и ресурсов, т.п.). Операци- онный менеджмент вторгается в более высокую сферу (уровень) тактики и даже стратегии. Появля- ется даже подход к формулировке стратегии опера- тивного менеджмента. Причиной данной тенден- ции, на наш взгляд, является не только ускорение НТП, развитие инновационных процессов, но и рост образованности специалистов, квалификации, их психологической готовности к такой работе. То есть, не только объективно нужен такой подход, но и субъективно он возможен. Рассмотрим достаточно интересный, на наш взгляд, пример из практики малого производствен- ного предприятия. ООО «Аргон – РС», расположенное в Нижего- родской области поставляет свою продукцию на ряд крупных машиностроительных предприятий разных регионов России. Заказы идут в рамках дол- госрочных Договоров постоянно два или три раза в квартал. Оплата производится по факту приемки товара. Кроме достаточно крупных заказов есть и мелкие, средние заказы. Структура предприятия включает коммерческий отдел, который занимается приемом заказов, определением цены и контролем, сопровождением выполнения заказов, отдел произ- водства с несколькими участками (резки, гибки, сварки) и склад сырья, материалов, комплектую- щих и готовых изделий (см. Рис. 4). Рисунок 4 — Структура предприятия «Аргон»
  • 15. Sciences of Europe # 46, (2019) 15 Бизнес-процессы носят в «Аргоне» достаточно стабильный, стандартный характер по крупным за- казам. Цена, себестоимость заказчикам в целом по- нятна и не вызывает замечаний. Однако, на первом этапе сотрудничества с крупными партнерами у «Аргона» периодически возникали не очень понятные проблемы. Дело в том, что доставка заказанного товара, продукции осуществлялась либо сторонними транспортными фирмами, либо самими заказчиками, получате- лями, потребителями. Сложность состояла в том, что заказчик, получатель и потребитель продукции не во всех случаях являлись одним и тем же юриди- ческим лицом. Так, для группы «ГАЗ» закупала ма- териалы и комплектующие специальная фирма, входящая в группу, «ТЗК». Доставка осуществля- лась на ответственное хранение на консигнацион- ный склад и отпускалась в производство подразде- ления дивизиона «Автобусы» по мере необходимо- сти по Заявкам. В момент списания осуществлялась приемка товара ООО «Аргон» по качеству и коли- честву. Периодически возникал вопрос либо о недостаче, либо о несоответствии по качеству. Ди- ректор, ООО «Аргон» должен был выезжать, полу- чая претензионные письма. Как правило, доказать ничего не удавалось и приходилось либо дополни- тельно поставлять товар, либо делать возврат де- нежных средств. Директор, как правило, просил комплектовщиков увеличивать количество единиц продукции в упаковке («на всякий случай») и за счет наценки формировал фонд наличных денеж- ных средств для разрешения конфликта в случае выезда к потребителю. В процессе внедрения информационных тех- нологий было решено внести изменения в процесс отгрузки товара со склада ООО «Аргон». Специ- ально была оборудована видеоаппаратурой специ- альная зона, где осуществляли упаковку и ком- плектацию продукции. Видеозапись с шести точек позволяла на видео-файл записать все действия со- трудников, занимавшихся комплектацией, упаков- кой и отгрузкой продукции. Видео-запись фиксиро- вала детально постоянное участие представителя заказчика в процессе отгрузки и его ответ на вопрос о наличии претензий и замечаний к сотрудникам «Аргона». Видеозапись в режиме реального вре- мени фиксируется в облаке ООО «Аргон». Флеш- карта передается в завершение представителю за- казчика, который подписывает Акт приема ее2 . В результате реорганизации часть ответствен- ности перекладывается на предприятие-заказчика товара, оно вовлекается в процесс учета и контроля товара, поставляемого ООО «Аргон», повышается 2 - Акт приемки товара подписывался представителями потребителя и заказчика без участия транспортировщика и производителя (ООО «Аргон») 3 - затраты на оборудование зоны отгрузки видеооборудованием (а также освещение, флэш-карты и аренда Облака, т.п.) сопровождались некоторым снижением резервных единиц продукции в упаковках, уменьшением командировок руководителя (кроме производств Группы «ГАЗ» в других городах, можно заинтересованность в деле выяснения причин от- клонения исполненного заказа от условий Дого- вора. Таким образом, в результате принятых и реа- лизованных решений были снижены текущие рас- ходы ООО «Аргон»3 , удалось поднять престиж фирмы в глазах и заказчика, и потребителя, снизить риск роста претензий и «выживания» с рынка по- ставщиков крупной компании (Группы «ГАЗ»)4 . При этом, заказчику были снижены цены на выпол- нение работ после получения от руководства Письма-Благодарности за вклад в оптимизацию бизнес-процессов компаний Группы. Надо сказать, что поиск новых путей в разви- тии операционного, да и всего менеджмента, на наш взгляд, быстрее всего идет в предприятиях ма- лого бизнеса. Несмотря на малую долю, эти пред- приятия накапливают критическую массу компе- тенций, квалификации и инновационного потенци- ала, который может вызвать в определенный период качественный прорыв в развитии эконо- мики (и в ее структуре, и в темпах роста). Пока же положение в целом не такое как хотелось бы руко- водству страны. В РФ инновационная активность малых предприятий низка. В промышленности невелика доля продукции пятого технологического уклада (электроника, оптико-волоконная техника, про- граммно-математическое обеспечение, телекомму- никации, роботостроение), доминируют изделия четвертого и третьего укладов (автомобилестро- ение, электротехническое машиностроение, т.д.). Авто и иные сервисы, заправки, стоянки необхо- димы, но они связаны с накоплением капитала, а не с инвестициями в инновации. В ведущих странах мира производительность техники с применением систем интеллектуализации производства выше, чем обычного универсального оборудования в де- сятки раз. По ряду регионов инновационно-актив- ных предприятий насчитывается не более 5%, хотя в расчете на рубль затрат инновации и в РФ обес- печивает объемы производства в 7-8 раз больше, чем при традиционных технологиях. Опросы гово- рят, что даже при инновациях в 2010-2018 гг. глав- ным целевым показателем было обеспечение мак- симально быстрой отдачи вложенных средств. Поэтому около половины затрат были связаны с приобретением оборудования, необходимого для освоения продуктовых и технологических иннова- ций. К этому надо еще добавить расходы на техно- логическую подготовку производства, что состав- ляет еще 10-15% затрат на нововведения [данные подобраны из указанных источников и экспертных оценок]. Исследования и разработки занимают говорить о приблизительно похожих подобных результатах в г. Ростове и г. Бор Нижегородской области) и выплат компенсаций. 4 - среди возможных причин можно предположить конкуренцию внутри компаний - покупателей, с другими предприятиями, поставляющими подобную продукцию этим покупателям, обычные хищения низшего или среднего персонала компаний покупателей и заказчиков и ряд других вариантов.
  • 16. 16 Sciences of Europe # 46, (2019) скромную долю (около 10%), преимущественно ориентируясь на конечные этапы инновационного цикла, то есть доработку, коммерциализацию уже имеющихся научных разработок. Принято выделять две группы отраслей, в од- ной из которых преобладают процессные иннова- ции. Это топливная, химическая и нефтехимиче- ская промышленность, металлообработка, лесной комплекс и пищевая промышленность. Тут иннова- ционные технологии обеспечивают снижение мате- риальных затрат, переработку отходов крупных производственных компаний. Здесь в основном выше интенсивность экспорта и эффективнее инно- вации. Вторая группа — это отрасли, где домини- руют продуктовые инновации. Это машинострое- ние, промышленность строительных материалов, легкая и медицинская промышленность, в которых значительную роль играют повышение качества, расширение ассортимента продукции и снижение зависимости от импортного сырья, материалов и полуфабрикатов. Инноваций здесь стало больше после введения санкций, но эффективность, в ос- новном, ниже, чем в первой группе отраслей. Тут период от разработок новой (особенно принципи- ально новой) продукции до освоения ее, если ори- ентироваться на отечественную производственную базу, достаточно большой. Без взаимодействия с крупным бизнесом и государственными предприя- тиями (РОСТЕХ, ОАК) практически невозможна и нецелесообразна, за исключением тех видов про- дукции, выпуск которых связан с существующим оборудованием и не требует создания новых техно- логических процессов и аппаратов. Соотношение продуктовых и процессных инноваций приблизи- тельно 50% на 50%. А вот затраты на маркетинг у малых инновационных предприятий в целом очень низка (1-5%). Еще меньше затраты на персонал. В обучение для работы по новым технологиям вкла- дывается до 0,6%. Прежде всего, здесь сказываются слабая новизна и наукоемкость инноваций. Санкции усугубили положение инновацион- ной сферы малых предприятий, как наименее кон- курентоспособного субъекта инвестиционного рынка. В условиях резкого увеличения инвестиций от государства на инновации государственная под- держка через национальные проекты идет по крупным, системным инновациям. Но оборачивае- мость вложенных средств здесь имеет свои гра- ницы. Наибольший эффект тут возможен в малом и среднем бизнесе, особенно в некапиталоемких от- раслях с быстрым оборотом капитала, высокой эф- фективностью и минимальной стоимостью созда- ния новых рабочих мест, за счет освоения научных заделов. Это требует только одного, чтобы пред- приниматели, заработанные средства хотели тра- тить не только на личное потребление, но и на ин- вестиции в инновации, на их качественное обнов- ление. Литература 1. Анисимов В.В. От Фредерика Тейлора до системы «Бережливое производство» // Современные проблемы теории машин. 2016. №4- 1. С. 168-171. 2. Бухалков М.И., Кузьмин М.А., Применение норм труда в совершенствовании оперативного планирования бережливого производства // Нормирование и оплата труда в промышленности. 2019. №1. С.15-25. 3. Балашова Е.С., Громова Е.А. Оценка результатов внедрения российскими компаниями концепции бережливого производства // Известия Юго-Западного государственного университета. Серия: Экономика. Социология. Менеджмент. 2015. № 2 (15) С. 37-43. 4. Бережливое производство: итоги и задачи // Железнодорожный транспорт. 2919. №2. С.70-74. 5. Кондратьев Э. Взгляд на управленческие патологии через призму бережливого производства // Проблемы теории и практики управления. 2015. №3. С. 109-118. 6. Кокарева В.В., Смелов В.Г., Шитарев И.Л. Имитационное моделирование производственных процессов в рамках концепции «бережливого производства» // Вестник Самарского государственного аэрокосмического университета им. Академика С.П.Королева (НИУ). 2012. №3-5 (34). С. 131-136. 7. Корнева М.С., Хомякова А.А. Совершенствование системы управления производством на основе внедрения концепции «бережливого производства» //Сборник научных трудов вузов России «Проблемы экономики, финансов и управления производством». 2016. №39. С. 73-81. 8. Кравченко Е.В. Сравнительная оценка современных концепций управления: методический аспект // Методы менеджмента качества. 2015. №9. С. 4-8. 9. Медведева В.Р., Коренков М.М. Формирование эффективной системы управления наукоемким производством через призму концепции «бережливое производство» (На примере ПАО «Казаньоргсинтез») // Управление устойчивым развитием. 2017Ю №3 (10). С.31-44. 10. Митыпова Н.В., Шарапова С.М. Повышение эффективности управления производственным процессом на основе концепции бережливого производства / Известия Тульского государственного университета. Технические науки. 2015. №8-2. С.100-109. 11. Шибанов К.С. Исследование особенностей технологии бережливого производства // Экономика и предпринимательство. 2019. №1 (102). С. 1045-1049. 12. Шибанов К.С. Проблемы внедрения «бережливого производства» на отечественных предприятиях // Экономика в промышленности. 2017. Т.10. №4. С.335-343. 13. Practicum.Group / Категория: Менеджмент, Статьи. https://practicum- group.com/blogs/stati/metodika-berezhlivogo- proizvodstva/
  • 17. Sciences of Europe # 46, (2019) 17 MODELS OF AGRICULTURE EXPORT CAPACITY DEVELOPMENT Karasova N. Doctor of Economics, Associate Professor Kyiv National University of Culture and Arts, Ukraine ORCID:0000-0002-8471-3870 ABSTRACT Export-oriented capacity building depends on the country’s advance in economically efficient exchange, which is based on proper definition of priorities of the general agricultural policy and adequate concentration of regulatory instruments and resources in strategic directions. The objective of this article is to study the types of the agriculturе export-oriented models and to determine the specific features of regulatory policies of the leading countries for further use of the bast practices. The article analyses the conceptual approaches to regulation of social and economic relations in the agricultural sector across the world, classifies export-oriented models of the agricul- tural sector, and studies the models that ensures permanent growth of export of products (services) specific to the Latin American countries as well as steady export in the EU countries. Keywords: export-oriented model, agricultural sector, agricultural policy, steady growth, state support. JEL classification: Q17, F15. 1. Introduction. Open economy treats export an instrument to ensure the extended market space for re- structured branches and productions capable of inten- sive international competition. Export-oriented capac- ity building, dynamisation of economic growth in the agricultural sector, improvement of well-being and life quality of population today depend on the country’s ad- vance in economically efficient exchange, which is based on proper definition of priorities of the general agricultural policy and adequate concentration of regu- latory instruments and resources in strategic directions. Therefore, the study of bast practices of the leading countries in creating and building export potential is currently relevant. Global best practices in development and imple- mentation of the agricultural policies in order to imple- ment their positive aspects in Ukraine has been studied by a number of researchers such as O. M. Bubliienko, I. V. Klymenko, B. M. Kryvoruk, Yu. O. Ulianchenko, N. O. Shevchenko, N. V. Shybaieva, T. M. Kviatko, V. H., Kremin, and others. These researchers have studied specific features of the agricultural policies of the EU, the US and Canada. Some researchers such as I. M. Kulish and O. I. Tkach studied development of agricul- ture regulatory policies of the Latin American coun- tries. The studies cover numerous aspects of state sup- port of the industry. Fewer works study export support programs. Therefore, the objective of the article is to study the types of the agricultural sector’s export-ori- ented models to determine the specific features of reg- ulatory policies of the leading countries for further use of the best practices in Ukraine. Presentation of Basic Materials. The analysis of conceptual approaches to regulation of social and eco- nomic relations in the agriculture of different countries allows to distinguish the following two types of the ag- ricultural policies: - Product agricultural policies, which ensure high productivity, efficiency, intensity and steady export ca- pability of the industry. This type of agricultural poli- cies is common in the most OECD countries, in partic- ular the EU countries and the US, as well as specific to some countries of Asia, Northern and Southern Amer- ica, Among them, the most outstanding results and leadership in the world market were reached by China, Brazil, Argentina and the Philippines. As evidenced by the study materials, success in development of the ag- ricultural sector of these countries is associated with and depends directly on significant capital investments and support from the state [1; 6]; - Consumer agricultural policy characterized with low productivity, efficiency and intensity. This type of agricultural policy is common in many developing countries, and outputs of the agricultural sector in these countries are mostly used for domestic consumption. The study of the agricultural policies of the first type is relevant for scientific justification and imple- mentation of the model of development in the develop- ing countries, which seek to gain a foothold in the global agriculture and food market, while the task of developing and building the agricultural sector’s export potential must be centred around the general agriculture and food policies of the state and comply with their principles. The studies lack systematization of the agricul- tural sector’s export-orienter models; however, scien- tific materials [3; 5; 7; 8; 15] and analytical data [10] reveal the following two main types of export-oriented models: the model that ensures permanent growth of export of the agricultural sector’s products (services) used in the Latin American countries as well as the model that ensures steady export specific to the EU countries. The first model is focused on increasing product competitiveness and export as well as sales market ex- pansion. The advantages of export-oriented develop- ment of the agricultural sectors of the US, Brazil, Ar- gentina, Columbia and other countries include the land and labour resources as well as the management sys- tem. The state policies in this case are aimed at stimu- lation of development of large-scale export-oriented agricultural productions. In view of steady increase in export volumes, the governments chose the consoli- dated sector governance system, which had been devel- oping for many years. For instance, in the US, 70% of export products account for 14% of large-scale agricul- tural households. In Brazil and Argentina, around 80% of all the cultivated lands are occupied with large lati- fundia accounting for almost all the export crop prod- ucts. The leadership of the US in the global agriculture and food market is ensured both by resources and ef- fective state support, the main instruments of which are the price control and the export programs. The farm in- come is maintained at the level of income of workers in other economy sectors by stabilisation of prices for ag- ricultural products and reduction of non-distributed stocks. As evidences by the study materials [1; 2; 13; 14], the US provides federal subsidies in case of reduction of market prices to agricultural products below the guaranteed level. A special government organisation takes products in pledge from producers at guaranteed prices, and in case the market price exceeds the pledge rate, the producer takes its commodities out of pledge and sells them in the market. If the prices are lower than
  • 18. 18 Sciences of Europe # 46, (2019) the pledge rates, the commodities are kept by the gov- ernment organisation. This way, the US, which is the biggest exporter of agricultural products, supports its domestic producers through maintaining the price range which allows the domestic producers to benefit from the conditions and the state to control the level of world prices. At the same time, the US neither regulates nor subsidises the prices for agricultural resources and the interest rate provided under the state agricultural credit programs. This allows to keep prices balanced (key characteristics of the American agricultural pol- icy) and to avoid creating preconditions to compensate farmers for the capital goods acquisition. On the other hand, the government helps farmers establish coopera- tives for purchase and, in some cases, production of ag- ricultural machinery and equipment. According to the Food Security Act of 1985, the US Government also initiated the application of direct export subsidies, which was caused by the pressure of the subsidised products from Europe rather than inter- nal factors (increase in grain stocks and, consequently, the negative impact of overvalued dollar and commod- ity credit rates). Such programs provide for payment of cash bonuses to exporters upon delivery of commodi- ties to the countries and within the scope established by the Foreign Agricultural Service. These payments al- lowed the American farmers to sell agricultural prod- ucts in the external market at a price below total pro- duction costs. For the purpose of fulfilment of obliga- tions to the WTO, the subsidies were partially eliminated in 2011 and 2013. However, according to the WTO [18], 13 export subsidy (XS) programs aimed at support of competitiveness of certain types of dairy products, eggs, meat (pork, chicken, beef), oil, rice, and wheat are still in effect in the US today. Moreover, the US offers the export credit guaran- tee programs, with the first ones being introduced under the Agricultural Trade Act in 1978, to facilitate financ- ing of operations related to export and increase in pro- duction volumes [13; 14]. To date, there are two pro- grams of this category, including: - Export Credit Guarantee Program (GSM-102). The US Commodity Credit Corporation (ССС) pro- vides guarantees for export credits issued by private banks using the irrevocable dollar letter of credit for purchase of the American agricultural products and supplies by the importer; - Facility Guarantee Program (FGP) for export credits to establish the agricultural infrastructure. The program is aimed at expansion of export of agricultural products to the developing countries. The program in- volves provision of guarantees for export credits for supply of goods and services produced in the US, which are aimed to provide the exporter with the required in- frastructure, such as storage facilities, refrigeration equipment, etc. This program requires the importer to provide an obligatory initial payment amounting to 15% of the export delivery cost. Further payments are made semi-annually for 1 to 10 years. The FGP guar- antee covers 95% of the principal loan and interest amount. Various direct payments and state support of farm- ers are crucial for development of the agricultural sec- tor’s export in the US. Particularly, the budgetary sub- sidies include a set of reforms, such as compensation payments under the programs of livestock reduction and change of cropping structure; subsidising of invest- ments for consolidation of agricultural productions; payments to agricultural commodity producers per unit of area or head of livestock; reimbursement of expenses on water supply, irrigation, gasification; various com- pensations and tax allowances (turnover tax), etc. The measures of general state support of the sector aimed at structural changes include [9; 13; 14] the fol- lowing: 1) Agricultural crediting; 2) Scientific support of the agricultural sector development. There are pro- grams aimed at increase of efficiency of agricultural production through development of agricultural science and education; 3) Infrastructure development. Farms in rural areas are supported with loans, grants as well as housing construction, powering, water treatment loan guarantees. The Rural Development implements its programs through the extensive network of representa- tive offices that includes 47 regional (state level) and 450 local offices; 4) Environmental measures. A num- ber of technical support programs are aimed at protec- tion and preservation of the national natural heritage and environment. For instance, in 2013, the land con- servation programs covered 358 million ha of the US lands, and the total conservation budget was USD 6.2 billion. Thus, in spite of strategic goals for increasing ex- port volumes, the US agricultural policy is also aimed at development of rural areas, preserving small farms and providing them with equitable access to production resources, as well ensuring low footprint of farming. With their agricultural sector being strongly ex- port-oriented, the Latin American policies are some- what different from the US policies due to numerous factors. The financial support is a major tool for inten- sifying agricultural production, adapting agriculture to the capital accumulation needs and increasing export potential in these countries. In particular, the first step in Brazil was the creation of the national rural crediting system (Sistema Nacional de Crédito Rural). The sys- tem had given rise to changes in Brazil’s agriculture. The use of new technologies and advanced materials was encouraged. Subsidies for agricultural production stimulated increase in demand for agricultural equip- ment and supplies, which, in its turn, contributed to in- creased employment in agriculture [3]. To date, Brazil also has 16 programs of direct export subsidies for ag- ricultural and food commodities. The main beneficiar- ies of state support programs were medium and large- scale agro-industrial producers, who received large grants and loans, with small businesses also benefiting in some ways [11]. However, in view of the number of economic crises that the Latin American countries have faced, the main goal of state policies was to achieve full capacities of rural areas and reorient traditional agricul- ture with focus on monoculture cultivation based on global exports. This policy was particularly large- scaled in Argentina, where mass cultivation of genet- ically modified organisms (primarily soybeans) was launched, and millions of hectares of the agricultural heartland have been bought up by banks and then fur- ther sold to foreign corporations and private investors. Apart from the seed itself, the chemicals for growth and pest control were actively used, which negatively af- fected the environment. The state’s unsound interfer- ence with agricultural production, driven by global trends and desire to maximize benefits of the industry’s export potential, resulted in structural transformations in Argentina, which put numerous production lines at threat of disappearance and could lead to the loss of food self-sufficiency. Another model to ensure sustainable export of the agricultural sector’s products has been implemented in the EU countries. It is developed on the platform of the socially-oriented market economy and within the framework of the Common Agricultural Policy of the EU (CAP), which aims to ensure multifunctionality, sustainable development and high competitiveness of agriculture. The main principles of the CAP are the in- crease in productivity of the agricultural sector by pro- moting technological progress; ensuring optimal use of