SlideShare a Scribd company logo
1 of 51
Download to read offline
High-Value Work and the Rise of Women:
The Cotton Revolution and Gender Equality in China*
Melanie Meng Xue„
Northwestern University
December 2018
Abstract
This paper studies a unique historical experiment: the cotton revolution and its
impact on the emergence of gender-equitable beliefs. The cotton revolution led to
a prolonged phase (1300-1840 AD) of high productivity for women. I hypothesize
that a substantial, long-standing increase in relative female income can erode a
highly resilient cultural belief: women are less capable than men. Using variation
across 1,489 counties in cotton spinning and weaving, I first show that the cotton
revolution reduced prenatal sex selection in 2000. This result is complemented by
survey evidence on gender-equitable beliefs and robust to instrumenting cotton
weaving with the range of relative humidity within which cotton yarn can be
smoothly woven into cloth. I then document an initial impact of the cotton
revolution on widow suicides in the 17th century. To further isolate the channel
of gender-equitable beliefs, I estimate the effects of the cotton revolution under
post-1949 state socialism, where both genders had similar economic opportunities,
political and legal rights, and show that pre-1840 cotton weaving predicts a higher
probability for the wife to head the household. In addition, I find that high-value
work has a distinctive role in shaping gender-equitable beliefs. Low-value work
performed by women, such as cotton cultivation, does not correct prenatal sex
selection.
Keywords: Culture, relative female income, gender-equitable beliefs
JEL Codes: Z1 N35 J16 I1
*I thank Paula Giuliano and Joel Mokyr for their detailed comments and feedback. I also thank Douglas
Almond, Matteo Cervellati, David de la Croix, Carl-Johan Dalgaard, Christian Dippel, Matthias Doepke,
Lena Edlund, James Fenske, Raquel Fern´andez, Oded Galor, Claudia Goldin, Pauline Grosjean, Seema Jay-
achandran, Peter Sandholt Jensen, Saumitra Jha, Mark Koyama, James Kung, John Nye, Jessica Pan, Nancy
Qian, Thomas Rawski, Paul Seabright, Chris Udry, Bin Wong, Nico Voigtl¨ander, seminar and workshop
participants at Arizona, Barcelona GSE Summer Forum, Bologna, Brown, Chapman, Copenhagen, “Deep
Causes of Economic Development” (Utrecht), Northwestern, SUFE, Toulouse IAST, UC Davis, UCLA An-
derson Brown Bag, UCLouvain, UNSW and audiences at ASREC, ASSA, Cliometrics Society, EHA, EHS,
Institutional Analysis Workshop, NASMES, NEUDC, PacDev, WADES and WEHC. I acknowledge financial
support from Donorstrust, the Balzan Foundation and the Center for Economic History at Northwestern. An
earlier version of the paper is entitled “Textiles and the Historical Emergence of Gender Equality in China”.
„Postdoctoral Fellow, Department of Economics, Northwestern University. 2211 Campus Drive, Evanston,
IL 60208. Email: melanie.xue@northwestern.edu. Website: http://www.melaniexue.net/
I Introduction
Gender equality is usually viewed as a modern phenomenon. Economists have proposed
several explanations for the expansion of economic and political rights for women in the past
200 years (Doepke and Tertilt, 2009; Doepke, Tertilt, and Voena, 2012; Fern´andez-Villaverde,
Greenwood, and Guner, 2014). In this paper, I provide an alternative account of the rise of
women by examining a unique historical experiment: the cotton revolution in the phase of
proto-industrialization of China—a phase during which the productivity of women increased
substantially and remained high relative to that of men. By examining the impact of this
gender-asymmetric productivity revolution, this paper highlights the role of female labor
productivity in the emergence of gender-equitable beliefs and its subsequent effect on gender
equality.
A key component of the cotton revolution was a one-time technological breakthrough in
cotton textile production that took place after 1300 AD, the introduction of the multiple
treadle-operated spindle-wheels. This device roughly doubled or tripled the productivity of
female spinning operatives. By solving a crucial bottleneck in the production, in the area of
spinning, the use of multiple treadle-operated spindle-wheels made weavers more productive.
This breakthrough occurred in the context of a market economy and trading network and in
the presence of political institutions that ensured that relative female income remained high
for more than 500 years. In areas suitable for the spinning and weaving of cotton, women’s
labor productivity far exceeded that in traditional agrarian societies.
In reference to this cotton revolution, the historian of Chinese science, Joseph Needham
noted that: “For more than 450 years Chinese cotton-spinning technology was therefore
superior to the spinning methods used in any other country (Needham and Kuhn, 1988,
p. 224). The cotton revolution was a substantial shock to the economic value of women’s
work. The adoption of new spinning and weaving technologies led to production surpluses,
which served as a basis for market exchange on a large scale. During this period, China
accounted for one-third of the world’s population and between one-third and one-half of global
GDP, and had a relatively well-integrated national and regional market economy (Shiue and
Keller, 2007). By 1840, cotton textiles accounted for 24.4% of the domestic trade.1
Before 1300, women spun and wove, but they worked with fabrics sourced from plants
with lower average yields per unit of land and used less productive technologies. They also
spent time in agricultural fields, but their productivity in the field was lower than that
of men. Between 1300 and 1840, after which date mechanized cotton textiles flooded into
1
Table A.XVII shows a breakdown of trading goods just before 1840. As much as 94,553,000 tael worth
of cotton textiles were traded, second only to that of grain.
1
China, women produced cotton textiles at home, and sold them to local, regional and national
markets. This resulted in a “Golden Age” for female incomes. Women worked together with
extended family groups and as in many traditional societies, weaving skills, along with the
loom, were passed down across generations (Buckley and Boudot, 2017).
Compared with other episodes of expansion of labor market opportunities for women,
and in other parts of the world, the significance of the cotton revolution is that it boosted
women’s incomes to a level comparable to or greater than those of their husbands.2
The
ability to produce cotton textiles enabled women to become the major household income
earners (B. Li, 1997).
Anthropologist Marvin Harris postulates that male dominance was initially determined
by male strength and their comparative advantage in warfare. Thus as warfare was taken
over by professionals, inequalities between men and women became a matter of their relative
contributions to economic production (Harris, 1993). In imperial China, when the cotton
revolution took place around 1300 AD, it dramatically increased women’s contribution to
economic production, providing an ideal context for an empirical examination of this claim. I
formulate the hypothesis that the tradition of holding men more highly than women is deeply
rooted in women’s relatively low contribution to economic production in the past. Society
is used to assigning different values to different genders, and in many civilizations, there has
been the perception that women are less capable than men and a culturally-determined belief
that females are less valuable. I hypothesize that when women’s contribution to economic
production becomes close to or above that of men, gender-equitable beliefs will emerge.
To estimate the effects of the cotton revolution on gender inequality, I collect information
about cotton textile production from county and prefecture gazetteers. Information available
in those gazetteers allow me to construct a binary variable of cotton textiles at a county level
for the period of 1300 to 1840. My main sample comprises a total of 1,489 counties. I link this
data to my main outcome variable: sex ratio at birth, a revealed preference measure of cultural
beliefs about women’s worth. Examining variation across counties, I find a strong negative
relationship between the cotton revolution and the skewdness of the sex ratio at birth. The
baseline estimates suggest that the cotton revolution is associated with a reduction of 3.7
boys per 100 girls in sex ratio at birth, or a quarter of its standard deviation.
To ensure that my results are not driven by systematic differences between counties with
and without cotton textiles (1300-1840), I use matched samples, cluster standard errors on
different geographic units, address biases in gazetteer data, employ different subsamples and
account for historical and modern confounders. I then check three different hypotheses raised
2
An optimistic estimate in Pomeranz’s 2002 work suggests that a woman who weaved could earn four
times as much as does an unskilled male laborer.
2
in previous work: plough agriculture, the Neolithic Revolution and loamy soil as determinants
of gender inequality. Finally, I include one of the most stringent controls—language fixed
effects—to only use variation within populations speaking the same language.3
Members
of the same ethnic group, if exposed to the cotton revolution, would more likely develop
gender-equitable beliefs.
China experienced a series of political and economic shocks in the past two centuries.
Many of those shocks had a profound impact on the economy and on society. I account for
these intermediating events and their interactions with cotton textile production in my anal-
ysis. Reassuringly, neither early industrialization, missionary activities, nor recent economic
liberalization can explain away the effects of the cotton revolution.
To establish causality, I instrument cotton textile production with a relative humidity
index pertaining to weaving suitability. Relative humidity (%) played a key role in the
production of cotton textiles. For the successful manufacture of cotton textiles, the fibers
must contain a suitable amount of moisture. Based on several sources, the range of relative
humidity suitable for cotton weaving is between 60% and 85%.4
Within this range, tensile
strength increases in relative humidity (Lewis, 1913; Iqbal et al., 2012). The spinning and
weaving of cotton, silk, hemp, wool and synthetics vary in their humidity requirements.
Scientists and engineers have studied optimal humidity for each fabric (Stamper and Koral,
1979; Ananthanarayanan, 2013; Kut, 2014). I take the distance between actual and optimal
humidity at a monthly level, and aggregate those values over months to build a Humidity-for-
Weaving Index. Because relative humidity might affect conditions faced by women through
other channels, I use the interaction between the Humidity-for-Weaving Index and distance
to the center of national market as a second instrument to create a more exogenous source of
variation. In both cases, IV estimates are comparable to the OLS estimates, with the second
instrument providing an estimate closer to my OLS estimates, offering further assurance that
the effects I find are causal.
In tracing the mechanisms, I first establish that there was an initial impact of the cotton
revolution on women. Using data collected from historical gazetteers, I find evidence that
cotton textile production prevented widow suicide in the Ming Dynasty (1368-1644). One
interpretation of the results is that women who were able to survive on their own incomes
coped better with widowhood than did those who relied on their husband for their livelihood.
Widows who were weavers maintained a decent standard of living and were highly respectable
in their communities. Compared to widows elsewhere in the world, who were often isolated
3
Language fixed effects can also be included in other specifications. All the results carry through.
4
A humid climate makes cotton fibers more pliable, lowers the chance of breakages in the yarn and reduces
dust in the air (Lewis, 1913; Lander, 1914; Farnie, 1979; Ananthanarayanan, 2013).
3
and subject to assault and persecution, widows in parts of China were self-sufficient and
economically independent.
I subsequently examine gender inequality after 1840 to provide further evidence on the
cultural transformation brought about by the cotton revolution. I find that in early 20th
century China, a higher share of industrial workers were female in places where there used to
be cotton textile production, and that under state socialism, which leveled the playing ground
for men and women both politically and economically, the probability of a wife heading the
household was higher in places positively impacted by the cotton revolution.
This paper aims to understand the emergence of gender-equitable beliefs. There has
been a shift in attitudes towards working mothers (Fern´andez, Fogli, and Olivetti, 2004)
and attitudes towards premarital sex (Fern´andez-Villaverde, Greenwood, and Guner, 2014).
However, certain aspects of gender norms and gender roles, such as the gender identity norm
(Bertrand, Kamenica, and Pan, 2015), and in particular, a belief that women are less capable
than men (Sarsons, 2015) have remained resilient.
This study shows that when the relevant shock is large enough, the more resilient aspects
of gender norms and gender roles can change. It suggests that the economic value of female
labor seems to be a major ingredient in how society assigns different values to different
genders. However, the relationship between the economic value of female labor, and the
perception of women being inferior, appears to be non-linear. For instance, low-value work
women performed in the past, such as cotton cultivation, has no impact on sex ratio at birth
today, whereas high-value work does. One interpretation is that the perception of women
being inferior only changes when the economic value of female labor reaches a sufficiently
high level. There exists a discontinuity in the correspondence between the value of women’s
work and the perception of them being inferior. This provides a possible explanation for
why certain aspects of gender norms and gender roles have yet to adapt in spite of changing
economic forces.
Qian’s (2008) study finds a negative relationship between women’s incomes and sex ratios.
In Qian’s framework, the economic effects of increasing female incomes improves survival
rates for girls contemporaneously. In this paper I show that an exogenous, sizable increase in
female incomes resulting from the cotton revolution led to the emergence of gender-equitable
beliefs. The lag between the end of the treatment period and my main outcome—up to 160
years—is sufficiently long to enable me to disentangle the transitory effects of a change in
relative female income—through an economic channel—from its lasting effects—through a
cultural channel. Furthermore, since the relationship between past economic value of female
labor and sex ratio at birth in 2000 is not linear. This further rules out a pure economic
4
channel being the explanation of the correlation between the cotton revolution and sex ratio
at birth in 2000. More specifically, when there is a small increase in historical relative female
income, it does not reduce sex selection. I also show that gender-equitable beliefs emerged
over the course of the cotton revolution, and that such beliefs can independently shape gender
inequality after the economic effects of the cotton revolution are long gone.
One strength of this setting is that the cotton revolution was a highly specific treatment.
It allowed women to earn a substantial income, and increased their share of the total household
income. But it was not accompanied by the type of macroeconomic dynamics that say, the
British Industrial Revolution, was associated with. Cotton was spun and woven in the homes
of women; it was organized around their extended families and similar technologies were
employed throughout the period. Wealth accumulation due to the cotton revolution was
limited, and economic gains were eroded by population growth. State-merchant relations
and capital formation in imperial China took a very different path than in the West—there
was no movement towards factory organization. In the absence of widespread economic and
political changes, the identification of the effects of the cotton revolution on women and
related channel becomes more feasible.
Another strength of this setting is that there was a unified, centralized state in both
historical and modern China, a feature highly useful for distinguishing the cultural channel
from other possible channels. Constrained by centralized rule, formal institutions remained
unchanged despite the cotton revolution. Also, the state eliminated local monopolies of
violence as far as possible. This is a precondition for relative contributions to economic
production, rather than physical strength, to take a central stage as the basis for gender
inequality (Harris, 1993).
China’s experience with state socialism in the 20th century can be exploited as a historical
“laboratory” for isolating the role of culture. First, state socialism mandated labor force
participation for both genders. This eliminated the explanatory power of economic differences
in men and women. Next, given the high degree of centralization characteristic of state
socialism, local economic and political institutions are not a function of voter preference.
Hence, attitude towards women can only affect outcomes that are determined solely by private
decisions. This allows me to measure the direct effects of more gender-equitable beliefs
brought about by the cotton revolution.5
In comparison with modern field experiments, an advantage of this historical natural
experiment is that the cotton revolution took place on a larger scale (Figure I). Also, due
5
In a usual setting, attitudes towards women can directly shape gender inequality by affecting private
decisions, as well as indirectly shape those outcomes by first shaping women’s political and legal rights,
educational and labor market outcomes.
5
to universal in-kind taxation, a high percentage of the households engaged in textile work,
which eliminates concerns for sorting in the marriage market and other general equilibrium
effects.
This paper is organized as follows. Section II sets forth the relations between my ar-
gument and the related literature. Section III explains the historical context. Section IV
discusses data sources and variable constructions. Section V summarizes my baseline esti-
mates, robustness checks and an instrumental variable analysis. Section VI presents survey
evidence on gender-equitable beliefs and its effects under various economic and political con-
ditions, including state socialism. In Section VII, I discuss the interpretations of the results
and a few caveats. Section VIII concludes the paper.
II Related Literature
The recent literature on gender equality has paid increasing attention to the role of culture
and identity in determining gender inequality (Fortin, 2005; Fern´andez, 2007; Fern´andez and
Fogli, 2009; Gneezy, Leonard, and List, 2009; Alesina, Giuliano, and Nunn, 2013; Bertrand,
Kamenica, and Pan, 2015). Fern´andez (2007) and Fern´andez and Fogli (2009) find that
cultural proxies have significant explanatory power for the work and fertility behavior of
second-generation American women. Other studies find that differences in psychological
traits between men and women are in fact rooted in culture. Gneezy, Leonard, and List
(2009) find that women compete less, but only in patriarchal societies.
Researchers have long been interested in how policy interventions can change gender
norms. Few interventions have been shown to have a robust effect on gender norms. Both
Beath, Christia, and Enikolopov (2012) and Windt, Humphreys, and Sierra (2018) find little
or no evidence that placing women in leadership positions affects attitudes or behavior. This
study focuses on an important aspect of gender-equitable beliefs, i.e. the perception of women
being less capable, and shows that in the long run, high-value work opportunities can change
such beliefs.
This study also contributes to the broader literature on the historical determinants of
cultural norms and beliefs. Many of these document the persistent impact of a negative
shock on cultural values such as Nunn and Wantchekon’s (2011) work on the effects of the
trans-Atlantic slave trade on corruption and trust today and Voigtl¨ander and Voth’s (2012)
study on the persistence of antisemitic beliefs in Germany. My study is closely related to
those papers that study how past economic factors have shaped contemporary gender norms
such as that of Alesina, Giuliano, and Nunn (2013) who attribute conservative gender norms
to the use of the plough which required upper body strength and Grosjean and Khattar
(Forthcoming) who examine conservative gender norms and its origins in historical marriage
6
market conditions in Australia.6
This study provides evidence that cultural norms persist
under small and transitory shocks, but can indeed change in face of large and long-standing
shocks.
Although the main focus of this paper is not sex ratio imbalances, my analysis contributes
to the literature on sex ratio imbalances by identifying an cultural factor in the skewdness of
sex ratios. Sex ratio imbalances, especially in India and China, have become an important
topic of policy debate and have attracted scholarly attention. Sex selection on a large scale
is held to be responsible for a great share of the “missing women”.7
Almond, H. Li, and S.
Zhang (Forthcoming) shows that rural land reform in China led to an increase in sex ratios.
Sex selection is also present in developed countries. Daul and Moretti (2008) and Almond and
Edlund (2008) find evidence for sex selection in the United States. Edlund (1999) explicitly
models sex ratios in relation to son preference. Scholars have identified relative adult female
earnings (Rosenzweig and Schultz, 1982; Gupta, 1987; Duflo, 2003; Qian, 2008; Carranza,
2014) and biological factors (Oster, 2005) as causes of sex ratio imbalances. This study takes
one step further by investigating the origins of a culture of son preference. In addition, by
reviewing the history of widow survival in China, this paper adds to the literature on “missing
unmarried women” (S. Anderson and Ray, 2015; Miguel, 2005).
III The Cotton Revolution and The Rise of Women
Before 1300, silk and hemp were the two main fabrics used for clothing. High-quality silk
was the most valued fabric. It was produced in a small number of urban shops, and demanded
only by a small elite.8
Hemp was the predominant fiber for ordinary clothes. Wool was not
available in China.
Following a one-time technology breakthrough in cotton textile production, cotton gradu-
ally replaced hemp and low-to-medium grade silk to become the dominant fiber for day-to-day
clothes. Pre-existing political and economic institutions—such as the tax system—and ex-
isting cultural norms, all of which were uniformly present across China proper, meant that
6
Other relevant studies include that of Jha (2013), who shows that cities in India that were medieval
trading ports experienced significantly fewer religious riots between Muslims and Hindus in the period after
1850. Grosjean (2014) examines the persistence of a culture of honor among Americans of Scots-Irish descent.
She finds that this culture of honor results in higher homicide rates among Scots-Irish in the US South and
Mountain West but not elsewhere and argues that this culture has persisted only where formal institutions
are comparatively weak.
7
See Das Gupta and Mari Bhat (1997), Arnold, Kishor, and Roy (2002), Ebenstein (2010), and Lin, Liu,
and Qian (2014)
8
The production and consumption of high-quality silk involved a small and selected segment of the
population. Silk accounted for 3% of the domestic trade, based on A.XVII. Only 7% of the Chinese population
in Ming China was urban.
7
women, rather than men, were spinners and weavers. Moreover, this technological break-
through took place in a society that had well-functioning markets and a developed trade
network. As a consequence, women, working in their own homes and with family members,
were able to produce cotton textiles on a large scale for the market thereby earning incomes
that far exceeded those available in past agrarian societies. The incomes their earned from
cotton textile production enabled them to became major income earners within the household
(B. Li, 1997).
The production of cotton textiles, like that of other goods, was highly decentralized.
Individual households owned the machinery, purchased raw cotton from the market, and sold
finished cloth back to the market, which differed greatly from the British putting-out system
(see Appendix F). Those households reaped most of the gains from their production.
Despite the rapid expansion of cotton textile production, the growth was Smithian. There
was little further technological innovation (Elvin, 1972). The level of output per capita
stagnated due to the offsetting Malthusian forces of rapid population growth.9
China did not
industrialize, or became a capitalistic economy, which is one of the most important stylized
facts in economic history. China did not industrialize until at least 150 years after the British
Industrial Revolution (“The Great Divergence”), and there has been a sizable literature in
economic history investigating the causes of the Great Divergence.
After 1840 China opened up its market to the West after its defeat in the first Opium
War. Mechanized cotton textiles from the British Empire began to replace cotton textile
handicraft produced by Chinese households. Household cotton textile production only began
to collapse in the period between 1870–1910 due to competition from imported manufactured
textiles (Myers, 1965, p. 621). Appendix F details the market structure and features of
decentralized production during that period.
A Initial Conditions
In China as in much of the preindustrial world, textile production was carried out by
women “who spent every available moment spinning, weaving, and sewing” (Barber, 1991).
Spinning and weaving were deemed as womanly skills. From the Mianhua tu (Pictures of
Cotton [Cultivation and Weaving]), first published in 1765, that women had an essential role
in cotton textile production (Mann, 1997, pp.165-68).
Women worked together in extended families. Spinning and weaving skills were transmit-
ted intergenerationally, typically from mother to daughter. In those families, older women
were weavers; younger women and girls were spinners. Through apprenticeship, younger
9
For a discussion of macroeconomic conditions and Malthusian stagnation during that period, see Ap-
pendix F.
8
women learned essential skills for textile work from older women. Compared with spinning,
weaving was higher-paying and demanded more skills.
The state was a major buyer for textiles through the economic institution of universal in-
kind taxation. This institution mandated grain and textiles to be two major in-kind taxation
items (Bray, 1997). Each household was responsible for producing both grain and textiles.
Women specialized in producing textiles. Two main reasons for this were that (a.) women
were far more productive in textile production than in plough-based grain production, for
which male labor was essential; (b.) producing textiles complemented childcare duties, both
of which took place within the home. By 1300 AD, when the cotton revolution took place,
spinning and weaving had long been deemed as womanly skills.
B Technological Improvements in 1300
Around 1300, Huang Dao Po, a Shanghai native (1245-1330 AD), acquired new spinning
and weaving technologies from an ethnic group, known as the Li, residing on Hainan Island
and brought them back to mainland China.10
The production of cotton textiles involves two
processes: spinning and weaving. Raw cotton is spun into thread and yarn before cotton
thread is woven into cloth. Due to the use of new spinning and weaving technologies, the
production of cotton textiles on a large scale became feasible for the first time (Bray, 1997;
G. Zhao, 1977).
Huang Dao Po introduced a new spinning wheel that had three spindles. Spinning wheels,
for a long time, had just one spindle. The new spinning wheel increased productivity by
allowing women to use both their hands and their feet to keep the wheel spinning. Its technical
design was comparable to that of the Spinning Jenny, which was invented in 18th century
England and a predecessor to subsequent technologies used in textile manufacturing. The
adoption of the new spinning wheel in 14th century China dramatically increased spinning
productivity.
This device roughly doubled or tripled the productivity of female spinning operatives.
Workers using multiple treadle-operated spindle-wheels could produce between 500 and 1500
grams of yarn by operating up to five spindles at the time. Joseph Needham notes that until
the British Industrial Revolution, “the technological standard of Chinese cotton manufacture
had no parallel anywhere else in the world” (Needham and Kuhn, 1988, p. 223). Needham
concludes that: “For more than 450 years Chinese cotton-spinning technology was therefore
superior to the spinning methods used in any other country (Needham and Kuhn, 1988,
p. 224).
10
Contemporary Li people still use those technologies for textile production. Finished cloth can purchased
by tourists who visit Hainan Island.
9
This resolved a bottleneck that previously prevented the the cotton textile industry from
further increasing productivity–before the new spinning wheel was used, every weaver had
to be matched with three to four spinners given the rate at which spinning took place. In
addition, Huang also introduced new techniques for cotton fluffing and crushing and methods
of weaving mixed cotton fabrics, colored fabrics and fabrics with mixed warp and weft fibers.
Following this one-time technological breakthrough, cotton textile production expanded
rapidly in the following centuries. Due to its durability, cotton replaced hemp and began
to dominate the everyday clothing market. Other attractive features of cotton cloth include
being effective in the cold weather, and offering higher yields per unit of land. 11
Demand for
cotton was kept high by government demand, especially military demand for uniforms, and
by expanding urban markets (Myers, 1965). According to Pomeranz (2000, p. 338), cotton
textile production in 1750 was only slightly before that of Britain’s in 1800.
C Labor Market Responses
Given the importance of cotton textile production, and its immense scale, there should be
strong labor market responses to increasing demand for cotton textiles, i.e. labor should be
reallocated into the production of cotton textiles. Yet, such responses did not occur. Many
characteristics of the imperial Chinese economy were responsible for a lack of labor market
responses. Below I illustrate some of those characteristics. In Appendix F, I shed further
light on those characteristics through a comparison with the British putting-out system.
Several factors may explain the lack of labor market responses to the cotton revolution.
First, the level of technology favored household production. Hence there was minimal friction
between demands from work and demands from family. This solidified the traditional division
of labor between men and women, i.e. men plow and women weave. Second, labor mobility
was low. The majority of Chinese families owned land. The majority of the population were
small land owners throughout much of imperial Chinese history. Land ownership is commonly
associated with low labor mobility.
Land ownership also raised the cost of men entering into cotton textile production. In
plough-based agriculture, men performed tasks in the field, as they had the upper body
strength to do so. This prevented them from being full-time textile workers. Women tended
to be full-time textile workers. Due to the fixed cost of owning a spinning wheel and a loom,
it made more sense to let the full-time worker have exclusive access to them.
Besides, to sustain political control, the imperial government restricted labor mobility.
During much of the Ming Dynasty (1366-1644), occupational status was by inheritance and
11
See Appendix F for a discussion of the impact of the cotton revolution on non-cotton textile producing
regions.
10
individuals stayed where they were officially registered. A cultural factor for a lack of mobility
was that individuals stayed with their extended families under the clan system.
As cotton weaving demanded a set of climatic conditions, there were geographical con-
straints on where cotton could be woven (Figure I). Finished cloth, on the other hand, was
sold to everywhere in the country. Relative to the rest of China, areas where cotton weaving
was feasible saw a varying degree of cotton textile boom and persistently higher productivity
in the textile sector.
D How Much Did Women Earn?
Cotton textile producers, especially weavers, were high income earners. Historians pro-
vide various estimates of the actual incomes women received for producing cotton textiles.
Allen’s (2011) wage regressions indicate that textile workers earned a wage premium com-
pared with workers in construction or agriculture. Allen (2009) shows that one day’s work
by a weaver in the late 17th century produced 7,684 calories, which was adequate to support
a family. B. Li (1997) shows that a woman’s year-round textile work was enough to feed
2.7 people. Pomeranz (2002) provides an even more optimistic estimate suggesting that a
woman could earn four times as much as a man. The most conservative estimate is made by
P. C. C. Huang (1990). He estimates that in an average household, a female cotton textile
producer generated incomes that were about 77% of those of their husbands.
Women who had the skills to weave artisan cloth could earn an higher income. The
production of artisan cloth was backed up by popular demand of weddings and funerals in
premodern China. Greater skills and longer hours were involved in producing artisan cloth.
In summary, although before the cotton revolution, Chinese women were already doing
productive work, the cotton revolution allowed women to produce a larger quantity of textiles
to be sold to the national market. This enabled women to earn enough to support a family
independently and to take on a new role as primary income earners in the household. By the
late Ming period, women had begun to produce predominantly for the market, and in many
cases their earnings became the main source of income for the household.
E Highly Capable Women in Historical Narratives
As stated before, the cotton revolution was a major shock to the value of women’s work.
That was a major changing force for the relative income status of husbands and wives, as
reflected in many historical accounts. In a survey article (Man, 2011), Zheng paints a vivid
image of female breadwinners being unwavering and dependable.12
In many societies, there exists a gender identity norm that the husband earns more than
12
Zheng complies a list of historical sources: J. Chen et al. (1991), Gu (1995), and Xu (1987).
11
the wife (Bertrand, Kamenica, and Pan, 2015). Based on theories of cultural evolution,
because relative payoffs of cultural traits are crucial to the choice of behavioral rules (Boyd
and Richerson, 1985), a shock to the value of women’s work may lead to the breakdown of
such norms. Under the circumstances in which men and women have the option of staying
out of the marriage market, and no longer reproduce, those norms can stay intact.13
However,
because of the traditional emphasis on continuing the family line in China, men and women do
not have the option of staying out of marriage.14
Universal marriage, in conjunction with the
ubiquitous increase in women’s incomes following the cotton revolution, created conditions
necessary for gender identity norm to break down.
For parents, as women became productive members of the economy in their own right,
it became less financially costly and mentally stressful to have a daughter. Marriage laws in
imperial times allowed men to freely exit marriage (“seven codes for divorcing wives”). This
created a financial risk for the natal family as the daughter can become a financial burden
on them upon her divorce. The prospect of daughters being self-sufficient lowered the cost of
having them.
Economic independence can also have a positive impact on the self perception of women.
In Xu (1987), a female proudly proclaimed that she single-handedly supported the family and
was a “strong woman,” a “she-husband.” She declared that her husband was passionate about
literary writing and painting and that was all he could do. In particular, she stressed that
he was unhelpful in making ends meet. Anecdotal evidence suggests that women producing
cotton textiles enjoyed greater autonomy and higher social status (c. Zhao, 2015).
F Other Episodes: Black Death, Proto-industrialization and Industrial Revolution
There were other historical episodes during which women’s incomes rose relative to men’s.
The main differences are that (a.) these other historical episodes of increasing female incomes
were not of as large a magnitude and not as long-lasting. (b.) the cotton revolution affected
both married and unmarried women. (c.) a lack of coverture laws in China. In Appendix
F, I discuss a comparison with the phase of proto-industrialization in England, as well as a
comparison with female labor force participation after the Black Death.
From 1820 to 1850, in the industrialization of the American Northeast, female labor
force participation was substantial, and the wages of women increased relative to that of men
(Goldin and Sokoloff, 1982). In a letter, a New England farm girl was full of excitement when
13
Bertrand, Cort´es, et al. (2016) discuss the negative social attitudes towards working women and how
they contribute to the marriage gap for skilled women.
14
This has begun to change in the past 20 years. Now a substantial share of women in urban China stay
single.
12
she began to work on well-paying jobs in textile mills (Dublin, 1993).15
Ferree (1976) finds
that working-class women are happier if are employed; they work for the money but they also
gain a sense of competence, connectedness, and self-determination from their job. Similarly,
at a community level, in India, work earns women money and respect.16
IV Data
I combine several gazetteer-based sources to construct my main variable, cotton textile
production (1300-1840). For other historical variables, I use China Historical GIS (CHGIS),
the digital map collection of Harvard University, the database of Chinese Gazetteers (Zhong-
guo fangzhi ku), the 1916 economic census and surveys conducted by Christian missionaries
in the early twentieth century. For modern outcomes and controls, I use modern censuses
and surveys, including the 2000 population census (county-level), the 1990 census (individual-
level) from the IPUMS International, the 2004 Industrial Census from the China Geo Ex-
plorer, the Chinese City Statistical Yearbooks and Chinese General Social Surveys (2005,
2010). For climatic and geographic variables, I rely on data from the Climate Research Unit
of University of East Anglia, FAO (GAEZ v3.0), NASA and NOAA. Appendix B provides
details on sample construction, data sources, and variable constructions.
A Cotton Textile Production (1300-1840)
To obtain an estimate of the distribution of counties and prefectures where cotton textiles
were produced between 1300 and 1840 across China today, I map historical locations of cotton
textile production into modern counties.17
Historical gazetteers provide qualitative information on cotton textile production. My
main interest lies in the spinning and weaving of cotton textiles, rather than the cultivation
of raw cotton. Information on cotton spinning and weaving, as well as cotton cultivation, can
be inferred from a section describing goods that were produced locally (shihuo zhi). I code
cotton textiles (1300-1840) as one, if finished cotton cloth is mentioned in the gazetteer of a
specific county or prefecture (jibei bu or mian bu). Both mian and jibei mean “cotton”. jibei
is just an alternative name to mian. bu means “cloth”. I draw on several historical studies
to construct my dataset. A key source I use is Wang (2006). More information on those
historical studies are available in Appendix B.2.
15
Dublin (1993) is a collection of letters from five women working in textile mills. Mary Paul said in a
letter “I can earn more to begin with [at lowell] than anywhere about here.” When she got paid, she expressed
her excitement over buying new shoes “Last Tuesday we were paid. In all I had six dollars and sixty cents
paid $4.68 for board. With the rest I got me a pair of rubbers and a pair of 50 cts shoes.”
16
http://www.nytimes.com/2016/01/31/world/asia/indian-women-labor-work-force.html?r = 0.
17
The year 1840 marks the end of the household production of cotton textiles. Section III provides detailed
background information for the cotton revolution.
13
I rely on county and prefecture gazetteers (Figure A.V). For prefectures, their historical
boundaries are known; but for counties, their exact boundaries before the year of 1911 are
unknown. Based on my default method, a historical county is the “ancestor” county of a
modern county, if the county seat falls into the boundary of a modern county. A value of
one is assigned to a modern county if cotton textiles were produced in its “ancestor” county
between 1300 and 1840; zero is assigned otherwise.18
In addition, a value of one is assigned
to a county with more than half of its area overlapping with a historical prefecture with
cotton textile production, and zero to other counties. This yields a dummy variable of cotton
textiles (1300-1840) for each county.
To account for boundary changes over time, I use time-series maps of prefectures and
counties to identify precise historical locations of cotton textile production between 1300 and
1840. This allows me to use historical locations closely matched to sources. For example,
when a record is taken from a prefecture-level gazetteer published in 1503, it is geocoded as
in that particular prefecture with its boundaries in 1503.
I also code cotton textile production using alternative methods. I locate historical coun-
ties in a map from a later period (the earliest will be year 1911) when their boundaries
became known. This method results in a continuous variable of cotton textile production,
which yields highly similar estimates to the estimates based on the binary variable. Alterna-
tively, I create a continuous variable based on the percentage of land area of each county that
overlaps with a historical prefecture with cotton textile production. This also yields estimates
highly comparable to those obtained with the binary explanatory variable. In Appendix B.2,
I lay out the detailed procedure for constructing the main explanatory variable. In Appendix
B.3, I describe how cotton textile production (1300-1840) is linked with modern outcomes.
As a summary, Figure I shows the distribution of counties and prefectures that previously
produced cotton textiles across China in 2000.
Historical gazetteers provide valuable information on cotton textile production between
1300 and 1840. However, two types of biases are present in gazetteer data: publication bias
and survivorship bias (Appendix B.2). Wealthier counties published more gazetteers and at
an earlier date. My solutions to this are as follows: first, I use a binary treatment variable
constructed to avoid introducing spurious correlations between cotton textiles (1300-1840),
stage of development and cultural beliefs about women’s worth; second, in Table A.IX, I run
several regressions based on the number of gazetteers available in a county. I show that my
coefficient estimates are not sensitive to the frequency at which historical gazetteers were
18
All gazetteers I use were published in the Ming and Qing Dynasty (1368-1840), because very few
gazetteers were published before 1368. Here I assume that gazetteers published in the early Ming Dynasty
would contain information on cotton textile production that began before 1368.
14
published, which suggests that “publication bias” and “survivorship bias” are unlikely to
drive my results.
Figure I: Cotton Textile Production (1300-1840)
B Control Variables
In this section, I outline the set of control variables used for the county-level analysis in
modern-day China. Additional controls are used in my analyses of other historical episodes
of China and will be discussed in those sections.
My baseline controls include contemporary controls such as a county’s per capita GDP
measured in 2000, share of urban population, share of agriculture workforce, share of service
workforce, share of urban hukou (household registration), years of schooling (male), share of
ethnic population, governance status and provincial capital status, historical controls such
as agricultural suitability, population density in 1300, proximity to the Grand Canal or the
Yangtze River and treaty port, as well as a set of geographic controls, such as ruggedness,
distance to coast, latitude and longitude. To account for deep-rooted socio-cultural differ-
ences across regions, I include Skinner socioeconomic macroregion fixed effects, in addition
15
to province fixed effects.
I obtain most of contemporary controls from the 2000 Census. Maps are from National
Bureau of Statistics (2005). Skinner socioeconomic macroregion data are available at the
G.W. Skinner Data Archive (Skinner, M. Henderson, and Berman, 2013). Historical controls
include agricultural suitability, proximity to the Grand Canal or the Yangtze River and treaty
port status. Agricultural suitability is downloaded from the FAO website. When more than
one suitability measure is available for a particular type of crop, I use the suitability measure
based on intermediate-level input under rain-fed conditions in the most recent version of the
FAO database (GAEZ 3.0). Proximity to the Grand Canal or Yangtze is obtained from the
China Historical GIS (CHGIS). Distance to the nearest coast and ruggedness are downloaded
from the National Aeronautics and Space Administration (NASA) website.
For other types of work women engaged in, I include cotton suitability, tea suitability and
rice suitability data from FAO, and historical production data on other types of textiles from
historical gazetteers. Suitability maps are available in Appendix A. To assess the impact of
large economic and political shocks, I control for treaty ports (Jia, 2014), density of com-
municants (Stauffer et al., 1922) and coastal China (National Bureau of Statistics, 2005).
In addition, I check to see how three hypotheses examined in previous work hold up in this
study. I obtain data on ancestral plough use from the Ethnographic Atlas (Murdock, 1967),
information on Neolithic settlements (Chang, 1963) and soil texture from the Harmonized
World Soil Database (Nachtergaele et al., 2008). Finally, I add language group as a control
using data from the G.W. Skinner Data Archive.
Summary statistics are shown in Table A.I. Appendix B.4 provides the historical context
for variables including proximity to the Grand Canal, treaty ports, density of communicants
in early 20th century, pre-1300 commercial tax quota and historical courier routes.
V The Cotton Revolution and Sex Ratio at Birth: A
County-Level Analysis
A Determinants of Sex Ratio at Birth
A wide range of factors shape sex ratios in the population, but sex ratios at birth are
relatively clustered, typically from 103 to 107 boys per hundred girls. The perception of
women being inferior can lead to female infanticide, child neglect and underinvestment in
girls. When sex-selection technology is available, the manifestation of biases against women
can shift towards an earlier stage of reproductive process: pre-natal sex selection.
It has been shown that pre-natal sex selection is an important source in the skewness of
16
sex ratio at birth (Ebenstein, 2010).19
In the 2000 Chinese Population Census, sex ratios at
birth ranged from 92 to 193 boys per hundred girls.20
In a usual context, individuals simultaneously make decisions on fertility and sex selection.
With the same attitude towards women, a population with a lower desired fertility can have
a more skewed sex ratio at birth. Under the one-child policy, however, fertility became
exogenously determined. This policy created a favorable condition for identifying the effect
of the perception of women on the skewness of sex ratio at birth.
In the context of China in 2000, the main variation in sex ratio at birth comes from (a.)
Economic payoffs to having a boy; (b.) Difficulty to having at least one boy, i.e. variation in
the one-child policy and its enforcement; (c.) Culturally-determined preference for boys.
For (a.), the economic payoffs to having a boy are impacted by the stage of development
and sectoral composition (Rosenzweig and Schultz, 1982). I include per capita GDP, share of
agriculture workforce and share of service workforce as controls. Due to the setting of state
socialism, differential economic payoffs to having a boy is unlikely driven by gender differences
in labor force participation. China’s female-to-male ratio in labor force participation rate
was at 85% in 2000, one of the highest in the world.21
In terms of (b.), the one-child policy
further increased the difficulty to having at least one boy.22
The policy varied by household
registration (hukou). Those with urban hukou were subject to a stricter version of the one-
child policy than their rural counterparts. Ethnic minorities were either not subject to or
subject to a less strict version of the one-child policy. Besides, political characteristics such
as how a county is governed and whether it is a provincial capital can affect the enforcement
of the policy.23
When it comes to (c.), the share of ethnic population is also an important
determinant. The pace of modernization may also affect the taste. Average years of schooling
19
Confucian values shaped traditional Chinese society in important ways. It strongly disfavored women,
partly because it laid a particular emphasis on continuing the family line and held that only male offspring
could fulfill this purpose. A further development in Confucianism, Song-Ming Neo-Confucianism, further
disadvantaged women. Song-Ming Neo-Confucianism was first developed in the Song Dynasty (960–1279),
which led to a series of negative changes for women, ranging from unfriendly inheritance laws and to remarriage
being stigmatized. Appendix F has more details on Confucianism, Song-Ming Neo-Confucianism and status
of women.
20
This is after the exclusion of five autonomous regions where (a.) A large share of the population comprise
ethnic minorities who were not exposed to Confucian norms and institutions; (b.) The one-child policy was
not enforced or not to the same degree.
21
http://hdr.undp.org/en/content/labour-force-participation-rate-female-male-ratio. Female-to-male la-
bor force partipcation was 74.8% in the United States and 62.4% in Germany.
22
Fertility decline predated the one child policy (Babiarz et al., 2018).
23
Chinese prefectures and counties underwent institutional reforms after 1982. Governance status started
to vary across counties. Governance status of the county takes one when it is governed by the prefecture-level
government, two when it is self-governed, and three when it is governed by the province-level government.
17
is shown to be a good proxy for modernization.24
(c.) is where I expect the effects of the
cotton revolution enter.
The choice of sex ratio at birth in 2000 as the main outcome variable is motivated by the
following facts: (a.) Sex selection technologies became widely available in the 1990s. By the
mid-1990s, virtually all county-level hospitals, township-level clinics and local family planning
agencies were equipped with ultrasound scanners (Anukriti, Bhalotra, and Tam, 2015). (b.)
Before 2000, variation in the one-child policy was limited to urban versus rural hukou, Han
Chinese versus ethnic minorities. After 2000, some counties began to experiment with a
two-child policy for parents that were both the only child of their parents. (c.) Marriage
remained near universal, and voluntary childlessness was relatively rare. This shuts down a
possible channel flowing from the cultural beliefs about women’s worth to sex ratio at birth
that is not pre-natal sex selection. Selectivity into motherhood, if correlated with the cotton
revolution and son preference, could be a confounder. (d.) Data quality of the 2000 census
is one of the highest. After 2000, a floating population composed of 200-million temporary
migrants affected the data quality of the population censuses.25
In Appendix C, I compare pre-natal with post-natal sex selection (Lin, Liu, and Qian,
2014; Hu and Schlosser, 2015) in Appendix C.1, demonstrate how the one-child policy induced
pre-natal sex selection by manipulating fertility constraints in Appendix C.2 and show that
access to ultrasound screening varied over time and became widespread by the late 1990s
(Appendix C.3).
B Connections to Cultural Beliefs About Women’s Worth
The President’s Commission for the Study of Ethical Problems in Medicine and Biomed-
ical and Behavior Research of the United States in 1983 came to the conclusion that “in
some cases, the prospective parents’ desire to undertake the procedure (of sex selection) is an
expression of sex prejudice. Such attitudes are an affront to the notion of human equality and
are especially in an appropriate in a society struggling to rid itself of a heritage of such prej-
udices . . . Surveys of parents and prospective parents indicate, however, a preference for sons
(especially as the first-born child). If it became an accepted practice, the selection of sons
in preference to daughters would be yet another means of assigning greater social value to
one sex over the other and perpetuating the historical discrimination against women.” Like-
24
It is common to use years of schooling as a proxy for modernization. I use years of schooling (male)
instead of years of schooling in the population, because female education is influenced by differential parental
investments.
25
To deal with the challenge arising from tracking temporary migrants, the 2010 Census had to the record-
ing method of “recording every individual encountered”. It was not unusual to double count an individual in
the place he worked (by current residence) and in his hometown (by household registration).
18
wise, American philosopher Mary Ann Warren (1985) considers sex selection to be ‘invariably
motivated by sexist beliefs”.
In the United States, as ultrasound technology became widely available, fears emerged
that sex selection might take place on a large scale—the 1970 National Fertility Study shows
that the sex preference ratio is as high as 124 boys for every 100 girls for all women who
intend to have more children (Westoff and Rindfuss, 1974).26
Legal and moral forces are important constraints on the use of sex selection to choose
the gender of a newborn in a way consistent with underlying cultural beliefs about women’s
worth; such constraints are not equally present in China.27
In the 1990s, as ultrasound
screening became widespread, another crucial constraint on sex selection was lifted (Cloonan,
Crumley, and Kiymaz, 2005; Y. Chen, H. Li, and Meng, 2013). During the window of a few
years near 2000, China was close to being at the hypothetical setting where no meaningful
constraints were placed on how sex selection was achieved and culture beliefs about women
were uninhibitedly translated into sex ratio at birth through sex selection.28
This motivates
the use of sex ratio at birth in 2000 as a main proxy for culture beliefs about women.
C Baseline Results
Having constructed a county-level measure of cotton textile production, I can examine
the relationship between cotton textiles (1300-1840) and modern outcomes.29
I begin by
examining variation at the county level. I test my hypothesis by estimating the following
equation:
Sex ratio at birthc = α + βcotton textiles (1300-1840)c + XH
c Ω + XG
c Λ + XC
c Π + c , (1)
where c denotes a county. cotton textiles (1300-1840)c is cotton textile production for 1300-
1840 at County c. XH
c is a vector of historical controls, and XG
c and XC
c are vectors of
geographical and contemporary controls respectively, each measured at the county level.
XG
c and XH
c are intended to capture geographic and historical characteristics that may
have been correlated with cotton textiles (1300-1840) and may still affect present-day out-
comes. I include in XH
c agricultural suitability and estimated population density in 1300.
26
Sex ratio imbalances on that scale, however, never actually occurred, though nearly a 20 percent “excess”
of male births was initially projected to follow a technological breakthrough in sex selection technology.
27
J. Lee, Campbell, and Feng (2002) and R. Lee and M. Anderson (2002) document widespread infanticide
in premodern China; they consider the practice as part of the “preventative check” on the population. See
Appendix C. A for more details on attitudinal differences in infanticide across societies. Also, like other
communist countries, China destigmatized abortion.
28
After 2000, there was some relaxation in the enforcement of the one-child policy in some regions.
29
I can derive an alternative measure of sex ratio imbalances by taking the natural log of the deviation of
sex ratio at birth from the normal sex ratio. Results are very similar when this alternative measure is used.
19
For an agrarian economy, agricultural productivity reflect economic fundamentals and shape
social structures. Extreme poverty can cause individuals to pursue infanticide as a survival
strategy (L. M. Li, 1991), which might affect modern outcomes through attitudes towards
pre- or post-natal sex selection. It is also a rough proxy of historical male incomes given
that men were primary agricultural workers at the time. Historical population density is a
proxy for economic development and can shape the ancestral traits of modern populations
(Putterman and Weil, 2010). Historical population data are scarce. I use estimated popula-
tion density in 1300 from Goldewijk, Beusen, and Janssen (2010) and Klein Goldewijk et al.
(2011). The distribution of cotton textiles (1300-1840) depended on the trade networks. I
include a control for whether the county was on the Grand Canal or on the Yangtze River—
the major trade networks at the time. To account for the impact of treaty ports established
in the 19th century, I include treaty port status as a control. To control for geographic dif-
ferences across counties, I include in XG
c the natural log of distance to coast and the natural
log of one plus ruggedness, latitude, longitude and their interaction.30
To address norms such
as patrilocality and concern for women’s purity and other differences across those histori-
cally relatively autonomous regions, I include fixed effects corresponding to socioeconomic
macroregions defined by Skinner, M. Henderson, and Berman (2013).31
As an alternative, I
can include language fixed effects, which would also account for large differences in culture
and customs.32
The contemporary control variables include socioeconomic characteristics such as the
natural log of a county’s per capita GDP measured in 2000, share of urban population,
share of agriculture workforce, share of service workforce, share of urban hukou (household
registration), years of schooling (male), share of ethnic population, political characteristics
including governance status and provincial capital status, and province fixed effects.
The OLS estimates show that in counties with cotton textile production between 1300 and
1840, fewer girls are missing today. The coefficient estimates are both statistically significant
and economically meaningful. I begin my analysis with socioeconomic region fixed effects only
(column 1), and then include both socioeconomic region fixed effects and province fixed effects
(column 2). When I include the full set of controls in column 3, the size of the coefficient
increases from -3.008 to -3.753. The cotton revolution is associated with a decrease of sex
ratio at birth by 3.753 boys per 100 girls, which is 27% of the standard deviation of sex ratio
30
Deng (1999) makes the point that in premodern China, people living in rugged terrain tended to net
consumers of cotton textiles.
31
Please refer to Appendix B.4 for a more detailed description of socioeconomic macroregions.
32
Results using language fixed effects can be found in E. Language fixed effects can also be added to other
specifications and results do not change.
20
Table I: Cotton Revolution and Sex Ratio Imbalances: OLS Results
Dependent variable: sex ratio at birth in 2000
(1) (2) (3) (4) (5) (6)
Mean of Dep. Var. 118.3 118.3 118.6 118.6 118.6 118.6
Cotton textiles (1300-1840) -3.008∗∗∗
-3.225∗∗∗
-3.753∗∗∗
-4.049∗∗∗
-3.887∗∗∗
-4.066∗∗∗
(0.668) (0.713) (0.731) (0.775) (0.777) (0.773)
Log per capita GDP -2.941∗∗∗
(0.479)
% in agriculture 0.245
(0.379)
% in service -0.538
(1.302)
Years of schooling (male) -2.485∗∗∗
(0.724)
% ethnic population -0.718∗∗∗
-1.118∗∗∗
(0.249) (0.253)
Provincial capital 3.091∗∗∗
0.0496 -0.221
(1.006) (0.958) (0.954)
Self-governed -2.882∗∗
4.586∗∗∗
5.484∗∗∗
(1.364) (0.890) (0.861)
Governed by province -2.363∗
3.436∗∗∗
4.110∗∗∗
(1.249) (1.065) (1.063)
Historical controls No No Yes Yes Yes Yes
Geographic controls No No Yes Yes Yes Yes
Province FE No Yes Yes Yes Yes Yes
Socioeconomic Macroregion FE Yes Yes Yes Yes Yes Yes
Adjusted R2
0.150 0.231 0.368 0.314 0.306 0.288
Observations 1622 1622 1489 1489 1489 1489
Notes: The table reports the impact of cotton textiles (1300-1840) on sex ratio imbalances.
The unit of observation is a county in 2000 Census. The dependent variable is sex ratio at
birth. Column 1 reports estimates with only socioeconomic macroregion effects. Column 2
reports estimates with both socioeconomic macroregion and province effects. Column 3 includes
all controls. “Historical controls” are treaty port status, agriculture suitability, and whether
a county was on the Grand Canal or the Yangtze River (major trade networks). “Geographic
controls” ar the natural log of one plus ruggedness, the natural log of distance to coast, latitude,
longitude and their interaction. Column 4-6 sequentially drops potentially endogenous modern
controls. The omitted category for governance status is being governed by the prefecture-level
city government. Robust standard errors are used in all specifications. Standard errors in
parentheses ∗
p < 0.10, ∗∗
p < 0.05, ∗∗∗
p < 0.01
21
at birth.33
Column 3 contains the baseline specification for the rest of this study. Figure A.I
in Appendix A shows a partial regression plot corresponding with column 3. It indicates that
the coefficient estimate of cotton textiles (1300-1840) is not influenced by a small number of
counties.
In column 4, the coefficient estimate remains similar when I omit logged per capita GDP,
logged share of urban hukou, logged share of agricultural workforce and logged share of service
workforce and years of schooling (male).34
In column 5, in addition to controls omitted from
column 4, I exclude the share of ethnic population.35
In the last column, I exclude provincial
capital status and governance status, and the coefficient estimate remains close to those in
previous columns. These results can be replicated using the individual-level 2000 census (1%
sample).
In Appendix Table A.XI, I examine alternative outcome variables from the 2000 census,
such as sex ratios among other cohorts with exposure to the ultrasound technology. I look
at individuals that were aged 1-4 and 5-9, and find very similar patterns. I find that women
have a higher educational attainment in counties positively impacted by the cotton revolution.
Given that opportunities to attend school, or to participate in the labor force, were made
equal under state socialism, this difference is most likely driven by parental investment in
education. It shows that parents in counties with a history of cotton textile production are
more likely to invest in girls. 36
Men’s educational attainment is not correlated with cotton
textiles (1300-1840).
One concern is that counties with and without cotton textiles (1300-1840) differ in many
dimensions and have very different unobservables. By comparing coefficient estimates and
movement in R2
across the columns, I show that my results are not driven by selection on
unobservables. Table A.VII in Appendix E summarizes the test of selection on unobservables
33
The specification is also robust to the inclusion of the squared term of log per capita GDP. Chung and
Gupta (2007) suggests that sex ratios can change in nonlinearity through different stages of development.
Results are robust to controlling for fertility; however, fertility is a “bad” control, as decisions are made
simultaneously on fertility and sex selection [pp.64-68](Angrist and Pischke, 2008).
34
Though large sex ratio imbalances are a relatively new phenomenon in China, the underlying cultural
beliefs about women are not, and per capita GDP could have been negatively affected by past gender discrim-
ination. Sex ratio imbalances per se can also affect GDP through increasing saving rates (Wei and X. Zhang,
2011). In either case, controlling for log per capita GDP will constitute the case of “overcontrolling”.
35
The share of ethnic population might have become endogenous to the dependent variable in the past few
decades due to responses to the one-child policy. Under the one-child policy, ethnic minorities were allowed to
have more children than were the Han Chinese. W. Huang and Zhou (2016) has documented that inter-ethnic
marriages have become more common under one-child policy.
36
These results can be replicated on the individual-level 2000 census (1% sample). The interaction term
between cotton textiles (1300-1840) and female is positive for all cohorts starting from the 1930s but for the
cohort of individuals born after 1990. Given the year of the year of the census, those who were born after
1990 would be under 10 and all have “less than primary education”.
22
based on selection on observables (Altonji, Elder, and Taber, 2005; Oster, 2014).
To further ensure the robustness of the results, I conduct the following tests: (i.) clus-
tering at different geographic units; (ii.) using matched samples; (iii.) addressing biases
in gazetteer data; (iv.) using different subsamples (omitting the Yangtze Delta and omit-
ting high net in-migration counties); (v) accounting for historical and modern confounders
(pre-1300 commercial networks, historical state presence and modern industrial composition);
(vi.) checking three main hypotheses in previous work: ancestral plough use (Alesina, Giu-
liano, and Nunn, 2013), Neolithic settlements (Hansen, Jensen, and Skovsgaard, 2015) and
soil texture (Carranza, 2014);(vii) examining variation within populations speaking the same
language only. Appendix E summarizes the results of the above tests.
D The Distinctive Role of High-Value Work
The adoption of better technologies increased the quantity of cotton textiles produced
per unit of time. Labor productivities in producing cotton textiles were higher in regions
suitable for cotton spinning and weaving. Through inter-regional trade, cotton textiles were
“exported” from those regions to the rest of China. Due to restrictions on migration, and
gender segregation in types of work (Section III.C), women in places positively impacted by
the cotton revolution earned a sustained “wage” premium over long periods of time. This
made cotton textile production exceptional.
The baseline analysis suggests that the economic value of female labor is related to the
formation of cultural beliefs of women’s worth. Is the relationship between the economic
value of female labor linear? As one of the component of sex ratio at birth is the economic
value of having daughters, a linear relationship between past economic value of female labor
and the present value of daughters likely suggests a level of persistence in the skill and ability
of women that could shape the decision of sex selection.
This is not what we find. Instead, we find a non-linear relationship between past economic
value of female labor and sex ratio at birth in the present. One interpretation is that relative
female income has to reach a threshold level for beliefs to update. This implies that cultural
beliefs about women’s worth are sticky and possibly binary.
Below I compare cotton textile production to other types of economic activities performed
by women. Appendix F includes a comparison of the cotton revolution to the Black Death,
after which female labor force participation increased but relative female income remained
low.
D.1 Cotton Cultivation
Women participated in the cultivation of cotton (“raw cotton”). Raw cotton is first spun
into yarn, yarn woven into cotton fabrics. The locations of cotton cultivation did not overlap
23
with the locations of cotton spinning or weaving.37
I do not find a significant relationship
between cotton cultivation and sex ratio at birth (column 1). In column 2, I include both
cotton textiles (1300-1840) and cotton cultivation, and use a dummy variable of raw cotton
in column 3. In both cases, the coefficient estimate of cotton textiles (1300-1840) does not
vary much from the baseline estimate.
D.2 Tea Production
Qian (2008) shows that a short-term increase in tea prices increases the share of sur-
viving girls likely by enhancing women’s household bargaining power. The extent to which
tea picking involves female labor varies. Tea production is the most prevalent in southern
provinces (See Appendix A for a map of tea suitability). I include tea suitability in column 4
and find no significant effects. In column 5, I include both cotton textile production and tea
production, and find the coefficient estimate of cotton textiles (1300-1840) to be very similar
to the baseline estimate. In column 6, I replace the continuous variable of tea production
with a dummy variable, and find very similar results. In comparison with cotton textile pro-
duction, tea production was more seasonal and occasional, and did not generate as a stable
cash flow. This is consistent with the hypothesis that relative female income has to reach a
threshold value to be able to transform cultural beliefs about women’s worth.
D.3 Rice Cultivation
Women participated in rice cultivation. However, just like wheat agriculture, rice agri-
culture was plough-based and required male upper body strength. Overall, I do not find a
significant relationship between rice suitability and sex ratio at birth (column 7). In column
8, I include both cotton textile production and rice suitability, which produces a coefficient
estimate of cotton textile production that is highly similar to the baseline estimate. When a
dummy variable is used, rice suitability has a negative and insignificant coefficient, and cotton
textile production continues to have a coefficient estimate of -3.7. Wetland rice suitability in
GAEZ v3.0 is used for this exercise, but results are robust to using other measures of rice
suitability.38
37
See Appendix A for a map of cotton suitability. Regions specialized in cotton cultivation or in spinning
and weaving. The US South specialized in cotton cultivation, when the UK specialized in the manufacture of
cotton. FAO provides cotton suitability data at the level of 5 arc-minute grid cells (10km*10km). Consistent
with other suitability measures used in this study, I use “agro-climatically attainable yield for intermediate-
input-level, rain-fed cotton for baseline period 1961-1990” as my measure of cotton suitability.
38
GAEZ v3.0 has a composite measure for wetland rice. The map of wetland rice suitability closely matches
the actual cultivation and the traditional rice-wheat border as shown in Figure A.IIIb. GAEZ v3.0 also has
separate measures for indica dryland rice, indica wetland rice and Japonica wetland rice, among which Indica
dryland rice has a suitability of zero in China under both irrigation and rain-fed conditions. In GAEZ v2.0,
a measure of rice suitability, irrespective of specific types of rice, is available. When using this measure, the
coefficient estimate of being in rice-suitable areas is negative but not significant. Following Alesina, Giuliano,
and Nunn (2013), I define locations that obtain at least 40% of the maximum yield as suitable.
24
TableII:Low-vs.High-ValueWork
Dependentvariable:sexratioatbirthin2000
(1)(2)(3)(4)(5)(6)(7)(8)(9)(10)(11)
ContinuousContinuousDummyContinuousContinuousDummyContinuousContinuousDummyDummyDummy
MeanofDep.Var.118.6118.6118.6118.6118.6118.6118.6118.6118.6118.6118.6
Cottontextiles(1300-1840)-3.719∗∗∗-3.635∗∗∗-3.731∗∗∗-3.731∗∗∗-3.727∗∗∗-3.740∗∗∗-3.785∗∗∗
(0.740)(0.741)(0.735)(0.735)(0.734)(0.737)(0.806)
Rawcotton-0.00177-0.000492-2.028
(0.00322)(0.00322)(1.654)
Tea0.0005720.0007980.215
(0.00589)(0.00585)(1.671)
Rice0.0001030.0000652-0.323
(0.000395)(0.000390)(1.491)
Cotton/Silk/Hemptextiles-1.695∗∗0.0832
(0.822)(0.896)
BaselinecontrolsYesYesYesYesYesYesYesYesYesYesYes
ProvinceFEYesYesYesYesYesYesYesYesYesYesYes
SocioeconomicMacroregionFEYesYesYesYesYesYesYesYesYesYesYes
AdjustedR20.3580.3680.3680.3580.3680.3680.3580.3680.3680.3600.368
Observations14841484148414841484148414841484148414891489
Thetablereportstheresultsoftestingtheeffectsofhigh-valueworkvs.low-valuework.Theunitofobservationisacountyin2000
Census.Thedependentvariableissexratioatbirth.Columns1,4&7runregressionsonvarioustypesoflow-valuework.Other
columnsregresssexratioatbirthonbothcottontextileproductionandlow-valuework.Columns2,5&8usecontinuousvariables
ofcotton,teaandricesuitability.Columns3,6&9usedummies.BaselinecontrolsarethoseusedinColumn3ofbaseresults.
Standarderrorsinparentheses∗
p<0.10,∗∗
p<0.05,∗∗∗
p<0.01
25
D.4 Lower-Value Textile Work
Compared to cotton textile production, silk and hemp textile production typically yielded
a lower income. Hemp textiles both had a much lower unit value, and was produced in smaller
quantities. Silk produced at home was low-ended and similarly produced in small quantities.39
To separate the effects of high-value work from those of low-value work, I include a control
for the production of all types of textiles.40
I find that the production of textiles bears no
relationship with sex ratio at birth (column 2), once after controlling for cotton textiles.
E Post-1840 Political and Economic Shocks
E.1 Early Industrialization
Early industrialization began in China after 1840. The effects of early industrialization
could bias my results in the following ways: (a.) If counties positively impacted by the
cotton revolution were more likely to experience early industrialization after 1840, my results
would confound the effects of industrialization with those of the cotton revolution. One fact
counting against this is that industrialization in China was on a limited scale (Fairbank,
1978). During the late Qing and Republican era, much of the rural and hinterland China
continued to engage in household production and individuals maintained traditional lifestyles.
In 1933, almost a hundred years after the first treaty port was established in Shanghai, the
handicraft industry still made up for 61% of the total industry output. (b.) If women were
more likely to be part of the industrial workforce when they already worked at home, I
would not be able to disentangle the effects of the cotton revolution and the effects of female
labor force participation after 1840.41
Given that much of industrialization in 19th century
China took place in treaty ports (Jia, 2014), I include treaty port status as a proxy for early
industrialization, which is already in the baseline specification. Columns 1-3 of Table III show
coefficients of interest after controlling for or omitting treaty ports. Being a treaty port in the
19th c. indeed has an impact on sex ratio at birth. The interaction term between treaty port
status and cotton textiles (1300-1840) is close to zero and insignificant, suggesting that the
cotton revolution has no differential impact on sex ratio at birth by treaty port status. I also
drop all treaty ports in column 3 and this slightly increases the size of the main coefficient
estimate.
39
High-ended silk was produced at state-owned workshops in just a few urban areas. In these urban shops,
the work force was predominantly male.
40
To obtain information on other types of textiles, I construct a second variable from Wang (2006).
41
Section VI.C provides evidence that women in provinces more exposed to the cotton revolution were
more likely to work outside of the home at the onset of the industrialization. Goldin and Sokoloff (1982)
documents a substantial involvement of women in the industrialization of the American Northeast and a wage
increase for women relative to men.
26
E.2 Expansion of Christianity
As Christianity emphasizes the value of human life, expansion of Christianity in China
might have influenced constituted a source of variation in willingness to conduct sex selec-
tion. In the 19th and early 20th century, missionaries went to China to spread Christianity.
Christianity might have shaped both attitudes towards infanticide and gender-role attitudes.
Although the share of Chinese populations that were ever converted was small, they had a
disproportional influence on the rest of society (Bai and Kung, 2014).
To check the impact of Christianity, I first include the density of communicants in column
4. As expected, a greater share of communicants in the population is negatively associated
with sex ratio at birth. The size of the coefficient of interest increases by one-fifth, suggesting
that some of the effects of the cotton revolution might have been masked by missionary ac-
tivities. Counties without cotton textiles (1300-1840) had a higher density of communicants.
I interact the density of communicants with cotton textiles (1300-1840) in column 5. The
coefficient is positive for the interaction term, but not statistically significant. This implies
the effect of the cotton revolution is smaller for counties with a greater share of communi-
cants, and likewise, the effect of Christianity is smaller for counties positively impacted by
the cotton revolution. In column 6, I drop all counties with more than 10 communicants per
10,000 residents; the estimated coefficient slightly increases in size.
E.3 Post-1979 Economic Policies
A set of liberalization policies were implemented after 1979 to vitalize the economy. I
estimate the impact of economic liberalization on sex ratio at birth by exploiting the fact that
coastal regions had greater propensity for economic liberalization. Shortly after 1979, five
special economic zones were approved and they were all located on the coast. The Yangtze
Delta and the Pearl River Delta witnessed rapid export-led economic growth upon economic
liberalization. Are those regions are the same regions that had cotton textile (1300-1840).42
I already have per capita income in the baseline specification to control for the impact of
economic development; to account for other effects of post-1979 economic liberalization, I
add a control for the coastal region (column 7), interact the coastal region with cotton
textiles (1300-1840) (column 8) and drop the coastal region from the sample (column 9).
The estimated coefficient decreases, but only slightly, after the inclusion of the coastal region
dummy. In column 9 the coefficient size of interest increases by about a third.
42
Figure I suggests that both the Yangtze Delta and the Pearl River Delta are indeed associated with
cotton textile production.
27
TableIII:Post-1840PoliticalandEconomicShocks
Dependentvariable:sexratioatbirth
(1)(2)(3)(4)(5)(6)(7)(8)(9)(10)(11)
EarlyChristianityEconomicAllNone
IndustrializationLiberalization
MeanofDep.Var.118.6118.6119.1118.8118.8119.4118.6118.6118.8118.8118.8
Cottontextiles(1300-1840)-3.753∗∗∗-3.739∗∗∗-4.108∗∗∗-4.164∗∗∗-5.983∗∗∗-5.949∗∗∗-3.669∗∗∗-4.363∗∗∗-4.941∗∗∗-6.251∗∗∗-4.207∗∗∗
(0.731)(0.764)(0.766)(0.883)(1.415)(1.021)(0.730)(0.783)(0.798)(1.413)(0.881)
Treatyport-3.943∗∗∗-3.863∗∗∗-3.248∗∗-3.364∗∗-7.366∗∗∗-3.673∗∗∗-4.010∗∗∗-7.008∗∗∗-2.732-3.333∗∗
(1.043)(1.292)(1.468)(1.459)(1.997)(1.061)(1.060)(1.414)(2.045)(1.463)
Cottontextiles(1300-1840)
×Treatyport
-0.138-0.817
(1.929)(2.858)
Christianity-0.348-0.852∗-0.802∗
(0.382)(0.487)(0.480)
Cottontextiles(1300-1840)×Christianity
1.121∗0.858
(0.666)(0.675)
Coastal-2.288-4.843∗∗∗-6.164∗∗
(1.515)(1.822)(2.539)
Cottontextiles(1300-1840)×coastal
4.620∗∗6.197∗∗
(2.077)(3.085)
BaselinecontrolsYesYesYesYesYesYesYesYesYesYesYes
ProvinceFEYesYesYesYesYesYesYesYesYesYesYes
SocioeconomicYesYesYesYesYesYesYesYesYesYesYes
MacroregionFE
AdjustedR20.3680.3680.3920.3590.3600.3790.3690.3700.3660.3620.360
Observations148914891289993993766148914891260993993
Notes:ThetablereportstheimpactofCottontextiles(1300-1840)onsexratioatbirthaccountingforpoliticalandeconomic
shocks.Theunitofobservationisacountyin2000Census.Thedependentvariableissexratioatbirth.Baselinecontrolsarethose
usedincolumn3ofI.Christianityismeasuredbylog(communicantsper10,000+1).“onthecoast”referstoacountywithin50
kilometersofthecoast.Column3dropsalltreatyports.Column6dropsallcountieswithmorethan10outof10,000individuals
beingcommunicants.Column9dropsallcoastalcounties.Column10includeallinteractionterms.Column11includesonly
baselinecontrolsandusesthesamesampleasColumn10.Aspartofthebaselinecontrols,treatyportstatusandprovincialcapital
arecontrolledforinallspecifications.Robuststandarderrorsareincludedinallspecifications.Standarderrorsinparentheses∗
p<0.10,∗∗
p<0.05,∗∗∗
p<0.01.
28
Lastly, I include controls for all three large political and economic shocks and interacted
them with cotton textiles (1300-1840) in column 10. This results in a sample of 993 counties.
I find that if those shocks can be taken as exogenous, the cotton revolution is associated with
a reduction of sex ratio imbalances by 6.2 boys per 100 girls in places without exposure to
any of the shocks. Using the same sample but without controlling for those shocks, the main
coefficient estimate is 4.2 boys per 100 girls (column 11).
F Instrumental Variable Strategy
In spite of performing a number of robustness tests and accounting for large political
and economic shocks, I cannot rule out all possible sources of omitted variable bias. Below
I use an instrumental variable strategy that allow me to circumvent the problem of omitted
variable bias. A potential concern with the OLS estimates is selectivity into the adoption
of new textile technologies. If these counties had a highly level of gender equality, or more
likely have accomplished gender equality later even in the absence of the cotton revolution,
this would bias the OLS estimates away from zero. A set of variables (agricultural suitability,
log population density, proximity to the Grand Canal or Yangtze, distance to the coast,
ruggedness and socioeconomic macroregion fixed effects) have been included in the baseline
specification, to account for factors such as economic geography. In addition, an instrumental
variable strategy helps to address measurement error. Due to the nature of historical data,
my estimates suffers attenuation bias due to measurement error in the explanatory variable.
F.1 Logic of the Instrument
A few factors are known to be crucial for cotton spinning and weaving, one of which
is a suitable range of relative humidity. Scientists, engineers and industry experts highlight
the importance of relative humidity in producing cotton textiles. Lewis (1913) devotes its
entire length to physical testings of cotton yarns. An extended analysis is provided on how
yarn-count, twist and tensile strength vary by relative humidity. In a report on the textile
industry in China (1909), the word “humidity” occurs more than 100 times, suggesting the
pivotal role of humidity in textile manufacturing. Cotton weaving depends crucially on a
suitably wet climate. Lander (1914) provides a vivid account of how relative humidity makes
a good day or a bad day for cotton weaving:
“It is well-known fact that on certain days weaving is more difficult than on others,
and this difficulty is generally associated with a dry, east wind. On such occa-
sions weaving is difficult even with the bulbs in the factory showing a percentage
humidity which would be considered ample on an average day”.
When spinning and weaving is carried out in unfavorable climates, finished cloth is of much
29
poorer quality. Low humidity has a substantially impact on high-ended cotton cloth; high-
quality cotton cloth can only be produced when relative humidity is greater than 70%.
The possession of a spinning wheel or a weaving loom entails a fixed cost; it helps to justify
the cost if the equipment is used frequently. Many parts of China have dry winters, which
lowers cotton textile output for those months. Likewise, dry afternoons lower cotton textile
output. Since the bulk of spinning and weaving was performed in the daytime, humidity in
the daytime (rather than at night) matters the most. To capture seasonal and within-24-
hour variance in weaving suitability, I use both monthly and hourly information on relative
humidity.
The advantage of having a relative humidity index highly specific to cotton weaving is
that I can avoid spurious correlations as relative humidity could be correlated with suitability
for other economic activities. Also, because cotton textile output increases in the relative
humidity index, it provides more precise information about women’s productivity than the
treatment variable used in OLS regressions, which is a binary variable.
F.2 Construction of the Instrument
I construct a relative humidity index pertaining to suitability for cotton weaving. The
index is termed the “Humidity-for-Weaving” Index. The first set of data is the 30-year
monthly average relative humidity series from the Climate Research Unit of University of
East Anglia. Those data are available across 10 arc-minute by 10 arc-minute grid cells
(20km*20km) globally. The second set of data is the 6-hour relative humidity series from the
National Oceanic and Atmospheric Administration where relative humidity was measured
four times a day (6am, 12pm, 6pm and 12am) from 1981 to 2010. This data is at a higher
frequency but with a lower resolution (2.5 degree by 2.5 degree).
I take the following steps to construct the Humidity-for-Weaving Index: Step one, I
compute the ratio between daytime humidity (6am, 12pm and 6pm) and full-day relative
humidity using the low-resolution, high-frequency data. Step two, I back out monthly daytime
humidity using the high-resolution data on monthly average relative humidity. Step three,
I obtain the distance between monthly daytime humidity and optimal humidity for cotton
weaving. Based on Stamper and Koral (1979) and Iqbal et al. (2012), cotton weaving is
possible when relative humidity is between 60% and 85%.43
I take the distance between
daytime humidity and 85%. The maximum distance is therefore 25%. Suitability for cotton
weaving decreases in the distance to optimal humidity. Step four, I aggregate obtained
monthly values over twelve months. Step five, I take the inverse of the total to create a
43
See Appendix D.1 for the range of sources on the relationship between relative humidity and cotton
spinning and weaving.
30
Humidity-for-Weaving Index such that the index increases in suitability for cotton weaving,
and multiple it by 1,000. The index values range from 3.379 to 15.124. Figure II shows the
distribution of the Humidity-for-Weaving Index at a county level in eight quantiles. Darker
shades represent higher relative humidity and hence, higher suitability for cotton weaving.
Missing values are shaded white. The finer details of the construction procedure are available
in Appendix D.1.
Figure II: Humidity-for-Weaving Index
F.3 Validity of the Instrument
For the instrumental variable strategy to work, the Humidity-for-Weaving Index has to
affect long-run outcomes only through the cotton revolution. The Humidity-for-Weaving
Index is intended to capture ideal conditions for cotton weaving. To ensure that relative
humidity was not correlated with how productive it was to pursue other economic activities,
I regress the Humidity-for-Weaving Index on other types of textiles. I show in Table IV that
the instrument is strongly correlated with the spinning and weaving of cotton (column 1),
but not with that of all types of raw material (hemp, silk and etc.) once controlling for
cotton textiles (column 2). This is to be expected because the technical specifications for the
production of other types pf textiles are very different. Silk is ideally weaved at a relative
humidity of 60 to 70% (Stamper and Koral, 1979). The same source lists suggested ranges
31
Table IV: The Impact of the Humidity-for-Weaving Index on Other Activities
(1) (2) (3)
Cotton Textiles Silk/hemp Raw
(1300-1840) Textiles cotton
Mean of Dep. Var. 0.478 0.784 0.555
Humidity-for-Weaving Index 0.0408∗∗∗
-0.00204 -0.0185∗∗
(0.0109) (0.00874) (0.00857)
Baseline controls Yes Yes Yes
Province FE Yes Yes Yes
Socioeconomic Macroregion FE Yes Yes Yes
Adjusted R2
0.441 0.445 0.715
Observations 1483 1483 1478
Notes: The table reports falsification tests of the Humidity-for-Weaving Index. The unit of
observation is a county in the 2000 Census. All controls in column 3 of Table I are included,
with the exception of the one that is the dependent variable in that specification. Socioeconomic
macroregion and province fixed effects are included in all specifications. Robust standard errors
are included in all specifications. Standard errors in parentheses ∗
p < 0.10, ∗∗
p < 0.05, ∗∗∗
p < 0.01
of relative humidity for other types of textiles, such as 50 to 55% RH for weaving woolens
and 55 to 70% RH for weaving worsteds. I also show that the Humidity-for-Weaving Index
is negatively correlated with suitability for raw cotton (column 3).
To create a more exogenous source of variation in cotton textiles (1300-1840), I use the
interaction between the Humidity-for-Weaving Index and distance to the center of national
market (Suzhou) as my second instrument. The construction of the second instrument follows
Pearl (2000). The distance to the center of national market itself is not a perfect instrument,
since distance to the center of national market could affect modern gender inequality through
past development. According to Pearl (2000), however, the interaction term between non-
instrumental variables can still be an effective instrument.
F.4 Instrumental Variable Results
I begin my IV estimation by testing the relationship between my instruments and cotton
textiles (1300-1840). Because my treatment variable is binary, I use Probit-2SLS as my esti-
mation strategy. Probit-2SLS is a three-stage procedure recommended in Wooldridge (2002,
pp.623-626). It uses a Probit model for the first stage.44
The purpose of using this estimation
strategy is to properly model the relationship between the Humidity-for-Weaving Index and
cotton textiles (1300-1840) in order to best mitigate the problem of weak instruments due to
44
The full procedure is as follows: first, use Probit to regress the treatment on the instrument and exogenous
variables; second, use the predicted values from the first step in the first stage of a regular 2SLS procedure,
together with the exogenous variables; third, run the second stage as in a regular 2SLS procedure.
32
Table V: Cotton Revolution and Sex Ratio at Birth: Instrumental Variable Analysis
(1) (2) (3) (4)
OLS IV OLS IV
Humidity-for-Weaving Index Humidity-for-Weaving Index (inverse)
× log(dist. to Suzhou)
Panel A: 2SLS
Dependent variable: sex ratio at birth in 2000
Mean of Dep. Var. 118.7 118.7 118.7 118.7
Cotton textiles (1300-1840) -3.800∗∗∗
-6.368∗∗
-3.991∗∗∗
-4.757∗
(0.730) (3.197) (0.726) (2.731)
Adjusted R2
0.364 0.360 0.373 0.372
Panel B: Probit
Dependent variable: cotton textiles (1300-1840)
Humidity-for-Weaving Index 0.255∗∗∗
( 0.553)
Humidity-for-Weaving Index (inverse) -3.3680∗∗∗
× log(dist. to Suzhou) ( 0.605)
Pseudo R2
0.417 0.428
Humidity-for-Weaving Index No No Yes Yes
Log(dist. to Suzhou) No No Yes Yes
Baseline controls Yes Yes Yes Yes
Province FE Yes Yes Yes Yes
Socioeconomic Macroregion FE Yes Yes Yes Yes
Observations 1467 1467 1467 1467
Notes: The table reports Probit-2SLS estimates. The unit of observation is a county in the
2000 Census. The dependent variable is sex ratio at birth. The full procedure has three stages.
First-stage (Probit) and third-stage (2SLS) results are summarized in the table. The second
stage is to calculate the predicted probability of cotton textile production. Baseline controls are
the same as in column 3 of Table I. Robust standard errors are included in all specifications.
Standard errors in parentheses * p < 0.10, ** p < 0.05, *** p < 0.01
omitted nonlinearity (D. J. Henderson and Parmeter, 2015).45
Panel A of Table V shows the estimates from the first stage: the instrument is positively
correlated with cotton textiles (1300-1840). The second stage is to calculate the predicted
probability of cotton textiles. The third stage is to regress sex ratio at birth on the predicted
probability of cotton textiles. Third-stage results are reported in Panel B. Column 1 contains
45
D. J. Henderson and Parmeter (2015) shows that instruments that may be strong in a nonlinear re-
lationship with the treatment could be weak when a linear relationship is imposed upon. An alternative
method to address nonlinearities is to use a nonparametric instrument. However, Newey (2013) shows that
nonparametric IV estimation only works well when the instrument is very strong. When the reduced form
R2
is low, and a linear IV slope can be estimated, the variance of the coefficients of nonlinear terms will be
very high.
33
my OLS estimates. Column 2 reports my IV estimate with the Humidity-for-Weaving Index
being the instrument. My IV estimate is that a one-standard-deviation increase in cotton
textiles (1300-1840) leads to a reduction of sex ratio at birth by 3.184 boys per 100 girls
(3.184=6.368*0.49). In columns 3-4, I use the interaction term of the Humidity-for-Weaving
Index and the natural log of the distance to Suzhou as the instrument and include all baseline
controls as well as the main effect of the Humidity-for-Weaving index and that of the distance
to Suzhou. The use of this instrument yields IV estimates that are highly comparable to OLS
estimates (-4.757 and -3.991).
For robustness, I estimate the same regressions with (a.) a Humidity-for-Weaving Index
constructed from full-day relative humidity and (b.) a Humidity-for-Weaving Index with a
cutoff of 80% relative humidity (see Appendix D.3).
VI The Emergence and Persistence of Gender-Equitable
Beliefs
A Modern Evidence on Gender-Equitable Beliefs
Having shown the relationship between the cotton revolution and a reveal preference
measure of cultural beliefs about women’s worth, I turn to more subjective measures. CGSS
2010 (Chinese General Social Surveys) is the first survey to contain questions directly related
to gender-equitable beliefs.
The first measure of gender-equitable beliefs is constructed from each respondent’s view
of the following question: “Do you agree with the following statement: men are naturally
more capable than women?” The second measure comes from the question: “Do you agree
with the following statement: men should focus on career; women should focus on family?”
The respondent can choose from a scale of 1 to 5 ranging from “completely disagree” to
“completely agree”. I create a measure from two questions on the subjective assessment of
how many sons and daughters one wants to have. For those who answer they want more
daughters than sons, daughter preference takes on the value of one. For those who are
indifferent between sons and daughters, i.e. they want the same number of sons and daughters,
and those who want more sons than daughters, daughter preference takes on the value of zero.
In addition, the CGSS includes information on age group, gender, urban/rural site, marital
status, education attainment, communist party member status and urban hukou. I restrict
the sample to the same geographic coverage as in the main sample (Section V).
34
TableVI:Gender-EquitableBeliefs:EvidencefromCGSS
MennaturallymorecapableWomenfocusonfamilyDaughterpreference
(1)(2)(3)(4)(5)(6)(7)(8)(9)
OLSOLSLogit
MeanofDep.Var.2.9893.0063.0063.6383.6593.6580.09830.09750.0975
Cottontextiles(1300-1840)-0.165∗∗
-0.244∗∗∗
-0.239∗∗∗
-0.175∗∗
-0.195∗∗∗
-0.183∗∗∗
0.196∗∗∗
0.182+
0.200∗
(0.066)(0.061)(0.057)(0.073)(0.068)(0.061)(0.064)(0.116)(0.120)
IndividualcontrolsNoNoYesNoNoYesNoNoYes
ContemporarycontrolsYesYesYesYesYesYesYesYesYes
Historical&GeographicalcontrolsNoYesYesNoYesYesNoYesYes
SocioeconomicMacroregionFEYesYesYesYesYesYesYesYesYes
AdjustedR2
/PseudoR2
0.02590.02870.1020.05030.05350.1270.0120.0140.030
Observations645561616146646261686152639961056084
Notes:Thetablereportstheimpactofcottontextilesproduction(1300-1840)ongender-equitablebeliefs.Theunitofobservation
isasurveyrespondentinCGSS2010(ChineseGeneralSocialSurveys).Contemporary,historicalandgeographicalcontrolsarethe
sameasincolumn3ofTableI.Standarderrorsareclusteredatthecountylevel.Standarderrorsinparentheses+
p<0.15,∗
p<0.10,∗∗
p<0.05,∗∗∗
p<0.01
35
High-Value Work and the Rise of Women: The Cotton Revolution and Gender Equality in China

More Related Content

Similar to High-Value Work and the Rise of Women: The Cotton Revolution and Gender Equality in China

An Essay On Environmental Pollution
An Essay On Environmental PollutionAn Essay On Environmental Pollution
An Essay On Environmental PollutionJulia Slater
 
Food security environmentalquality
Food security environmentalqualityFood security environmentalquality
Food security environmentalqualityTan Pham
 
Rachel carson book promo
Rachel carson book promoRachel carson book promo
Rachel carson book promoCheryl Lans
 
An Essay On Women. Essay women development
An Essay On Women. Essay women developmentAn Essay On Women. Essay women development
An Essay On Women. Essay women developmentLadonna Mayer
 
ProPoor_Poverty2039Scenarios (1)
ProPoor_Poverty2039Scenarios (1)ProPoor_Poverty2039Scenarios (1)
ProPoor_Poverty2039Scenarios (1)hfrey
 
The 19th century world
The 19th century worldThe 19th century world
The 19th century worldApril Janine
 
Online Paper Writing. Online assignment writing service.
Online Paper Writing. Online assignment writing service.Online Paper Writing. Online assignment writing service.
Online Paper Writing. Online assignment writing service.Jessica Cannella
 
From Mary to Modern Woman The Material Basis of Marianis
 From Mary to Modern Woman The Material Basis of Marianis From Mary to Modern Woman The Material Basis of Marianis
From Mary to Modern Woman The Material Basis of MarianisMargaritoWhitt221
 
Essay About Racism And Discrimination
Essay About Racism And DiscriminationEssay About Racism And Discrimination
Essay About Racism And DiscriminationBrenda Bradley
 
Industrial Revolution Presentation (history grade 12)
Industrial Revolution Presentation (history grade 12)Industrial Revolution Presentation (history grade 12)
Industrial Revolution Presentation (history grade 12)Amanda Iliadis
 
How To Write The Perfect College Essay
How To Write The Perfect College EssayHow To Write The Perfect College Essay
How To Write The Perfect College EssayAmber Moore
 
Analysis on “The Case for Contamination”
Analysis on “The Case for Contamination”Analysis on “The Case for Contamination”
Analysis on “The Case for Contamination”Mario Miralles
 
Sc2218 lecture 4 (2010)
Sc2218 lecture 4 (2010)Sc2218 lecture 4 (2010)
Sc2218 lecture 4 (2010)socect
 
Introduction To The Federalist Teaching American History
Introduction To The Federalist  Teaching American HistoryIntroduction To The Federalist  Teaching American History
Introduction To The Federalist Teaching American HistoryAliyahh King
 

Similar to High-Value Work and the Rise of Women: The Cotton Revolution and Gender Equality in China (20)

An Essay On Environmental Pollution
An Essay On Environmental PollutionAn Essay On Environmental Pollution
An Essay On Environmental Pollution
 
Essay On Food Safety
Essay On Food SafetyEssay On Food Safety
Essay On Food Safety
 
Cultures_Conventions_HR_Women
Cultures_Conventions_HR_WomenCultures_Conventions_HR_Women
Cultures_Conventions_HR_Women
 
Food security environmentalquality
Food security environmentalqualityFood security environmentalquality
Food security environmentalquality
 
Rachel carson book promo
Rachel carson book promoRachel carson book promo
Rachel carson book promo
 
An Essay On Women. Essay women development
An Essay On Women. Essay women developmentAn Essay On Women. Essay women development
An Essay On Women. Essay women development
 
ProPoor_Poverty2039Scenarios (1)
ProPoor_Poverty2039Scenarios (1)ProPoor_Poverty2039Scenarios (1)
ProPoor_Poverty2039Scenarios (1)
 
The 19th century world
The 19th century worldThe 19th century world
The 19th century world
 
Online Paper Writing. Online assignment writing service.
Online Paper Writing. Online assignment writing service.Online Paper Writing. Online assignment writing service.
Online Paper Writing. Online assignment writing service.
 
Dictatorship Essay.pdf
Dictatorship Essay.pdfDictatorship Essay.pdf
Dictatorship Essay.pdf
 
From Mary to Modern Woman The Material Basis of Marianis
 From Mary to Modern Woman The Material Basis of Marianis From Mary to Modern Woman The Material Basis of Marianis
From Mary to Modern Woman The Material Basis of Marianis
 
Sustainable Development Essay
Sustainable Development EssaySustainable Development Essay
Sustainable Development Essay
 
Urban Cages and Domesticated Humans
Urban Cages and Domesticated Humans Urban Cages and Domesticated Humans
Urban Cages and Domesticated Humans
 
Essay About Racism And Discrimination
Essay About Racism And DiscriminationEssay About Racism And Discrimination
Essay About Racism And Discrimination
 
Industrial Revolution Presentation (history grade 12)
Industrial Revolution Presentation (history grade 12)Industrial Revolution Presentation (history grade 12)
Industrial Revolution Presentation (history grade 12)
 
How To Write The Perfect College Essay
How To Write The Perfect College EssayHow To Write The Perfect College Essay
How To Write The Perfect College Essay
 
Analysis on “The Case for Contamination”
Analysis on “The Case for Contamination”Analysis on “The Case for Contamination”
Analysis on “The Case for Contamination”
 
Sc2218 lecture 4 (2010)
Sc2218 lecture 4 (2010)Sc2218 lecture 4 (2010)
Sc2218 lecture 4 (2010)
 
Introduction To The Federalist Teaching American History
Introduction To The Federalist  Teaching American HistoryIntroduction To The Federalist  Teaching American History
Introduction To The Federalist Teaching American History
 
Essay Industrial Revolution
Essay Industrial RevolutionEssay Industrial Revolution
Essay Industrial Revolution
 

More from Stockholm Institute of Transition Economics

The Russia sanctions as a human rights instrument: Violations of export contr...
The Russia sanctions as a human rights instrument: Violations of export contr...The Russia sanctions as a human rights instrument: Violations of export contr...
The Russia sanctions as a human rights instrument: Violations of export contr...Stockholm Institute of Transition Economics
 
Unemployment and Intra-Household Dynamics: the Effect of Male Job Loss on Int...
Unemployment and Intra-Household Dynamics: the Effect of Male Job Loss on Int...Unemployment and Intra-Household Dynamics: the Effect of Male Job Loss on Int...
Unemployment and Intra-Household Dynamics: the Effect of Male Job Loss on Int...Stockholm Institute of Transition Economics
 

More from Stockholm Institute of Transition Economics (20)

IT sector development fading | Belarus Conference in Stockholm
IT sector development fading | Belarus Conference in StockholmIT sector development fading | Belarus Conference in Stockholm
IT sector development fading | Belarus Conference in Stockholm
 
Corisk Sanctions of Russia | Belarus Conference in Stockholm
Corisk Sanctions of Russia | Belarus Conference in StockholmCorisk Sanctions of Russia | Belarus Conference in Stockholm
Corisk Sanctions of Russia | Belarus Conference in Stockholm
 
Selected Economic Effects of Sanctions | Belarus Conference in Stockholm
Selected Economic Effects of Sanctions | Belarus Conference in StockholmSelected Economic Effects of Sanctions | Belarus Conference in Stockholm
Selected Economic Effects of Sanctions | Belarus Conference in Stockholm
 
Belarusian Economy 2024 | Conference in Stockholm
Belarusian Economy 2024 | Conference in StockholmBelarusian Economy 2024 | Conference in Stockholm
Belarusian Economy 2024 | Conference in Stockholm
 
Tracking sanctions compliance | SITE 2023 Development Day conference
Tracking sanctions compliance | SITE 2023 Development Day conferenceTracking sanctions compliance | SITE 2023 Development Day conference
Tracking sanctions compliance | SITE 2023 Development Day conference
 
War and Trade in Eurasia | SITE 2023 Development Day conference
War and Trade in Eurasia | SITE 2023 Development Day conferenceWar and Trade in Eurasia | SITE 2023 Development Day conference
War and Trade in Eurasia | SITE 2023 Development Day conference
 
Reducing the Russian Economic Capacity and support Ukraine
Reducing the Russian Economic Capacity and support UkraineReducing the Russian Economic Capacity and support Ukraine
Reducing the Russian Economic Capacity and support Ukraine
 
Energy sanctions - What else can be done?
Energy sanctions - What else can be done?Energy sanctions - What else can be done?
Energy sanctions - What else can be done?
 
How should policy be designed during energy-economic warfare?
How should policy be designed during energy-economic warfare?How should policy be designed during energy-economic warfare?
How should policy be designed during energy-economic warfare?
 
The impact of the war on Russia’s fossil fuel earnings
The impact of the war on Russia’s fossil fuel earningsThe impact of the war on Russia’s fossil fuel earnings
The impact of the war on Russia’s fossil fuel earnings
 
The Russia sanctions as a human rights instrument: Violations of export contr...
The Russia sanctions as a human rights instrument: Violations of export contr...The Russia sanctions as a human rights instrument: Violations of export contr...
The Russia sanctions as a human rights instrument: Violations of export contr...
 
SITE 2022 Development Day conference program
SITE 2022 Development Day conference programSITE 2022 Development Day conference program
SITE 2022 Development Day conference program
 
SITE 2022 Development Day conference | Program
SITE 2022 Development Day conference | ProgramSITE 2022 Development Day conference | Program
SITE 2022 Development Day conference | Program
 
Program | SITE 2022 Development Day conference
Program | SITE 2022 Development Day conferenceProgram | SITE 2022 Development Day conference
Program | SITE 2022 Development Day conference
 
Ce^2 Conference 2022 Programme
Ce^2 Conference 2022 ProgrammeCe^2 Conference 2022 Programme
Ce^2 Conference 2022 Programme
 
Ce2 Worksop & Conference 2022 Program
Ce2 Worksop & Conference 2022 ProgramCe2 Worksop & Conference 2022 Program
Ce2 Worksop & Conference 2022 Program
 
Ce^2 Conference 2022 Program
Ce^2 Conference 2022 ProgramCe^2 Conference 2022 Program
Ce^2 Conference 2022 Program
 
(Ce)2 Workshop program (preliminary)
(Ce)2 Workshop program (preliminary)(Ce)2 Workshop program (preliminary)
(Ce)2 Workshop program (preliminary)
 
Unemployment and Intra-Household Dynamics: the Effect of Male Job Loss on Int...
Unemployment and Intra-Household Dynamics: the Effect of Male Job Loss on Int...Unemployment and Intra-Household Dynamics: the Effect of Male Job Loss on Int...
Unemployment and Intra-Household Dynamics: the Effect of Male Job Loss on Int...
 
Football, Alcohol and Domestic Abuse
Football, Alcohol and Domestic AbuseFootball, Alcohol and Domestic Abuse
Football, Alcohol and Domestic Abuse
 

Recently uploaded

Mira Road Memorable Call Grls Number-9833754194-Bhayandar Speciallty Call Gir...
Mira Road Memorable Call Grls Number-9833754194-Bhayandar Speciallty Call Gir...Mira Road Memorable Call Grls Number-9833754194-Bhayandar Speciallty Call Gir...
Mira Road Memorable Call Grls Number-9833754194-Bhayandar Speciallty Call Gir...priyasharma62062
 
05_Annelore Lenoir_Docbyte_MeetupDora&Cybersecurity.pptx
05_Annelore Lenoir_Docbyte_MeetupDora&Cybersecurity.pptx05_Annelore Lenoir_Docbyte_MeetupDora&Cybersecurity.pptx
05_Annelore Lenoir_Docbyte_MeetupDora&Cybersecurity.pptxFinTech Belgium
 
VIP Independent Call Girls in Bandra West 🌹 9920725232 ( Call Me ) Mumbai Esc...
VIP Independent Call Girls in Bandra West 🌹 9920725232 ( Call Me ) Mumbai Esc...VIP Independent Call Girls in Bandra West 🌹 9920725232 ( Call Me ) Mumbai Esc...
VIP Independent Call Girls in Bandra West 🌹 9920725232 ( Call Me ) Mumbai Esc...dipikadinghjn ( Why You Choose Us? ) Escorts
 
The Economic History of the U.S. Lecture 19.pdf
The Economic History of the U.S. Lecture 19.pdfThe Economic History of the U.S. Lecture 19.pdf
The Economic History of the U.S. Lecture 19.pdfGale Pooley
 
The Economic History of the U.S. Lecture 23.pdf
The Economic History of the U.S. Lecture 23.pdfThe Economic History of the U.S. Lecture 23.pdf
The Economic History of the U.S. Lecture 23.pdfGale Pooley
 
Kharghar Blowjob Housewife Call Girls NUmber-9833754194-CBD Belapur Internati...
Kharghar Blowjob Housewife Call Girls NUmber-9833754194-CBD Belapur Internati...Kharghar Blowjob Housewife Call Girls NUmber-9833754194-CBD Belapur Internati...
Kharghar Blowjob Housewife Call Girls NUmber-9833754194-CBD Belapur Internati...priyasharma62062
 
Booking open Available Pune Call Girls Shivane 6297143586 Call Hot Indian Gi...
Booking open Available Pune Call Girls Shivane  6297143586 Call Hot Indian Gi...Booking open Available Pune Call Girls Shivane  6297143586 Call Hot Indian Gi...
Booking open Available Pune Call Girls Shivane 6297143586 Call Hot Indian Gi...Call Girls in Nagpur High Profile
 
Stock Market Brief Deck (Under Pressure).pdf
Stock Market Brief Deck (Under Pressure).pdfStock Market Brief Deck (Under Pressure).pdf
Stock Market Brief Deck (Under Pressure).pdfMichael Silva
 
The Economic History of the U.S. Lecture 30.pdf
The Economic History of the U.S. Lecture 30.pdfThe Economic History of the U.S. Lecture 30.pdf
The Economic History of the U.S. Lecture 30.pdfGale Pooley
 
Solution Manual for Financial Accounting, 11th Edition by Robert Libby, Patri...
Solution Manual for Financial Accounting, 11th Edition by Robert Libby, Patri...Solution Manual for Financial Accounting, 11th Edition by Robert Libby, Patri...
Solution Manual for Financial Accounting, 11th Edition by Robert Libby, Patri...ssifa0344
 
The Economic History of the U.S. Lecture 20.pdf
The Economic History of the U.S. Lecture 20.pdfThe Economic History of the U.S. Lecture 20.pdf
The Economic History of the U.S. Lecture 20.pdfGale Pooley
 
Call Girls in New Friends Colony Delhi 💯 Call Us 🔝9205541914 🔝( Delhi) Escort...
Call Girls in New Friends Colony Delhi 💯 Call Us 🔝9205541914 🔝( Delhi) Escort...Call Girls in New Friends Colony Delhi 💯 Call Us 🔝9205541914 🔝( Delhi) Escort...
Call Girls in New Friends Colony Delhi 💯 Call Us 🔝9205541914 🔝( Delhi) Escort...Delhi Call girls
 
( Jasmin ) Top VIP Escorts Service Dindigul 💧 7737669865 💧 by Dindigul Call G...
( Jasmin ) Top VIP Escorts Service Dindigul 💧 7737669865 💧 by Dindigul Call G...( Jasmin ) Top VIP Escorts Service Dindigul 💧 7737669865 💧 by Dindigul Call G...
( Jasmin ) Top VIP Escorts Service Dindigul 💧 7737669865 💧 by Dindigul Call G...dipikadinghjn ( Why You Choose Us? ) Escorts
 
Gurley shaw Theory of Monetary Economics.
Gurley shaw Theory of Monetary Economics.Gurley shaw Theory of Monetary Economics.
Gurley shaw Theory of Monetary Economics.Vinodha Devi
 
The Economic History of the U.S. Lecture 18.pdf
The Economic History of the U.S. Lecture 18.pdfThe Economic History of the U.S. Lecture 18.pdf
The Economic History of the U.S. Lecture 18.pdfGale Pooley
 
Call Girls Koregaon Park Call Me 7737669865 Budget Friendly No Advance Booking
Call Girls Koregaon Park Call Me 7737669865 Budget Friendly No Advance BookingCall Girls Koregaon Park Call Me 7737669865 Budget Friendly No Advance Booking
Call Girls Koregaon Park Call Me 7737669865 Budget Friendly No Advance Bookingroncy bisnoi
 
Solution Manual for Principles of Corporate Finance 14th Edition by Richard B...
Solution Manual for Principles of Corporate Finance 14th Edition by Richard B...Solution Manual for Principles of Corporate Finance 14th Edition by Richard B...
Solution Manual for Principles of Corporate Finance 14th Edition by Richard B...ssifa0344
 

Recently uploaded (20)

Mira Road Memorable Call Grls Number-9833754194-Bhayandar Speciallty Call Gir...
Mira Road Memorable Call Grls Number-9833754194-Bhayandar Speciallty Call Gir...Mira Road Memorable Call Grls Number-9833754194-Bhayandar Speciallty Call Gir...
Mira Road Memorable Call Grls Number-9833754194-Bhayandar Speciallty Call Gir...
 
05_Annelore Lenoir_Docbyte_MeetupDora&Cybersecurity.pptx
05_Annelore Lenoir_Docbyte_MeetupDora&Cybersecurity.pptx05_Annelore Lenoir_Docbyte_MeetupDora&Cybersecurity.pptx
05_Annelore Lenoir_Docbyte_MeetupDora&Cybersecurity.pptx
 
VIP Independent Call Girls in Bandra West 🌹 9920725232 ( Call Me ) Mumbai Esc...
VIP Independent Call Girls in Bandra West 🌹 9920725232 ( Call Me ) Mumbai Esc...VIP Independent Call Girls in Bandra West 🌹 9920725232 ( Call Me ) Mumbai Esc...
VIP Independent Call Girls in Bandra West 🌹 9920725232 ( Call Me ) Mumbai Esc...
 
The Economic History of the U.S. Lecture 19.pdf
The Economic History of the U.S. Lecture 19.pdfThe Economic History of the U.S. Lecture 19.pdf
The Economic History of the U.S. Lecture 19.pdf
 
The Economic History of the U.S. Lecture 23.pdf
The Economic History of the U.S. Lecture 23.pdfThe Economic History of the U.S. Lecture 23.pdf
The Economic History of the U.S. Lecture 23.pdf
 
Kharghar Blowjob Housewife Call Girls NUmber-9833754194-CBD Belapur Internati...
Kharghar Blowjob Housewife Call Girls NUmber-9833754194-CBD Belapur Internati...Kharghar Blowjob Housewife Call Girls NUmber-9833754194-CBD Belapur Internati...
Kharghar Blowjob Housewife Call Girls NUmber-9833754194-CBD Belapur Internati...
 
Booking open Available Pune Call Girls Shivane 6297143586 Call Hot Indian Gi...
Booking open Available Pune Call Girls Shivane  6297143586 Call Hot Indian Gi...Booking open Available Pune Call Girls Shivane  6297143586 Call Hot Indian Gi...
Booking open Available Pune Call Girls Shivane 6297143586 Call Hot Indian Gi...
 
From Luxury Escort Service Kamathipura : 9352852248 Make on-demand Arrangemen...
From Luxury Escort Service Kamathipura : 9352852248 Make on-demand Arrangemen...From Luxury Escort Service Kamathipura : 9352852248 Make on-demand Arrangemen...
From Luxury Escort Service Kamathipura : 9352852248 Make on-demand Arrangemen...
 
Stock Market Brief Deck (Under Pressure).pdf
Stock Market Brief Deck (Under Pressure).pdfStock Market Brief Deck (Under Pressure).pdf
Stock Market Brief Deck (Under Pressure).pdf
 
The Economic History of the U.S. Lecture 30.pdf
The Economic History of the U.S. Lecture 30.pdfThe Economic History of the U.S. Lecture 30.pdf
The Economic History of the U.S. Lecture 30.pdf
 
Solution Manual for Financial Accounting, 11th Edition by Robert Libby, Patri...
Solution Manual for Financial Accounting, 11th Edition by Robert Libby, Patri...Solution Manual for Financial Accounting, 11th Edition by Robert Libby, Patri...
Solution Manual for Financial Accounting, 11th Edition by Robert Libby, Patri...
 
The Economic History of the U.S. Lecture 20.pdf
The Economic History of the U.S. Lecture 20.pdfThe Economic History of the U.S. Lecture 20.pdf
The Economic History of the U.S. Lecture 20.pdf
 
(Vedika) Low Rate Call Girls in Pune Call Now 8250077686 Pune Escorts 24x7
(Vedika) Low Rate Call Girls in Pune Call Now 8250077686 Pune Escorts 24x7(Vedika) Low Rate Call Girls in Pune Call Now 8250077686 Pune Escorts 24x7
(Vedika) Low Rate Call Girls in Pune Call Now 8250077686 Pune Escorts 24x7
 
Call Girls in New Friends Colony Delhi 💯 Call Us 🔝9205541914 🔝( Delhi) Escort...
Call Girls in New Friends Colony Delhi 💯 Call Us 🔝9205541914 🔝( Delhi) Escort...Call Girls in New Friends Colony Delhi 💯 Call Us 🔝9205541914 🔝( Delhi) Escort...
Call Girls in New Friends Colony Delhi 💯 Call Us 🔝9205541914 🔝( Delhi) Escort...
 
( Jasmin ) Top VIP Escorts Service Dindigul 💧 7737669865 💧 by Dindigul Call G...
( Jasmin ) Top VIP Escorts Service Dindigul 💧 7737669865 💧 by Dindigul Call G...( Jasmin ) Top VIP Escorts Service Dindigul 💧 7737669865 💧 by Dindigul Call G...
( Jasmin ) Top VIP Escorts Service Dindigul 💧 7737669865 💧 by Dindigul Call G...
 
Gurley shaw Theory of Monetary Economics.
Gurley shaw Theory of Monetary Economics.Gurley shaw Theory of Monetary Economics.
Gurley shaw Theory of Monetary Economics.
 
The Economic History of the U.S. Lecture 18.pdf
The Economic History of the U.S. Lecture 18.pdfThe Economic History of the U.S. Lecture 18.pdf
The Economic History of the U.S. Lecture 18.pdf
 
Call Girls Koregaon Park Call Me 7737669865 Budget Friendly No Advance Booking
Call Girls Koregaon Park Call Me 7737669865 Budget Friendly No Advance BookingCall Girls Koregaon Park Call Me 7737669865 Budget Friendly No Advance Booking
Call Girls Koregaon Park Call Me 7737669865 Budget Friendly No Advance Booking
 
Solution Manual for Principles of Corporate Finance 14th Edition by Richard B...
Solution Manual for Principles of Corporate Finance 14th Edition by Richard B...Solution Manual for Principles of Corporate Finance 14th Edition by Richard B...
Solution Manual for Principles of Corporate Finance 14th Edition by Richard B...
 
Call Girls in New Ashok Nagar, (delhi) call me [9953056974] escort service 24X7
Call Girls in New Ashok Nagar, (delhi) call me [9953056974] escort service 24X7Call Girls in New Ashok Nagar, (delhi) call me [9953056974] escort service 24X7
Call Girls in New Ashok Nagar, (delhi) call me [9953056974] escort service 24X7
 

High-Value Work and the Rise of Women: The Cotton Revolution and Gender Equality in China

  • 1. High-Value Work and the Rise of Women: The Cotton Revolution and Gender Equality in China* Melanie Meng Xue„ Northwestern University December 2018 Abstract This paper studies a unique historical experiment: the cotton revolution and its impact on the emergence of gender-equitable beliefs. The cotton revolution led to a prolonged phase (1300-1840 AD) of high productivity for women. I hypothesize that a substantial, long-standing increase in relative female income can erode a highly resilient cultural belief: women are less capable than men. Using variation across 1,489 counties in cotton spinning and weaving, I first show that the cotton revolution reduced prenatal sex selection in 2000. This result is complemented by survey evidence on gender-equitable beliefs and robust to instrumenting cotton weaving with the range of relative humidity within which cotton yarn can be smoothly woven into cloth. I then document an initial impact of the cotton revolution on widow suicides in the 17th century. To further isolate the channel of gender-equitable beliefs, I estimate the effects of the cotton revolution under post-1949 state socialism, where both genders had similar economic opportunities, political and legal rights, and show that pre-1840 cotton weaving predicts a higher probability for the wife to head the household. In addition, I find that high-value work has a distinctive role in shaping gender-equitable beliefs. Low-value work performed by women, such as cotton cultivation, does not correct prenatal sex selection. Keywords: Culture, relative female income, gender-equitable beliefs JEL Codes: Z1 N35 J16 I1 *I thank Paula Giuliano and Joel Mokyr for their detailed comments and feedback. I also thank Douglas Almond, Matteo Cervellati, David de la Croix, Carl-Johan Dalgaard, Christian Dippel, Matthias Doepke, Lena Edlund, James Fenske, Raquel Fern´andez, Oded Galor, Claudia Goldin, Pauline Grosjean, Seema Jay- achandran, Peter Sandholt Jensen, Saumitra Jha, Mark Koyama, James Kung, John Nye, Jessica Pan, Nancy Qian, Thomas Rawski, Paul Seabright, Chris Udry, Bin Wong, Nico Voigtl¨ander, seminar and workshop participants at Arizona, Barcelona GSE Summer Forum, Bologna, Brown, Chapman, Copenhagen, “Deep Causes of Economic Development” (Utrecht), Northwestern, SUFE, Toulouse IAST, UC Davis, UCLA An- derson Brown Bag, UCLouvain, UNSW and audiences at ASREC, ASSA, Cliometrics Society, EHA, EHS, Institutional Analysis Workshop, NASMES, NEUDC, PacDev, WADES and WEHC. I acknowledge financial support from Donorstrust, the Balzan Foundation and the Center for Economic History at Northwestern. An earlier version of the paper is entitled “Textiles and the Historical Emergence of Gender Equality in China”. „Postdoctoral Fellow, Department of Economics, Northwestern University. 2211 Campus Drive, Evanston, IL 60208. Email: melanie.xue@northwestern.edu. Website: http://www.melaniexue.net/
  • 2. I Introduction Gender equality is usually viewed as a modern phenomenon. Economists have proposed several explanations for the expansion of economic and political rights for women in the past 200 years (Doepke and Tertilt, 2009; Doepke, Tertilt, and Voena, 2012; Fern´andez-Villaverde, Greenwood, and Guner, 2014). In this paper, I provide an alternative account of the rise of women by examining a unique historical experiment: the cotton revolution in the phase of proto-industrialization of China—a phase during which the productivity of women increased substantially and remained high relative to that of men. By examining the impact of this gender-asymmetric productivity revolution, this paper highlights the role of female labor productivity in the emergence of gender-equitable beliefs and its subsequent effect on gender equality. A key component of the cotton revolution was a one-time technological breakthrough in cotton textile production that took place after 1300 AD, the introduction of the multiple treadle-operated spindle-wheels. This device roughly doubled or tripled the productivity of female spinning operatives. By solving a crucial bottleneck in the production, in the area of spinning, the use of multiple treadle-operated spindle-wheels made weavers more productive. This breakthrough occurred in the context of a market economy and trading network and in the presence of political institutions that ensured that relative female income remained high for more than 500 years. In areas suitable for the spinning and weaving of cotton, women’s labor productivity far exceeded that in traditional agrarian societies. In reference to this cotton revolution, the historian of Chinese science, Joseph Needham noted that: “For more than 450 years Chinese cotton-spinning technology was therefore superior to the spinning methods used in any other country (Needham and Kuhn, 1988, p. 224). The cotton revolution was a substantial shock to the economic value of women’s work. The adoption of new spinning and weaving technologies led to production surpluses, which served as a basis for market exchange on a large scale. During this period, China accounted for one-third of the world’s population and between one-third and one-half of global GDP, and had a relatively well-integrated national and regional market economy (Shiue and Keller, 2007). By 1840, cotton textiles accounted for 24.4% of the domestic trade.1 Before 1300, women spun and wove, but they worked with fabrics sourced from plants with lower average yields per unit of land and used less productive technologies. They also spent time in agricultural fields, but their productivity in the field was lower than that of men. Between 1300 and 1840, after which date mechanized cotton textiles flooded into 1 Table A.XVII shows a breakdown of trading goods just before 1840. As much as 94,553,000 tael worth of cotton textiles were traded, second only to that of grain. 1
  • 3. China, women produced cotton textiles at home, and sold them to local, regional and national markets. This resulted in a “Golden Age” for female incomes. Women worked together with extended family groups and as in many traditional societies, weaving skills, along with the loom, were passed down across generations (Buckley and Boudot, 2017). Compared with other episodes of expansion of labor market opportunities for women, and in other parts of the world, the significance of the cotton revolution is that it boosted women’s incomes to a level comparable to or greater than those of their husbands.2 The ability to produce cotton textiles enabled women to become the major household income earners (B. Li, 1997). Anthropologist Marvin Harris postulates that male dominance was initially determined by male strength and their comparative advantage in warfare. Thus as warfare was taken over by professionals, inequalities between men and women became a matter of their relative contributions to economic production (Harris, 1993). In imperial China, when the cotton revolution took place around 1300 AD, it dramatically increased women’s contribution to economic production, providing an ideal context for an empirical examination of this claim. I formulate the hypothesis that the tradition of holding men more highly than women is deeply rooted in women’s relatively low contribution to economic production in the past. Society is used to assigning different values to different genders, and in many civilizations, there has been the perception that women are less capable than men and a culturally-determined belief that females are less valuable. I hypothesize that when women’s contribution to economic production becomes close to or above that of men, gender-equitable beliefs will emerge. To estimate the effects of the cotton revolution on gender inequality, I collect information about cotton textile production from county and prefecture gazetteers. Information available in those gazetteers allow me to construct a binary variable of cotton textiles at a county level for the period of 1300 to 1840. My main sample comprises a total of 1,489 counties. I link this data to my main outcome variable: sex ratio at birth, a revealed preference measure of cultural beliefs about women’s worth. Examining variation across counties, I find a strong negative relationship between the cotton revolution and the skewdness of the sex ratio at birth. The baseline estimates suggest that the cotton revolution is associated with a reduction of 3.7 boys per 100 girls in sex ratio at birth, or a quarter of its standard deviation. To ensure that my results are not driven by systematic differences between counties with and without cotton textiles (1300-1840), I use matched samples, cluster standard errors on different geographic units, address biases in gazetteer data, employ different subsamples and account for historical and modern confounders. I then check three different hypotheses raised 2 An optimistic estimate in Pomeranz’s 2002 work suggests that a woman who weaved could earn four times as much as does an unskilled male laborer. 2
  • 4. in previous work: plough agriculture, the Neolithic Revolution and loamy soil as determinants of gender inequality. Finally, I include one of the most stringent controls—language fixed effects—to only use variation within populations speaking the same language.3 Members of the same ethnic group, if exposed to the cotton revolution, would more likely develop gender-equitable beliefs. China experienced a series of political and economic shocks in the past two centuries. Many of those shocks had a profound impact on the economy and on society. I account for these intermediating events and their interactions with cotton textile production in my anal- ysis. Reassuringly, neither early industrialization, missionary activities, nor recent economic liberalization can explain away the effects of the cotton revolution. To establish causality, I instrument cotton textile production with a relative humidity index pertaining to weaving suitability. Relative humidity (%) played a key role in the production of cotton textiles. For the successful manufacture of cotton textiles, the fibers must contain a suitable amount of moisture. Based on several sources, the range of relative humidity suitable for cotton weaving is between 60% and 85%.4 Within this range, tensile strength increases in relative humidity (Lewis, 1913; Iqbal et al., 2012). The spinning and weaving of cotton, silk, hemp, wool and synthetics vary in their humidity requirements. Scientists and engineers have studied optimal humidity for each fabric (Stamper and Koral, 1979; Ananthanarayanan, 2013; Kut, 2014). I take the distance between actual and optimal humidity at a monthly level, and aggregate those values over months to build a Humidity-for- Weaving Index. Because relative humidity might affect conditions faced by women through other channels, I use the interaction between the Humidity-for-Weaving Index and distance to the center of national market as a second instrument to create a more exogenous source of variation. In both cases, IV estimates are comparable to the OLS estimates, with the second instrument providing an estimate closer to my OLS estimates, offering further assurance that the effects I find are causal. In tracing the mechanisms, I first establish that there was an initial impact of the cotton revolution on women. Using data collected from historical gazetteers, I find evidence that cotton textile production prevented widow suicide in the Ming Dynasty (1368-1644). One interpretation of the results is that women who were able to survive on their own incomes coped better with widowhood than did those who relied on their husband for their livelihood. Widows who were weavers maintained a decent standard of living and were highly respectable in their communities. Compared to widows elsewhere in the world, who were often isolated 3 Language fixed effects can also be included in other specifications. All the results carry through. 4 A humid climate makes cotton fibers more pliable, lowers the chance of breakages in the yarn and reduces dust in the air (Lewis, 1913; Lander, 1914; Farnie, 1979; Ananthanarayanan, 2013). 3
  • 5. and subject to assault and persecution, widows in parts of China were self-sufficient and economically independent. I subsequently examine gender inequality after 1840 to provide further evidence on the cultural transformation brought about by the cotton revolution. I find that in early 20th century China, a higher share of industrial workers were female in places where there used to be cotton textile production, and that under state socialism, which leveled the playing ground for men and women both politically and economically, the probability of a wife heading the household was higher in places positively impacted by the cotton revolution. This paper aims to understand the emergence of gender-equitable beliefs. There has been a shift in attitudes towards working mothers (Fern´andez, Fogli, and Olivetti, 2004) and attitudes towards premarital sex (Fern´andez-Villaverde, Greenwood, and Guner, 2014). However, certain aspects of gender norms and gender roles, such as the gender identity norm (Bertrand, Kamenica, and Pan, 2015), and in particular, a belief that women are less capable than men (Sarsons, 2015) have remained resilient. This study shows that when the relevant shock is large enough, the more resilient aspects of gender norms and gender roles can change. It suggests that the economic value of female labor seems to be a major ingredient in how society assigns different values to different genders. However, the relationship between the economic value of female labor, and the perception of women being inferior, appears to be non-linear. For instance, low-value work women performed in the past, such as cotton cultivation, has no impact on sex ratio at birth today, whereas high-value work does. One interpretation is that the perception of women being inferior only changes when the economic value of female labor reaches a sufficiently high level. There exists a discontinuity in the correspondence between the value of women’s work and the perception of them being inferior. This provides a possible explanation for why certain aspects of gender norms and gender roles have yet to adapt in spite of changing economic forces. Qian’s (2008) study finds a negative relationship between women’s incomes and sex ratios. In Qian’s framework, the economic effects of increasing female incomes improves survival rates for girls contemporaneously. In this paper I show that an exogenous, sizable increase in female incomes resulting from the cotton revolution led to the emergence of gender-equitable beliefs. The lag between the end of the treatment period and my main outcome—up to 160 years—is sufficiently long to enable me to disentangle the transitory effects of a change in relative female income—through an economic channel—from its lasting effects—through a cultural channel. Furthermore, since the relationship between past economic value of female labor and sex ratio at birth in 2000 is not linear. This further rules out a pure economic 4
  • 6. channel being the explanation of the correlation between the cotton revolution and sex ratio at birth in 2000. More specifically, when there is a small increase in historical relative female income, it does not reduce sex selection. I also show that gender-equitable beliefs emerged over the course of the cotton revolution, and that such beliefs can independently shape gender inequality after the economic effects of the cotton revolution are long gone. One strength of this setting is that the cotton revolution was a highly specific treatment. It allowed women to earn a substantial income, and increased their share of the total household income. But it was not accompanied by the type of macroeconomic dynamics that say, the British Industrial Revolution, was associated with. Cotton was spun and woven in the homes of women; it was organized around their extended families and similar technologies were employed throughout the period. Wealth accumulation due to the cotton revolution was limited, and economic gains were eroded by population growth. State-merchant relations and capital formation in imperial China took a very different path than in the West—there was no movement towards factory organization. In the absence of widespread economic and political changes, the identification of the effects of the cotton revolution on women and related channel becomes more feasible. Another strength of this setting is that there was a unified, centralized state in both historical and modern China, a feature highly useful for distinguishing the cultural channel from other possible channels. Constrained by centralized rule, formal institutions remained unchanged despite the cotton revolution. Also, the state eliminated local monopolies of violence as far as possible. This is a precondition for relative contributions to economic production, rather than physical strength, to take a central stage as the basis for gender inequality (Harris, 1993). China’s experience with state socialism in the 20th century can be exploited as a historical “laboratory” for isolating the role of culture. First, state socialism mandated labor force participation for both genders. This eliminated the explanatory power of economic differences in men and women. Next, given the high degree of centralization characteristic of state socialism, local economic and political institutions are not a function of voter preference. Hence, attitude towards women can only affect outcomes that are determined solely by private decisions. This allows me to measure the direct effects of more gender-equitable beliefs brought about by the cotton revolution.5 In comparison with modern field experiments, an advantage of this historical natural experiment is that the cotton revolution took place on a larger scale (Figure I). Also, due 5 In a usual setting, attitudes towards women can directly shape gender inequality by affecting private decisions, as well as indirectly shape those outcomes by first shaping women’s political and legal rights, educational and labor market outcomes. 5
  • 7. to universal in-kind taxation, a high percentage of the households engaged in textile work, which eliminates concerns for sorting in the marriage market and other general equilibrium effects. This paper is organized as follows. Section II sets forth the relations between my ar- gument and the related literature. Section III explains the historical context. Section IV discusses data sources and variable constructions. Section V summarizes my baseline esti- mates, robustness checks and an instrumental variable analysis. Section VI presents survey evidence on gender-equitable beliefs and its effects under various economic and political con- ditions, including state socialism. In Section VII, I discuss the interpretations of the results and a few caveats. Section VIII concludes the paper. II Related Literature The recent literature on gender equality has paid increasing attention to the role of culture and identity in determining gender inequality (Fortin, 2005; Fern´andez, 2007; Fern´andez and Fogli, 2009; Gneezy, Leonard, and List, 2009; Alesina, Giuliano, and Nunn, 2013; Bertrand, Kamenica, and Pan, 2015). Fern´andez (2007) and Fern´andez and Fogli (2009) find that cultural proxies have significant explanatory power for the work and fertility behavior of second-generation American women. Other studies find that differences in psychological traits between men and women are in fact rooted in culture. Gneezy, Leonard, and List (2009) find that women compete less, but only in patriarchal societies. Researchers have long been interested in how policy interventions can change gender norms. Few interventions have been shown to have a robust effect on gender norms. Both Beath, Christia, and Enikolopov (2012) and Windt, Humphreys, and Sierra (2018) find little or no evidence that placing women in leadership positions affects attitudes or behavior. This study focuses on an important aspect of gender-equitable beliefs, i.e. the perception of women being less capable, and shows that in the long run, high-value work opportunities can change such beliefs. This study also contributes to the broader literature on the historical determinants of cultural norms and beliefs. Many of these document the persistent impact of a negative shock on cultural values such as Nunn and Wantchekon’s (2011) work on the effects of the trans-Atlantic slave trade on corruption and trust today and Voigtl¨ander and Voth’s (2012) study on the persistence of antisemitic beliefs in Germany. My study is closely related to those papers that study how past economic factors have shaped contemporary gender norms such as that of Alesina, Giuliano, and Nunn (2013) who attribute conservative gender norms to the use of the plough which required upper body strength and Grosjean and Khattar (Forthcoming) who examine conservative gender norms and its origins in historical marriage 6
  • 8. market conditions in Australia.6 This study provides evidence that cultural norms persist under small and transitory shocks, but can indeed change in face of large and long-standing shocks. Although the main focus of this paper is not sex ratio imbalances, my analysis contributes to the literature on sex ratio imbalances by identifying an cultural factor in the skewdness of sex ratios. Sex ratio imbalances, especially in India and China, have become an important topic of policy debate and have attracted scholarly attention. Sex selection on a large scale is held to be responsible for a great share of the “missing women”.7 Almond, H. Li, and S. Zhang (Forthcoming) shows that rural land reform in China led to an increase in sex ratios. Sex selection is also present in developed countries. Daul and Moretti (2008) and Almond and Edlund (2008) find evidence for sex selection in the United States. Edlund (1999) explicitly models sex ratios in relation to son preference. Scholars have identified relative adult female earnings (Rosenzweig and Schultz, 1982; Gupta, 1987; Duflo, 2003; Qian, 2008; Carranza, 2014) and biological factors (Oster, 2005) as causes of sex ratio imbalances. This study takes one step further by investigating the origins of a culture of son preference. In addition, by reviewing the history of widow survival in China, this paper adds to the literature on “missing unmarried women” (S. Anderson and Ray, 2015; Miguel, 2005). III The Cotton Revolution and The Rise of Women Before 1300, silk and hemp were the two main fabrics used for clothing. High-quality silk was the most valued fabric. It was produced in a small number of urban shops, and demanded only by a small elite.8 Hemp was the predominant fiber for ordinary clothes. Wool was not available in China. Following a one-time technology breakthrough in cotton textile production, cotton gradu- ally replaced hemp and low-to-medium grade silk to become the dominant fiber for day-to-day clothes. Pre-existing political and economic institutions—such as the tax system—and ex- isting cultural norms, all of which were uniformly present across China proper, meant that 6 Other relevant studies include that of Jha (2013), who shows that cities in India that were medieval trading ports experienced significantly fewer religious riots between Muslims and Hindus in the period after 1850. Grosjean (2014) examines the persistence of a culture of honor among Americans of Scots-Irish descent. She finds that this culture of honor results in higher homicide rates among Scots-Irish in the US South and Mountain West but not elsewhere and argues that this culture has persisted only where formal institutions are comparatively weak. 7 See Das Gupta and Mari Bhat (1997), Arnold, Kishor, and Roy (2002), Ebenstein (2010), and Lin, Liu, and Qian (2014) 8 The production and consumption of high-quality silk involved a small and selected segment of the population. Silk accounted for 3% of the domestic trade, based on A.XVII. Only 7% of the Chinese population in Ming China was urban. 7
  • 9. women, rather than men, were spinners and weavers. Moreover, this technological break- through took place in a society that had well-functioning markets and a developed trade network. As a consequence, women, working in their own homes and with family members, were able to produce cotton textiles on a large scale for the market thereby earning incomes that far exceeded those available in past agrarian societies. The incomes their earned from cotton textile production enabled them to became major income earners within the household (B. Li, 1997). The production of cotton textiles, like that of other goods, was highly decentralized. Individual households owned the machinery, purchased raw cotton from the market, and sold finished cloth back to the market, which differed greatly from the British putting-out system (see Appendix F). Those households reaped most of the gains from their production. Despite the rapid expansion of cotton textile production, the growth was Smithian. There was little further technological innovation (Elvin, 1972). The level of output per capita stagnated due to the offsetting Malthusian forces of rapid population growth.9 China did not industrialize, or became a capitalistic economy, which is one of the most important stylized facts in economic history. China did not industrialize until at least 150 years after the British Industrial Revolution (“The Great Divergence”), and there has been a sizable literature in economic history investigating the causes of the Great Divergence. After 1840 China opened up its market to the West after its defeat in the first Opium War. Mechanized cotton textiles from the British Empire began to replace cotton textile handicraft produced by Chinese households. Household cotton textile production only began to collapse in the period between 1870–1910 due to competition from imported manufactured textiles (Myers, 1965, p. 621). Appendix F details the market structure and features of decentralized production during that period. A Initial Conditions In China as in much of the preindustrial world, textile production was carried out by women “who spent every available moment spinning, weaving, and sewing” (Barber, 1991). Spinning and weaving were deemed as womanly skills. From the Mianhua tu (Pictures of Cotton [Cultivation and Weaving]), first published in 1765, that women had an essential role in cotton textile production (Mann, 1997, pp.165-68). Women worked together in extended families. Spinning and weaving skills were transmit- ted intergenerationally, typically from mother to daughter. In those families, older women were weavers; younger women and girls were spinners. Through apprenticeship, younger 9 For a discussion of macroeconomic conditions and Malthusian stagnation during that period, see Ap- pendix F. 8
  • 10. women learned essential skills for textile work from older women. Compared with spinning, weaving was higher-paying and demanded more skills. The state was a major buyer for textiles through the economic institution of universal in- kind taxation. This institution mandated grain and textiles to be two major in-kind taxation items (Bray, 1997). Each household was responsible for producing both grain and textiles. Women specialized in producing textiles. Two main reasons for this were that (a.) women were far more productive in textile production than in plough-based grain production, for which male labor was essential; (b.) producing textiles complemented childcare duties, both of which took place within the home. By 1300 AD, when the cotton revolution took place, spinning and weaving had long been deemed as womanly skills. B Technological Improvements in 1300 Around 1300, Huang Dao Po, a Shanghai native (1245-1330 AD), acquired new spinning and weaving technologies from an ethnic group, known as the Li, residing on Hainan Island and brought them back to mainland China.10 The production of cotton textiles involves two processes: spinning and weaving. Raw cotton is spun into thread and yarn before cotton thread is woven into cloth. Due to the use of new spinning and weaving technologies, the production of cotton textiles on a large scale became feasible for the first time (Bray, 1997; G. Zhao, 1977). Huang Dao Po introduced a new spinning wheel that had three spindles. Spinning wheels, for a long time, had just one spindle. The new spinning wheel increased productivity by allowing women to use both their hands and their feet to keep the wheel spinning. Its technical design was comparable to that of the Spinning Jenny, which was invented in 18th century England and a predecessor to subsequent technologies used in textile manufacturing. The adoption of the new spinning wheel in 14th century China dramatically increased spinning productivity. This device roughly doubled or tripled the productivity of female spinning operatives. Workers using multiple treadle-operated spindle-wheels could produce between 500 and 1500 grams of yarn by operating up to five spindles at the time. Joseph Needham notes that until the British Industrial Revolution, “the technological standard of Chinese cotton manufacture had no parallel anywhere else in the world” (Needham and Kuhn, 1988, p. 223). Needham concludes that: “For more than 450 years Chinese cotton-spinning technology was therefore superior to the spinning methods used in any other country (Needham and Kuhn, 1988, p. 224). 10 Contemporary Li people still use those technologies for textile production. Finished cloth can purchased by tourists who visit Hainan Island. 9
  • 11. This resolved a bottleneck that previously prevented the the cotton textile industry from further increasing productivity–before the new spinning wheel was used, every weaver had to be matched with three to four spinners given the rate at which spinning took place. In addition, Huang also introduced new techniques for cotton fluffing and crushing and methods of weaving mixed cotton fabrics, colored fabrics and fabrics with mixed warp and weft fibers. Following this one-time technological breakthrough, cotton textile production expanded rapidly in the following centuries. Due to its durability, cotton replaced hemp and began to dominate the everyday clothing market. Other attractive features of cotton cloth include being effective in the cold weather, and offering higher yields per unit of land. 11 Demand for cotton was kept high by government demand, especially military demand for uniforms, and by expanding urban markets (Myers, 1965). According to Pomeranz (2000, p. 338), cotton textile production in 1750 was only slightly before that of Britain’s in 1800. C Labor Market Responses Given the importance of cotton textile production, and its immense scale, there should be strong labor market responses to increasing demand for cotton textiles, i.e. labor should be reallocated into the production of cotton textiles. Yet, such responses did not occur. Many characteristics of the imperial Chinese economy were responsible for a lack of labor market responses. Below I illustrate some of those characteristics. In Appendix F, I shed further light on those characteristics through a comparison with the British putting-out system. Several factors may explain the lack of labor market responses to the cotton revolution. First, the level of technology favored household production. Hence there was minimal friction between demands from work and demands from family. This solidified the traditional division of labor between men and women, i.e. men plow and women weave. Second, labor mobility was low. The majority of Chinese families owned land. The majority of the population were small land owners throughout much of imperial Chinese history. Land ownership is commonly associated with low labor mobility. Land ownership also raised the cost of men entering into cotton textile production. In plough-based agriculture, men performed tasks in the field, as they had the upper body strength to do so. This prevented them from being full-time textile workers. Women tended to be full-time textile workers. Due to the fixed cost of owning a spinning wheel and a loom, it made more sense to let the full-time worker have exclusive access to them. Besides, to sustain political control, the imperial government restricted labor mobility. During much of the Ming Dynasty (1366-1644), occupational status was by inheritance and 11 See Appendix F for a discussion of the impact of the cotton revolution on non-cotton textile producing regions. 10
  • 12. individuals stayed where they were officially registered. A cultural factor for a lack of mobility was that individuals stayed with their extended families under the clan system. As cotton weaving demanded a set of climatic conditions, there were geographical con- straints on where cotton could be woven (Figure I). Finished cloth, on the other hand, was sold to everywhere in the country. Relative to the rest of China, areas where cotton weaving was feasible saw a varying degree of cotton textile boom and persistently higher productivity in the textile sector. D How Much Did Women Earn? Cotton textile producers, especially weavers, were high income earners. Historians pro- vide various estimates of the actual incomes women received for producing cotton textiles. Allen’s (2011) wage regressions indicate that textile workers earned a wage premium com- pared with workers in construction or agriculture. Allen (2009) shows that one day’s work by a weaver in the late 17th century produced 7,684 calories, which was adequate to support a family. B. Li (1997) shows that a woman’s year-round textile work was enough to feed 2.7 people. Pomeranz (2002) provides an even more optimistic estimate suggesting that a woman could earn four times as much as a man. The most conservative estimate is made by P. C. C. Huang (1990). He estimates that in an average household, a female cotton textile producer generated incomes that were about 77% of those of their husbands. Women who had the skills to weave artisan cloth could earn an higher income. The production of artisan cloth was backed up by popular demand of weddings and funerals in premodern China. Greater skills and longer hours were involved in producing artisan cloth. In summary, although before the cotton revolution, Chinese women were already doing productive work, the cotton revolution allowed women to produce a larger quantity of textiles to be sold to the national market. This enabled women to earn enough to support a family independently and to take on a new role as primary income earners in the household. By the late Ming period, women had begun to produce predominantly for the market, and in many cases their earnings became the main source of income for the household. E Highly Capable Women in Historical Narratives As stated before, the cotton revolution was a major shock to the value of women’s work. That was a major changing force for the relative income status of husbands and wives, as reflected in many historical accounts. In a survey article (Man, 2011), Zheng paints a vivid image of female breadwinners being unwavering and dependable.12 In many societies, there exists a gender identity norm that the husband earns more than 12 Zheng complies a list of historical sources: J. Chen et al. (1991), Gu (1995), and Xu (1987). 11
  • 13. the wife (Bertrand, Kamenica, and Pan, 2015). Based on theories of cultural evolution, because relative payoffs of cultural traits are crucial to the choice of behavioral rules (Boyd and Richerson, 1985), a shock to the value of women’s work may lead to the breakdown of such norms. Under the circumstances in which men and women have the option of staying out of the marriage market, and no longer reproduce, those norms can stay intact.13 However, because of the traditional emphasis on continuing the family line in China, men and women do not have the option of staying out of marriage.14 Universal marriage, in conjunction with the ubiquitous increase in women’s incomes following the cotton revolution, created conditions necessary for gender identity norm to break down. For parents, as women became productive members of the economy in their own right, it became less financially costly and mentally stressful to have a daughter. Marriage laws in imperial times allowed men to freely exit marriage (“seven codes for divorcing wives”). This created a financial risk for the natal family as the daughter can become a financial burden on them upon her divorce. The prospect of daughters being self-sufficient lowered the cost of having them. Economic independence can also have a positive impact on the self perception of women. In Xu (1987), a female proudly proclaimed that she single-handedly supported the family and was a “strong woman,” a “she-husband.” She declared that her husband was passionate about literary writing and painting and that was all he could do. In particular, she stressed that he was unhelpful in making ends meet. Anecdotal evidence suggests that women producing cotton textiles enjoyed greater autonomy and higher social status (c. Zhao, 2015). F Other Episodes: Black Death, Proto-industrialization and Industrial Revolution There were other historical episodes during which women’s incomes rose relative to men’s. The main differences are that (a.) these other historical episodes of increasing female incomes were not of as large a magnitude and not as long-lasting. (b.) the cotton revolution affected both married and unmarried women. (c.) a lack of coverture laws in China. In Appendix F, I discuss a comparison with the phase of proto-industrialization in England, as well as a comparison with female labor force participation after the Black Death. From 1820 to 1850, in the industrialization of the American Northeast, female labor force participation was substantial, and the wages of women increased relative to that of men (Goldin and Sokoloff, 1982). In a letter, a New England farm girl was full of excitement when 13 Bertrand, Cort´es, et al. (2016) discuss the negative social attitudes towards working women and how they contribute to the marriage gap for skilled women. 14 This has begun to change in the past 20 years. Now a substantial share of women in urban China stay single. 12
  • 14. she began to work on well-paying jobs in textile mills (Dublin, 1993).15 Ferree (1976) finds that working-class women are happier if are employed; they work for the money but they also gain a sense of competence, connectedness, and self-determination from their job. Similarly, at a community level, in India, work earns women money and respect.16 IV Data I combine several gazetteer-based sources to construct my main variable, cotton textile production (1300-1840). For other historical variables, I use China Historical GIS (CHGIS), the digital map collection of Harvard University, the database of Chinese Gazetteers (Zhong- guo fangzhi ku), the 1916 economic census and surveys conducted by Christian missionaries in the early twentieth century. For modern outcomes and controls, I use modern censuses and surveys, including the 2000 population census (county-level), the 1990 census (individual- level) from the IPUMS International, the 2004 Industrial Census from the China Geo Ex- plorer, the Chinese City Statistical Yearbooks and Chinese General Social Surveys (2005, 2010). For climatic and geographic variables, I rely on data from the Climate Research Unit of University of East Anglia, FAO (GAEZ v3.0), NASA and NOAA. Appendix B provides details on sample construction, data sources, and variable constructions. A Cotton Textile Production (1300-1840) To obtain an estimate of the distribution of counties and prefectures where cotton textiles were produced between 1300 and 1840 across China today, I map historical locations of cotton textile production into modern counties.17 Historical gazetteers provide qualitative information on cotton textile production. My main interest lies in the spinning and weaving of cotton textiles, rather than the cultivation of raw cotton. Information on cotton spinning and weaving, as well as cotton cultivation, can be inferred from a section describing goods that were produced locally (shihuo zhi). I code cotton textiles (1300-1840) as one, if finished cotton cloth is mentioned in the gazetteer of a specific county or prefecture (jibei bu or mian bu). Both mian and jibei mean “cotton”. jibei is just an alternative name to mian. bu means “cloth”. I draw on several historical studies to construct my dataset. A key source I use is Wang (2006). More information on those historical studies are available in Appendix B.2. 15 Dublin (1993) is a collection of letters from five women working in textile mills. Mary Paul said in a letter “I can earn more to begin with [at lowell] than anywhere about here.” When she got paid, she expressed her excitement over buying new shoes “Last Tuesday we were paid. In all I had six dollars and sixty cents paid $4.68 for board. With the rest I got me a pair of rubbers and a pair of 50 cts shoes.” 16 http://www.nytimes.com/2016/01/31/world/asia/indian-women-labor-work-force.html?r = 0. 17 The year 1840 marks the end of the household production of cotton textiles. Section III provides detailed background information for the cotton revolution. 13
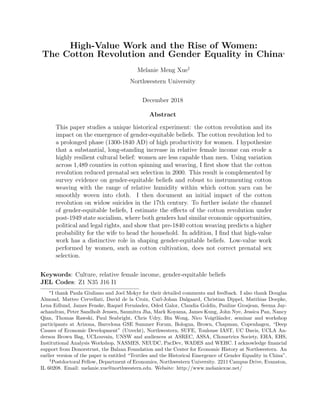
  • 15. I rely on county and prefecture gazetteers (Figure A.V). For prefectures, their historical boundaries are known; but for counties, their exact boundaries before the year of 1911 are unknown. Based on my default method, a historical county is the “ancestor” county of a modern county, if the county seat falls into the boundary of a modern county. A value of one is assigned to a modern county if cotton textiles were produced in its “ancestor” county between 1300 and 1840; zero is assigned otherwise.18 In addition, a value of one is assigned to a county with more than half of its area overlapping with a historical prefecture with cotton textile production, and zero to other counties. This yields a dummy variable of cotton textiles (1300-1840) for each county. To account for boundary changes over time, I use time-series maps of prefectures and counties to identify precise historical locations of cotton textile production between 1300 and 1840. This allows me to use historical locations closely matched to sources. For example, when a record is taken from a prefecture-level gazetteer published in 1503, it is geocoded as in that particular prefecture with its boundaries in 1503. I also code cotton textile production using alternative methods. I locate historical coun- ties in a map from a later period (the earliest will be year 1911) when their boundaries became known. This method results in a continuous variable of cotton textile production, which yields highly similar estimates to the estimates based on the binary variable. Alterna- tively, I create a continuous variable based on the percentage of land area of each county that overlaps with a historical prefecture with cotton textile production. This also yields estimates highly comparable to those obtained with the binary explanatory variable. In Appendix B.2, I lay out the detailed procedure for constructing the main explanatory variable. In Appendix B.3, I describe how cotton textile production (1300-1840) is linked with modern outcomes. As a summary, Figure I shows the distribution of counties and prefectures that previously produced cotton textiles across China in 2000. Historical gazetteers provide valuable information on cotton textile production between 1300 and 1840. However, two types of biases are present in gazetteer data: publication bias and survivorship bias (Appendix B.2). Wealthier counties published more gazetteers and at an earlier date. My solutions to this are as follows: first, I use a binary treatment variable constructed to avoid introducing spurious correlations between cotton textiles (1300-1840), stage of development and cultural beliefs about women’s worth; second, in Table A.IX, I run several regressions based on the number of gazetteers available in a county. I show that my coefficient estimates are not sensitive to the frequency at which historical gazetteers were 18 All gazetteers I use were published in the Ming and Qing Dynasty (1368-1840), because very few gazetteers were published before 1368. Here I assume that gazetteers published in the early Ming Dynasty would contain information on cotton textile production that began before 1368. 14
  • 16. published, which suggests that “publication bias” and “survivorship bias” are unlikely to drive my results. Figure I: Cotton Textile Production (1300-1840) B Control Variables In this section, I outline the set of control variables used for the county-level analysis in modern-day China. Additional controls are used in my analyses of other historical episodes of China and will be discussed in those sections. My baseline controls include contemporary controls such as a county’s per capita GDP measured in 2000, share of urban population, share of agriculture workforce, share of service workforce, share of urban hukou (household registration), years of schooling (male), share of ethnic population, governance status and provincial capital status, historical controls such as agricultural suitability, population density in 1300, proximity to the Grand Canal or the Yangtze River and treaty port, as well as a set of geographic controls, such as ruggedness, distance to coast, latitude and longitude. To account for deep-rooted socio-cultural differ- ences across regions, I include Skinner socioeconomic macroregion fixed effects, in addition 15
  • 17. to province fixed effects. I obtain most of contemporary controls from the 2000 Census. Maps are from National Bureau of Statistics (2005). Skinner socioeconomic macroregion data are available at the G.W. Skinner Data Archive (Skinner, M. Henderson, and Berman, 2013). Historical controls include agricultural suitability, proximity to the Grand Canal or the Yangtze River and treaty port status. Agricultural suitability is downloaded from the FAO website. When more than one suitability measure is available for a particular type of crop, I use the suitability measure based on intermediate-level input under rain-fed conditions in the most recent version of the FAO database (GAEZ 3.0). Proximity to the Grand Canal or Yangtze is obtained from the China Historical GIS (CHGIS). Distance to the nearest coast and ruggedness are downloaded from the National Aeronautics and Space Administration (NASA) website. For other types of work women engaged in, I include cotton suitability, tea suitability and rice suitability data from FAO, and historical production data on other types of textiles from historical gazetteers. Suitability maps are available in Appendix A. To assess the impact of large economic and political shocks, I control for treaty ports (Jia, 2014), density of com- municants (Stauffer et al., 1922) and coastal China (National Bureau of Statistics, 2005). In addition, I check to see how three hypotheses examined in previous work hold up in this study. I obtain data on ancestral plough use from the Ethnographic Atlas (Murdock, 1967), information on Neolithic settlements (Chang, 1963) and soil texture from the Harmonized World Soil Database (Nachtergaele et al., 2008). Finally, I add language group as a control using data from the G.W. Skinner Data Archive. Summary statistics are shown in Table A.I. Appendix B.4 provides the historical context for variables including proximity to the Grand Canal, treaty ports, density of communicants in early 20th century, pre-1300 commercial tax quota and historical courier routes. V The Cotton Revolution and Sex Ratio at Birth: A County-Level Analysis A Determinants of Sex Ratio at Birth A wide range of factors shape sex ratios in the population, but sex ratios at birth are relatively clustered, typically from 103 to 107 boys per hundred girls. The perception of women being inferior can lead to female infanticide, child neglect and underinvestment in girls. When sex-selection technology is available, the manifestation of biases against women can shift towards an earlier stage of reproductive process: pre-natal sex selection. It has been shown that pre-natal sex selection is an important source in the skewness of 16
  • 18. sex ratio at birth (Ebenstein, 2010).19 In the 2000 Chinese Population Census, sex ratios at birth ranged from 92 to 193 boys per hundred girls.20 In a usual context, individuals simultaneously make decisions on fertility and sex selection. With the same attitude towards women, a population with a lower desired fertility can have a more skewed sex ratio at birth. Under the one-child policy, however, fertility became exogenously determined. This policy created a favorable condition for identifying the effect of the perception of women on the skewness of sex ratio at birth. In the context of China in 2000, the main variation in sex ratio at birth comes from (a.) Economic payoffs to having a boy; (b.) Difficulty to having at least one boy, i.e. variation in the one-child policy and its enforcement; (c.) Culturally-determined preference for boys. For (a.), the economic payoffs to having a boy are impacted by the stage of development and sectoral composition (Rosenzweig and Schultz, 1982). I include per capita GDP, share of agriculture workforce and share of service workforce as controls. Due to the setting of state socialism, differential economic payoffs to having a boy is unlikely driven by gender differences in labor force participation. China’s female-to-male ratio in labor force participation rate was at 85% in 2000, one of the highest in the world.21 In terms of (b.), the one-child policy further increased the difficulty to having at least one boy.22 The policy varied by household registration (hukou). Those with urban hukou were subject to a stricter version of the one- child policy than their rural counterparts. Ethnic minorities were either not subject to or subject to a less strict version of the one-child policy. Besides, political characteristics such as how a county is governed and whether it is a provincial capital can affect the enforcement of the policy.23 When it comes to (c.), the share of ethnic population is also an important determinant. The pace of modernization may also affect the taste. Average years of schooling 19 Confucian values shaped traditional Chinese society in important ways. It strongly disfavored women, partly because it laid a particular emphasis on continuing the family line and held that only male offspring could fulfill this purpose. A further development in Confucianism, Song-Ming Neo-Confucianism, further disadvantaged women. Song-Ming Neo-Confucianism was first developed in the Song Dynasty (960–1279), which led to a series of negative changes for women, ranging from unfriendly inheritance laws and to remarriage being stigmatized. Appendix F has more details on Confucianism, Song-Ming Neo-Confucianism and status of women. 20 This is after the exclusion of five autonomous regions where (a.) A large share of the population comprise ethnic minorities who were not exposed to Confucian norms and institutions; (b.) The one-child policy was not enforced or not to the same degree. 21 http://hdr.undp.org/en/content/labour-force-participation-rate-female-male-ratio. Female-to-male la- bor force partipcation was 74.8% in the United States and 62.4% in Germany. 22 Fertility decline predated the one child policy (Babiarz et al., 2018). 23 Chinese prefectures and counties underwent institutional reforms after 1982. Governance status started to vary across counties. Governance status of the county takes one when it is governed by the prefecture-level government, two when it is self-governed, and three when it is governed by the province-level government. 17
  • 19. is shown to be a good proxy for modernization.24 (c.) is where I expect the effects of the cotton revolution enter. The choice of sex ratio at birth in 2000 as the main outcome variable is motivated by the following facts: (a.) Sex selection technologies became widely available in the 1990s. By the mid-1990s, virtually all county-level hospitals, township-level clinics and local family planning agencies were equipped with ultrasound scanners (Anukriti, Bhalotra, and Tam, 2015). (b.) Before 2000, variation in the one-child policy was limited to urban versus rural hukou, Han Chinese versus ethnic minorities. After 2000, some counties began to experiment with a two-child policy for parents that were both the only child of their parents. (c.) Marriage remained near universal, and voluntary childlessness was relatively rare. This shuts down a possible channel flowing from the cultural beliefs about women’s worth to sex ratio at birth that is not pre-natal sex selection. Selectivity into motherhood, if correlated with the cotton revolution and son preference, could be a confounder. (d.) Data quality of the 2000 census is one of the highest. After 2000, a floating population composed of 200-million temporary migrants affected the data quality of the population censuses.25 In Appendix C, I compare pre-natal with post-natal sex selection (Lin, Liu, and Qian, 2014; Hu and Schlosser, 2015) in Appendix C.1, demonstrate how the one-child policy induced pre-natal sex selection by manipulating fertility constraints in Appendix C.2 and show that access to ultrasound screening varied over time and became widespread by the late 1990s (Appendix C.3). B Connections to Cultural Beliefs About Women’s Worth The President’s Commission for the Study of Ethical Problems in Medicine and Biomed- ical and Behavior Research of the United States in 1983 came to the conclusion that “in some cases, the prospective parents’ desire to undertake the procedure (of sex selection) is an expression of sex prejudice. Such attitudes are an affront to the notion of human equality and are especially in an appropriate in a society struggling to rid itself of a heritage of such prej- udices . . . Surveys of parents and prospective parents indicate, however, a preference for sons (especially as the first-born child). If it became an accepted practice, the selection of sons in preference to daughters would be yet another means of assigning greater social value to one sex over the other and perpetuating the historical discrimination against women.” Like- 24 It is common to use years of schooling as a proxy for modernization. I use years of schooling (male) instead of years of schooling in the population, because female education is influenced by differential parental investments. 25 To deal with the challenge arising from tracking temporary migrants, the 2010 Census had to the record- ing method of “recording every individual encountered”. It was not unusual to double count an individual in the place he worked (by current residence) and in his hometown (by household registration). 18
  • 20. wise, American philosopher Mary Ann Warren (1985) considers sex selection to be ‘invariably motivated by sexist beliefs”. In the United States, as ultrasound technology became widely available, fears emerged that sex selection might take place on a large scale—the 1970 National Fertility Study shows that the sex preference ratio is as high as 124 boys for every 100 girls for all women who intend to have more children (Westoff and Rindfuss, 1974).26 Legal and moral forces are important constraints on the use of sex selection to choose the gender of a newborn in a way consistent with underlying cultural beliefs about women’s worth; such constraints are not equally present in China.27 In the 1990s, as ultrasound screening became widespread, another crucial constraint on sex selection was lifted (Cloonan, Crumley, and Kiymaz, 2005; Y. Chen, H. Li, and Meng, 2013). During the window of a few years near 2000, China was close to being at the hypothetical setting where no meaningful constraints were placed on how sex selection was achieved and culture beliefs about women were uninhibitedly translated into sex ratio at birth through sex selection.28 This motivates the use of sex ratio at birth in 2000 as a main proxy for culture beliefs about women. C Baseline Results Having constructed a county-level measure of cotton textile production, I can examine the relationship between cotton textiles (1300-1840) and modern outcomes.29 I begin by examining variation at the county level. I test my hypothesis by estimating the following equation: Sex ratio at birthc = α + βcotton textiles (1300-1840)c + XH c Ω + XG c Λ + XC c Π + c , (1) where c denotes a county. cotton textiles (1300-1840)c is cotton textile production for 1300- 1840 at County c. XH c is a vector of historical controls, and XG c and XC c are vectors of geographical and contemporary controls respectively, each measured at the county level. XG c and XH c are intended to capture geographic and historical characteristics that may have been correlated with cotton textiles (1300-1840) and may still affect present-day out- comes. I include in XH c agricultural suitability and estimated population density in 1300. 26 Sex ratio imbalances on that scale, however, never actually occurred, though nearly a 20 percent “excess” of male births was initially projected to follow a technological breakthrough in sex selection technology. 27 J. Lee, Campbell, and Feng (2002) and R. Lee and M. Anderson (2002) document widespread infanticide in premodern China; they consider the practice as part of the “preventative check” on the population. See Appendix C. A for more details on attitudinal differences in infanticide across societies. Also, like other communist countries, China destigmatized abortion. 28 After 2000, there was some relaxation in the enforcement of the one-child policy in some regions. 29 I can derive an alternative measure of sex ratio imbalances by taking the natural log of the deviation of sex ratio at birth from the normal sex ratio. Results are very similar when this alternative measure is used. 19
  • 21. For an agrarian economy, agricultural productivity reflect economic fundamentals and shape social structures. Extreme poverty can cause individuals to pursue infanticide as a survival strategy (L. M. Li, 1991), which might affect modern outcomes through attitudes towards pre- or post-natal sex selection. It is also a rough proxy of historical male incomes given that men were primary agricultural workers at the time. Historical population density is a proxy for economic development and can shape the ancestral traits of modern populations (Putterman and Weil, 2010). Historical population data are scarce. I use estimated popula- tion density in 1300 from Goldewijk, Beusen, and Janssen (2010) and Klein Goldewijk et al. (2011). The distribution of cotton textiles (1300-1840) depended on the trade networks. I include a control for whether the county was on the Grand Canal or on the Yangtze River— the major trade networks at the time. To account for the impact of treaty ports established in the 19th century, I include treaty port status as a control. To control for geographic dif- ferences across counties, I include in XG c the natural log of distance to coast and the natural log of one plus ruggedness, latitude, longitude and their interaction.30 To address norms such as patrilocality and concern for women’s purity and other differences across those histori- cally relatively autonomous regions, I include fixed effects corresponding to socioeconomic macroregions defined by Skinner, M. Henderson, and Berman (2013).31 As an alternative, I can include language fixed effects, which would also account for large differences in culture and customs.32 The contemporary control variables include socioeconomic characteristics such as the natural log of a county’s per capita GDP measured in 2000, share of urban population, share of agriculture workforce, share of service workforce, share of urban hukou (household registration), years of schooling (male), share of ethnic population, political characteristics including governance status and provincial capital status, and province fixed effects. The OLS estimates show that in counties with cotton textile production between 1300 and 1840, fewer girls are missing today. The coefficient estimates are both statistically significant and economically meaningful. I begin my analysis with socioeconomic region fixed effects only (column 1), and then include both socioeconomic region fixed effects and province fixed effects (column 2). When I include the full set of controls in column 3, the size of the coefficient increases from -3.008 to -3.753. The cotton revolution is associated with a decrease of sex ratio at birth by 3.753 boys per 100 girls, which is 27% of the standard deviation of sex ratio 30 Deng (1999) makes the point that in premodern China, people living in rugged terrain tended to net consumers of cotton textiles. 31 Please refer to Appendix B.4 for a more detailed description of socioeconomic macroregions. 32 Results using language fixed effects can be found in E. Language fixed effects can also be added to other specifications and results do not change. 20
  • 22. Table I: Cotton Revolution and Sex Ratio Imbalances: OLS Results Dependent variable: sex ratio at birth in 2000 (1) (2) (3) (4) (5) (6) Mean of Dep. Var. 118.3 118.3 118.6 118.6 118.6 118.6 Cotton textiles (1300-1840) -3.008∗∗∗ -3.225∗∗∗ -3.753∗∗∗ -4.049∗∗∗ -3.887∗∗∗ -4.066∗∗∗ (0.668) (0.713) (0.731) (0.775) (0.777) (0.773) Log per capita GDP -2.941∗∗∗ (0.479) % in agriculture 0.245 (0.379) % in service -0.538 (1.302) Years of schooling (male) -2.485∗∗∗ (0.724) % ethnic population -0.718∗∗∗ -1.118∗∗∗ (0.249) (0.253) Provincial capital 3.091∗∗∗ 0.0496 -0.221 (1.006) (0.958) (0.954) Self-governed -2.882∗∗ 4.586∗∗∗ 5.484∗∗∗ (1.364) (0.890) (0.861) Governed by province -2.363∗ 3.436∗∗∗ 4.110∗∗∗ (1.249) (1.065) (1.063) Historical controls No No Yes Yes Yes Yes Geographic controls No No Yes Yes Yes Yes Province FE No Yes Yes Yes Yes Yes Socioeconomic Macroregion FE Yes Yes Yes Yes Yes Yes Adjusted R2 0.150 0.231 0.368 0.314 0.306 0.288 Observations 1622 1622 1489 1489 1489 1489 Notes: The table reports the impact of cotton textiles (1300-1840) on sex ratio imbalances. The unit of observation is a county in 2000 Census. The dependent variable is sex ratio at birth. Column 1 reports estimates with only socioeconomic macroregion effects. Column 2 reports estimates with both socioeconomic macroregion and province effects. Column 3 includes all controls. “Historical controls” are treaty port status, agriculture suitability, and whether a county was on the Grand Canal or the Yangtze River (major trade networks). “Geographic controls” ar the natural log of one plus ruggedness, the natural log of distance to coast, latitude, longitude and their interaction. Column 4-6 sequentially drops potentially endogenous modern controls. The omitted category for governance status is being governed by the prefecture-level city government. Robust standard errors are used in all specifications. Standard errors in parentheses ∗ p < 0.10, ∗∗ p < 0.05, ∗∗∗ p < 0.01 21
  • 23. at birth.33 Column 3 contains the baseline specification for the rest of this study. Figure A.I in Appendix A shows a partial regression plot corresponding with column 3. It indicates that the coefficient estimate of cotton textiles (1300-1840) is not influenced by a small number of counties. In column 4, the coefficient estimate remains similar when I omit logged per capita GDP, logged share of urban hukou, logged share of agricultural workforce and logged share of service workforce and years of schooling (male).34 In column 5, in addition to controls omitted from column 4, I exclude the share of ethnic population.35 In the last column, I exclude provincial capital status and governance status, and the coefficient estimate remains close to those in previous columns. These results can be replicated using the individual-level 2000 census (1% sample). In Appendix Table A.XI, I examine alternative outcome variables from the 2000 census, such as sex ratios among other cohorts with exposure to the ultrasound technology. I look at individuals that were aged 1-4 and 5-9, and find very similar patterns. I find that women have a higher educational attainment in counties positively impacted by the cotton revolution. Given that opportunities to attend school, or to participate in the labor force, were made equal under state socialism, this difference is most likely driven by parental investment in education. It shows that parents in counties with a history of cotton textile production are more likely to invest in girls. 36 Men’s educational attainment is not correlated with cotton textiles (1300-1840). One concern is that counties with and without cotton textiles (1300-1840) differ in many dimensions and have very different unobservables. By comparing coefficient estimates and movement in R2 across the columns, I show that my results are not driven by selection on unobservables. Table A.VII in Appendix E summarizes the test of selection on unobservables 33 The specification is also robust to the inclusion of the squared term of log per capita GDP. Chung and Gupta (2007) suggests that sex ratios can change in nonlinearity through different stages of development. Results are robust to controlling for fertility; however, fertility is a “bad” control, as decisions are made simultaneously on fertility and sex selection [pp.64-68](Angrist and Pischke, 2008). 34 Though large sex ratio imbalances are a relatively new phenomenon in China, the underlying cultural beliefs about women are not, and per capita GDP could have been negatively affected by past gender discrim- ination. Sex ratio imbalances per se can also affect GDP through increasing saving rates (Wei and X. Zhang, 2011). In either case, controlling for log per capita GDP will constitute the case of “overcontrolling”. 35 The share of ethnic population might have become endogenous to the dependent variable in the past few decades due to responses to the one-child policy. Under the one-child policy, ethnic minorities were allowed to have more children than were the Han Chinese. W. Huang and Zhou (2016) has documented that inter-ethnic marriages have become more common under one-child policy. 36 These results can be replicated on the individual-level 2000 census (1% sample). The interaction term between cotton textiles (1300-1840) and female is positive for all cohorts starting from the 1930s but for the cohort of individuals born after 1990. Given the year of the year of the census, those who were born after 1990 would be under 10 and all have “less than primary education”. 22
  • 24. based on selection on observables (Altonji, Elder, and Taber, 2005; Oster, 2014). To further ensure the robustness of the results, I conduct the following tests: (i.) clus- tering at different geographic units; (ii.) using matched samples; (iii.) addressing biases in gazetteer data; (iv.) using different subsamples (omitting the Yangtze Delta and omit- ting high net in-migration counties); (v) accounting for historical and modern confounders (pre-1300 commercial networks, historical state presence and modern industrial composition); (vi.) checking three main hypotheses in previous work: ancestral plough use (Alesina, Giu- liano, and Nunn, 2013), Neolithic settlements (Hansen, Jensen, and Skovsgaard, 2015) and soil texture (Carranza, 2014);(vii) examining variation within populations speaking the same language only. Appendix E summarizes the results of the above tests. D The Distinctive Role of High-Value Work The adoption of better technologies increased the quantity of cotton textiles produced per unit of time. Labor productivities in producing cotton textiles were higher in regions suitable for cotton spinning and weaving. Through inter-regional trade, cotton textiles were “exported” from those regions to the rest of China. Due to restrictions on migration, and gender segregation in types of work (Section III.C), women in places positively impacted by the cotton revolution earned a sustained “wage” premium over long periods of time. This made cotton textile production exceptional. The baseline analysis suggests that the economic value of female labor is related to the formation of cultural beliefs of women’s worth. Is the relationship between the economic value of female labor linear? As one of the component of sex ratio at birth is the economic value of having daughters, a linear relationship between past economic value of female labor and the present value of daughters likely suggests a level of persistence in the skill and ability of women that could shape the decision of sex selection. This is not what we find. Instead, we find a non-linear relationship between past economic value of female labor and sex ratio at birth in the present. One interpretation is that relative female income has to reach a threshold level for beliefs to update. This implies that cultural beliefs about women’s worth are sticky and possibly binary. Below I compare cotton textile production to other types of economic activities performed by women. Appendix F includes a comparison of the cotton revolution to the Black Death, after which female labor force participation increased but relative female income remained low. D.1 Cotton Cultivation Women participated in the cultivation of cotton (“raw cotton”). Raw cotton is first spun into yarn, yarn woven into cotton fabrics. The locations of cotton cultivation did not overlap 23
  • 25. with the locations of cotton spinning or weaving.37 I do not find a significant relationship between cotton cultivation and sex ratio at birth (column 1). In column 2, I include both cotton textiles (1300-1840) and cotton cultivation, and use a dummy variable of raw cotton in column 3. In both cases, the coefficient estimate of cotton textiles (1300-1840) does not vary much from the baseline estimate. D.2 Tea Production Qian (2008) shows that a short-term increase in tea prices increases the share of sur- viving girls likely by enhancing women’s household bargaining power. The extent to which tea picking involves female labor varies. Tea production is the most prevalent in southern provinces (See Appendix A for a map of tea suitability). I include tea suitability in column 4 and find no significant effects. In column 5, I include both cotton textile production and tea production, and find the coefficient estimate of cotton textiles (1300-1840) to be very similar to the baseline estimate. In column 6, I replace the continuous variable of tea production with a dummy variable, and find very similar results. In comparison with cotton textile pro- duction, tea production was more seasonal and occasional, and did not generate as a stable cash flow. This is consistent with the hypothesis that relative female income has to reach a threshold value to be able to transform cultural beliefs about women’s worth. D.3 Rice Cultivation Women participated in rice cultivation. However, just like wheat agriculture, rice agri- culture was plough-based and required male upper body strength. Overall, I do not find a significant relationship between rice suitability and sex ratio at birth (column 7). In column 8, I include both cotton textile production and rice suitability, which produces a coefficient estimate of cotton textile production that is highly similar to the baseline estimate. When a dummy variable is used, rice suitability has a negative and insignificant coefficient, and cotton textile production continues to have a coefficient estimate of -3.7. Wetland rice suitability in GAEZ v3.0 is used for this exercise, but results are robust to using other measures of rice suitability.38 37 See Appendix A for a map of cotton suitability. Regions specialized in cotton cultivation or in spinning and weaving. The US South specialized in cotton cultivation, when the UK specialized in the manufacture of cotton. FAO provides cotton suitability data at the level of 5 arc-minute grid cells (10km*10km). Consistent with other suitability measures used in this study, I use “agro-climatically attainable yield for intermediate- input-level, rain-fed cotton for baseline period 1961-1990” as my measure of cotton suitability. 38 GAEZ v3.0 has a composite measure for wetland rice. The map of wetland rice suitability closely matches the actual cultivation and the traditional rice-wheat border as shown in Figure A.IIIb. GAEZ v3.0 also has separate measures for indica dryland rice, indica wetland rice and Japonica wetland rice, among which Indica dryland rice has a suitability of zero in China under both irrigation and rain-fed conditions. In GAEZ v2.0, a measure of rice suitability, irrespective of specific types of rice, is available. When using this measure, the coefficient estimate of being in rice-suitable areas is negative but not significant. Following Alesina, Giuliano, and Nunn (2013), I define locations that obtain at least 40% of the maximum yield as suitable. 24
  • 26. TableII:Low-vs.High-ValueWork Dependentvariable:sexratioatbirthin2000 (1)(2)(3)(4)(5)(6)(7)(8)(9)(10)(11) ContinuousContinuousDummyContinuousContinuousDummyContinuousContinuousDummyDummyDummy MeanofDep.Var.118.6118.6118.6118.6118.6118.6118.6118.6118.6118.6118.6 Cottontextiles(1300-1840)-3.719∗∗∗-3.635∗∗∗-3.731∗∗∗-3.731∗∗∗-3.727∗∗∗-3.740∗∗∗-3.785∗∗∗ (0.740)(0.741)(0.735)(0.735)(0.734)(0.737)(0.806) Rawcotton-0.00177-0.000492-2.028 (0.00322)(0.00322)(1.654) Tea0.0005720.0007980.215 (0.00589)(0.00585)(1.671) Rice0.0001030.0000652-0.323 (0.000395)(0.000390)(1.491) Cotton/Silk/Hemptextiles-1.695∗∗0.0832 (0.822)(0.896) BaselinecontrolsYesYesYesYesYesYesYesYesYesYesYes ProvinceFEYesYesYesYesYesYesYesYesYesYesYes SocioeconomicMacroregionFEYesYesYesYesYesYesYesYesYesYesYes AdjustedR20.3580.3680.3680.3580.3680.3680.3580.3680.3680.3600.368 Observations14841484148414841484148414841484148414891489 Thetablereportstheresultsoftestingtheeffectsofhigh-valueworkvs.low-valuework.Theunitofobservationisacountyin2000 Census.Thedependentvariableissexratioatbirth.Columns1,4&7runregressionsonvarioustypesoflow-valuework.Other columnsregresssexratioatbirthonbothcottontextileproductionandlow-valuework.Columns2,5&8usecontinuousvariables ofcotton,teaandricesuitability.Columns3,6&9usedummies.BaselinecontrolsarethoseusedinColumn3ofbaseresults. Standarderrorsinparentheses∗ p<0.10,∗∗ p<0.05,∗∗∗ p<0.01 25
  • 27. D.4 Lower-Value Textile Work Compared to cotton textile production, silk and hemp textile production typically yielded a lower income. Hemp textiles both had a much lower unit value, and was produced in smaller quantities. Silk produced at home was low-ended and similarly produced in small quantities.39 To separate the effects of high-value work from those of low-value work, I include a control for the production of all types of textiles.40 I find that the production of textiles bears no relationship with sex ratio at birth (column 2), once after controlling for cotton textiles. E Post-1840 Political and Economic Shocks E.1 Early Industrialization Early industrialization began in China after 1840. The effects of early industrialization could bias my results in the following ways: (a.) If counties positively impacted by the cotton revolution were more likely to experience early industrialization after 1840, my results would confound the effects of industrialization with those of the cotton revolution. One fact counting against this is that industrialization in China was on a limited scale (Fairbank, 1978). During the late Qing and Republican era, much of the rural and hinterland China continued to engage in household production and individuals maintained traditional lifestyles. In 1933, almost a hundred years after the first treaty port was established in Shanghai, the handicraft industry still made up for 61% of the total industry output. (b.) If women were more likely to be part of the industrial workforce when they already worked at home, I would not be able to disentangle the effects of the cotton revolution and the effects of female labor force participation after 1840.41 Given that much of industrialization in 19th century China took place in treaty ports (Jia, 2014), I include treaty port status as a proxy for early industrialization, which is already in the baseline specification. Columns 1-3 of Table III show coefficients of interest after controlling for or omitting treaty ports. Being a treaty port in the 19th c. indeed has an impact on sex ratio at birth. The interaction term between treaty port status and cotton textiles (1300-1840) is close to zero and insignificant, suggesting that the cotton revolution has no differential impact on sex ratio at birth by treaty port status. I also drop all treaty ports in column 3 and this slightly increases the size of the main coefficient estimate. 39 High-ended silk was produced at state-owned workshops in just a few urban areas. In these urban shops, the work force was predominantly male. 40 To obtain information on other types of textiles, I construct a second variable from Wang (2006). 41 Section VI.C provides evidence that women in provinces more exposed to the cotton revolution were more likely to work outside of the home at the onset of the industrialization. Goldin and Sokoloff (1982) documents a substantial involvement of women in the industrialization of the American Northeast and a wage increase for women relative to men. 26
  • 28. E.2 Expansion of Christianity As Christianity emphasizes the value of human life, expansion of Christianity in China might have influenced constituted a source of variation in willingness to conduct sex selec- tion. In the 19th and early 20th century, missionaries went to China to spread Christianity. Christianity might have shaped both attitudes towards infanticide and gender-role attitudes. Although the share of Chinese populations that were ever converted was small, they had a disproportional influence on the rest of society (Bai and Kung, 2014). To check the impact of Christianity, I first include the density of communicants in column 4. As expected, a greater share of communicants in the population is negatively associated with sex ratio at birth. The size of the coefficient of interest increases by one-fifth, suggesting that some of the effects of the cotton revolution might have been masked by missionary ac- tivities. Counties without cotton textiles (1300-1840) had a higher density of communicants. I interact the density of communicants with cotton textiles (1300-1840) in column 5. The coefficient is positive for the interaction term, but not statistically significant. This implies the effect of the cotton revolution is smaller for counties with a greater share of communi- cants, and likewise, the effect of Christianity is smaller for counties positively impacted by the cotton revolution. In column 6, I drop all counties with more than 10 communicants per 10,000 residents; the estimated coefficient slightly increases in size. E.3 Post-1979 Economic Policies A set of liberalization policies were implemented after 1979 to vitalize the economy. I estimate the impact of economic liberalization on sex ratio at birth by exploiting the fact that coastal regions had greater propensity for economic liberalization. Shortly after 1979, five special economic zones were approved and they were all located on the coast. The Yangtze Delta and the Pearl River Delta witnessed rapid export-led economic growth upon economic liberalization. Are those regions are the same regions that had cotton textile (1300-1840).42 I already have per capita income in the baseline specification to control for the impact of economic development; to account for other effects of post-1979 economic liberalization, I add a control for the coastal region (column 7), interact the coastal region with cotton textiles (1300-1840) (column 8) and drop the coastal region from the sample (column 9). The estimated coefficient decreases, but only slightly, after the inclusion of the coastal region dummy. In column 9 the coefficient size of interest increases by about a third. 42 Figure I suggests that both the Yangtze Delta and the Pearl River Delta are indeed associated with cotton textile production. 27
  • 29. TableIII:Post-1840PoliticalandEconomicShocks Dependentvariable:sexratioatbirth (1)(2)(3)(4)(5)(6)(7)(8)(9)(10)(11) EarlyChristianityEconomicAllNone IndustrializationLiberalization MeanofDep.Var.118.6118.6119.1118.8118.8119.4118.6118.6118.8118.8118.8 Cottontextiles(1300-1840)-3.753∗∗∗-3.739∗∗∗-4.108∗∗∗-4.164∗∗∗-5.983∗∗∗-5.949∗∗∗-3.669∗∗∗-4.363∗∗∗-4.941∗∗∗-6.251∗∗∗-4.207∗∗∗ (0.731)(0.764)(0.766)(0.883)(1.415)(1.021)(0.730)(0.783)(0.798)(1.413)(0.881) Treatyport-3.943∗∗∗-3.863∗∗∗-3.248∗∗-3.364∗∗-7.366∗∗∗-3.673∗∗∗-4.010∗∗∗-7.008∗∗∗-2.732-3.333∗∗ (1.043)(1.292)(1.468)(1.459)(1.997)(1.061)(1.060)(1.414)(2.045)(1.463) Cottontextiles(1300-1840) ×Treatyport -0.138-0.817 (1.929)(2.858) Christianity-0.348-0.852∗-0.802∗ (0.382)(0.487)(0.480) Cottontextiles(1300-1840)×Christianity 1.121∗0.858 (0.666)(0.675) Coastal-2.288-4.843∗∗∗-6.164∗∗ (1.515)(1.822)(2.539) Cottontextiles(1300-1840)×coastal 4.620∗∗6.197∗∗ (2.077)(3.085) BaselinecontrolsYesYesYesYesYesYesYesYesYesYesYes ProvinceFEYesYesYesYesYesYesYesYesYesYesYes SocioeconomicYesYesYesYesYesYesYesYesYesYesYes MacroregionFE AdjustedR20.3680.3680.3920.3590.3600.3790.3690.3700.3660.3620.360 Observations148914891289993993766148914891260993993 Notes:ThetablereportstheimpactofCottontextiles(1300-1840)onsexratioatbirthaccountingforpoliticalandeconomic shocks.Theunitofobservationisacountyin2000Census.Thedependentvariableissexratioatbirth.Baselinecontrolsarethose usedincolumn3ofI.Christianityismeasuredbylog(communicantsper10,000+1).“onthecoast”referstoacountywithin50 kilometersofthecoast.Column3dropsalltreatyports.Column6dropsallcountieswithmorethan10outof10,000individuals beingcommunicants.Column9dropsallcoastalcounties.Column10includeallinteractionterms.Column11includesonly baselinecontrolsandusesthesamesampleasColumn10.Aspartofthebaselinecontrols,treatyportstatusandprovincialcapital arecontrolledforinallspecifications.Robuststandarderrorsareincludedinallspecifications.Standarderrorsinparentheses∗ p<0.10,∗∗ p<0.05,∗∗∗ p<0.01. 28
  • 30. Lastly, I include controls for all three large political and economic shocks and interacted them with cotton textiles (1300-1840) in column 10. This results in a sample of 993 counties. I find that if those shocks can be taken as exogenous, the cotton revolution is associated with a reduction of sex ratio imbalances by 6.2 boys per 100 girls in places without exposure to any of the shocks. Using the same sample but without controlling for those shocks, the main coefficient estimate is 4.2 boys per 100 girls (column 11). F Instrumental Variable Strategy In spite of performing a number of robustness tests and accounting for large political and economic shocks, I cannot rule out all possible sources of omitted variable bias. Below I use an instrumental variable strategy that allow me to circumvent the problem of omitted variable bias. A potential concern with the OLS estimates is selectivity into the adoption of new textile technologies. If these counties had a highly level of gender equality, or more likely have accomplished gender equality later even in the absence of the cotton revolution, this would bias the OLS estimates away from zero. A set of variables (agricultural suitability, log population density, proximity to the Grand Canal or Yangtze, distance to the coast, ruggedness and socioeconomic macroregion fixed effects) have been included in the baseline specification, to account for factors such as economic geography. In addition, an instrumental variable strategy helps to address measurement error. Due to the nature of historical data, my estimates suffers attenuation bias due to measurement error in the explanatory variable. F.1 Logic of the Instrument A few factors are known to be crucial for cotton spinning and weaving, one of which is a suitable range of relative humidity. Scientists, engineers and industry experts highlight the importance of relative humidity in producing cotton textiles. Lewis (1913) devotes its entire length to physical testings of cotton yarns. An extended analysis is provided on how yarn-count, twist and tensile strength vary by relative humidity. In a report on the textile industry in China (1909), the word “humidity” occurs more than 100 times, suggesting the pivotal role of humidity in textile manufacturing. Cotton weaving depends crucially on a suitably wet climate. Lander (1914) provides a vivid account of how relative humidity makes a good day or a bad day for cotton weaving: “It is well-known fact that on certain days weaving is more difficult than on others, and this difficulty is generally associated with a dry, east wind. On such occa- sions weaving is difficult even with the bulbs in the factory showing a percentage humidity which would be considered ample on an average day”. When spinning and weaving is carried out in unfavorable climates, finished cloth is of much 29
  • 31. poorer quality. Low humidity has a substantially impact on high-ended cotton cloth; high- quality cotton cloth can only be produced when relative humidity is greater than 70%. The possession of a spinning wheel or a weaving loom entails a fixed cost; it helps to justify the cost if the equipment is used frequently. Many parts of China have dry winters, which lowers cotton textile output for those months. Likewise, dry afternoons lower cotton textile output. Since the bulk of spinning and weaving was performed in the daytime, humidity in the daytime (rather than at night) matters the most. To capture seasonal and within-24- hour variance in weaving suitability, I use both monthly and hourly information on relative humidity. The advantage of having a relative humidity index highly specific to cotton weaving is that I can avoid spurious correlations as relative humidity could be correlated with suitability for other economic activities. Also, because cotton textile output increases in the relative humidity index, it provides more precise information about women’s productivity than the treatment variable used in OLS regressions, which is a binary variable. F.2 Construction of the Instrument I construct a relative humidity index pertaining to suitability for cotton weaving. The index is termed the “Humidity-for-Weaving” Index. The first set of data is the 30-year monthly average relative humidity series from the Climate Research Unit of University of East Anglia. Those data are available across 10 arc-minute by 10 arc-minute grid cells (20km*20km) globally. The second set of data is the 6-hour relative humidity series from the National Oceanic and Atmospheric Administration where relative humidity was measured four times a day (6am, 12pm, 6pm and 12am) from 1981 to 2010. This data is at a higher frequency but with a lower resolution (2.5 degree by 2.5 degree). I take the following steps to construct the Humidity-for-Weaving Index: Step one, I compute the ratio between daytime humidity (6am, 12pm and 6pm) and full-day relative humidity using the low-resolution, high-frequency data. Step two, I back out monthly daytime humidity using the high-resolution data on monthly average relative humidity. Step three, I obtain the distance between monthly daytime humidity and optimal humidity for cotton weaving. Based on Stamper and Koral (1979) and Iqbal et al. (2012), cotton weaving is possible when relative humidity is between 60% and 85%.43 I take the distance between daytime humidity and 85%. The maximum distance is therefore 25%. Suitability for cotton weaving decreases in the distance to optimal humidity. Step four, I aggregate obtained monthly values over twelve months. Step five, I take the inverse of the total to create a 43 See Appendix D.1 for the range of sources on the relationship between relative humidity and cotton spinning and weaving. 30
  • 32. Humidity-for-Weaving Index such that the index increases in suitability for cotton weaving, and multiple it by 1,000. The index values range from 3.379 to 15.124. Figure II shows the distribution of the Humidity-for-Weaving Index at a county level in eight quantiles. Darker shades represent higher relative humidity and hence, higher suitability for cotton weaving. Missing values are shaded white. The finer details of the construction procedure are available in Appendix D.1. Figure II: Humidity-for-Weaving Index F.3 Validity of the Instrument For the instrumental variable strategy to work, the Humidity-for-Weaving Index has to affect long-run outcomes only through the cotton revolution. The Humidity-for-Weaving Index is intended to capture ideal conditions for cotton weaving. To ensure that relative humidity was not correlated with how productive it was to pursue other economic activities, I regress the Humidity-for-Weaving Index on other types of textiles. I show in Table IV that the instrument is strongly correlated with the spinning and weaving of cotton (column 1), but not with that of all types of raw material (hemp, silk and etc.) once controlling for cotton textiles (column 2). This is to be expected because the technical specifications for the production of other types pf textiles are very different. Silk is ideally weaved at a relative humidity of 60 to 70% (Stamper and Koral, 1979). The same source lists suggested ranges 31
  • 33. Table IV: The Impact of the Humidity-for-Weaving Index on Other Activities (1) (2) (3) Cotton Textiles Silk/hemp Raw (1300-1840) Textiles cotton Mean of Dep. Var. 0.478 0.784 0.555 Humidity-for-Weaving Index 0.0408∗∗∗ -0.00204 -0.0185∗∗ (0.0109) (0.00874) (0.00857) Baseline controls Yes Yes Yes Province FE Yes Yes Yes Socioeconomic Macroregion FE Yes Yes Yes Adjusted R2 0.441 0.445 0.715 Observations 1483 1483 1478 Notes: The table reports falsification tests of the Humidity-for-Weaving Index. The unit of observation is a county in the 2000 Census. All controls in column 3 of Table I are included, with the exception of the one that is the dependent variable in that specification. Socioeconomic macroregion and province fixed effects are included in all specifications. Robust standard errors are included in all specifications. Standard errors in parentheses ∗ p < 0.10, ∗∗ p < 0.05, ∗∗∗ p < 0.01 of relative humidity for other types of textiles, such as 50 to 55% RH for weaving woolens and 55 to 70% RH for weaving worsteds. I also show that the Humidity-for-Weaving Index is negatively correlated with suitability for raw cotton (column 3). To create a more exogenous source of variation in cotton textiles (1300-1840), I use the interaction between the Humidity-for-Weaving Index and distance to the center of national market (Suzhou) as my second instrument. The construction of the second instrument follows Pearl (2000). The distance to the center of national market itself is not a perfect instrument, since distance to the center of national market could affect modern gender inequality through past development. According to Pearl (2000), however, the interaction term between non- instrumental variables can still be an effective instrument. F.4 Instrumental Variable Results I begin my IV estimation by testing the relationship between my instruments and cotton textiles (1300-1840). Because my treatment variable is binary, I use Probit-2SLS as my esti- mation strategy. Probit-2SLS is a three-stage procedure recommended in Wooldridge (2002, pp.623-626). It uses a Probit model for the first stage.44 The purpose of using this estimation strategy is to properly model the relationship between the Humidity-for-Weaving Index and cotton textiles (1300-1840) in order to best mitigate the problem of weak instruments due to 44 The full procedure is as follows: first, use Probit to regress the treatment on the instrument and exogenous variables; second, use the predicted values from the first step in the first stage of a regular 2SLS procedure, together with the exogenous variables; third, run the second stage as in a regular 2SLS procedure. 32
  • 34. Table V: Cotton Revolution and Sex Ratio at Birth: Instrumental Variable Analysis (1) (2) (3) (4) OLS IV OLS IV Humidity-for-Weaving Index Humidity-for-Weaving Index (inverse) × log(dist. to Suzhou) Panel A: 2SLS Dependent variable: sex ratio at birth in 2000 Mean of Dep. Var. 118.7 118.7 118.7 118.7 Cotton textiles (1300-1840) -3.800∗∗∗ -6.368∗∗ -3.991∗∗∗ -4.757∗ (0.730) (3.197) (0.726) (2.731) Adjusted R2 0.364 0.360 0.373 0.372 Panel B: Probit Dependent variable: cotton textiles (1300-1840) Humidity-for-Weaving Index 0.255∗∗∗ ( 0.553) Humidity-for-Weaving Index (inverse) -3.3680∗∗∗ × log(dist. to Suzhou) ( 0.605) Pseudo R2 0.417 0.428 Humidity-for-Weaving Index No No Yes Yes Log(dist. to Suzhou) No No Yes Yes Baseline controls Yes Yes Yes Yes Province FE Yes Yes Yes Yes Socioeconomic Macroregion FE Yes Yes Yes Yes Observations 1467 1467 1467 1467 Notes: The table reports Probit-2SLS estimates. The unit of observation is a county in the 2000 Census. The dependent variable is sex ratio at birth. The full procedure has three stages. First-stage (Probit) and third-stage (2SLS) results are summarized in the table. The second stage is to calculate the predicted probability of cotton textile production. Baseline controls are the same as in column 3 of Table I. Robust standard errors are included in all specifications. Standard errors in parentheses * p < 0.10, ** p < 0.05, *** p < 0.01 omitted nonlinearity (D. J. Henderson and Parmeter, 2015).45 Panel A of Table V shows the estimates from the first stage: the instrument is positively correlated with cotton textiles (1300-1840). The second stage is to calculate the predicted probability of cotton textiles. The third stage is to regress sex ratio at birth on the predicted probability of cotton textiles. Third-stage results are reported in Panel B. Column 1 contains 45 D. J. Henderson and Parmeter (2015) shows that instruments that may be strong in a nonlinear re- lationship with the treatment could be weak when a linear relationship is imposed upon. An alternative method to address nonlinearities is to use a nonparametric instrument. However, Newey (2013) shows that nonparametric IV estimation only works well when the instrument is very strong. When the reduced form R2 is low, and a linear IV slope can be estimated, the variance of the coefficients of nonlinear terms will be very high. 33
  • 35. my OLS estimates. Column 2 reports my IV estimate with the Humidity-for-Weaving Index being the instrument. My IV estimate is that a one-standard-deviation increase in cotton textiles (1300-1840) leads to a reduction of sex ratio at birth by 3.184 boys per 100 girls (3.184=6.368*0.49). In columns 3-4, I use the interaction term of the Humidity-for-Weaving Index and the natural log of the distance to Suzhou as the instrument and include all baseline controls as well as the main effect of the Humidity-for-Weaving index and that of the distance to Suzhou. The use of this instrument yields IV estimates that are highly comparable to OLS estimates (-4.757 and -3.991). For robustness, I estimate the same regressions with (a.) a Humidity-for-Weaving Index constructed from full-day relative humidity and (b.) a Humidity-for-Weaving Index with a cutoff of 80% relative humidity (see Appendix D.3). VI The Emergence and Persistence of Gender-Equitable Beliefs A Modern Evidence on Gender-Equitable Beliefs Having shown the relationship between the cotton revolution and a reveal preference measure of cultural beliefs about women’s worth, I turn to more subjective measures. CGSS 2010 (Chinese General Social Surveys) is the first survey to contain questions directly related to gender-equitable beliefs. The first measure of gender-equitable beliefs is constructed from each respondent’s view of the following question: “Do you agree with the following statement: men are naturally more capable than women?” The second measure comes from the question: “Do you agree with the following statement: men should focus on career; women should focus on family?” The respondent can choose from a scale of 1 to 5 ranging from “completely disagree” to “completely agree”. I create a measure from two questions on the subjective assessment of how many sons and daughters one wants to have. For those who answer they want more daughters than sons, daughter preference takes on the value of one. For those who are indifferent between sons and daughters, i.e. they want the same number of sons and daughters, and those who want more sons than daughters, daughter preference takes on the value of zero. In addition, the CGSS includes information on age group, gender, urban/rural site, marital status, education attainment, communist party member status and urban hukou. I restrict the sample to the same geographic coverage as in the main sample (Section V). 34
  • 36. TableVI:Gender-EquitableBeliefs:EvidencefromCGSS MennaturallymorecapableWomenfocusonfamilyDaughterpreference (1)(2)(3)(4)(5)(6)(7)(8)(9) OLSOLSLogit MeanofDep.Var.2.9893.0063.0063.6383.6593.6580.09830.09750.0975 Cottontextiles(1300-1840)-0.165∗∗ -0.244∗∗∗ -0.239∗∗∗ -0.175∗∗ -0.195∗∗∗ -0.183∗∗∗ 0.196∗∗∗ 0.182+ 0.200∗ (0.066)(0.061)(0.057)(0.073)(0.068)(0.061)(0.064)(0.116)(0.120) IndividualcontrolsNoNoYesNoNoYesNoNoYes ContemporarycontrolsYesYesYesYesYesYesYesYesYes Historical&GeographicalcontrolsNoYesYesNoYesYesNoYesYes SocioeconomicMacroregionFEYesYesYesYesYesYesYesYesYes AdjustedR2 /PseudoR2 0.02590.02870.1020.05030.05350.1270.0120.0140.030 Observations645561616146646261686152639961056084 Notes:Thetablereportstheimpactofcottontextilesproduction(1300-1840)ongender-equitablebeliefs.Theunitofobservation isasurveyrespondentinCGSS2010(ChineseGeneralSocialSurveys).Contemporary,historicalandgeographicalcontrolsarethe sameasincolumn3ofTableI.Standarderrorsareclusteredatthecountylevel.Standarderrorsinparentheses+ p<0.15,∗ p<0.10,∗∗ p<0.05,∗∗∗ p<0.01 35