36x48_Trifold_FinalPoster
•Download as PPT, PDF•
0 likes•57 views

This document discusses using machine learning to automate tracking of data usage (DU) quality metrics. It outlines automating the collection of DU event data from multiple sources and storing it in a normalized database. Machine learning algorithms would then be implemented to predict DU events and identify contributing factors. Key steps completed include identifying relevant data sources and metrics, and setting up schemas to automatically update and pull data. Current work involves implementing predictive learning algorithms and refining the data extraction, transformation and loading processes. Challenges include dealing with nested hierarchical data, variable recording intervals, and changing features between releases.

Recommended
More Related Content
What's hot
What's hot (20)
Similar to 36x48_Trifold_FinalPoster
Similar to 36x48_Trifold_FinalPoster (20)
36x48_Trifold_FinalPoster
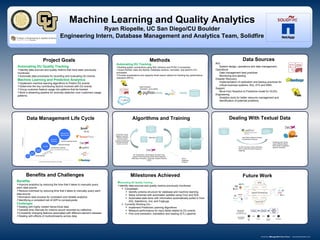
- 1. Machine Learning and Quality Analytics Ryan Riopelle, UC San Diego/CU Boulder Engineering Intern, Database Management and Analytics Team, Solidfire Automating DU Quality Tracking Identify data sources and quality metrics that have been previously monitored. Automate data processes for recording and evaluating DU events. Machine Learning and Predictive Analytics Implement machine learning algorithms to Predict DU events. Determine the key contributing factors involved with DU events Group customer feature usage into patterns that be tracked. Build a streaming pipeline for anomaly detection over customers usage patterns. Future Work Methods Milestones Achieved Project Goals Benefits and Challenges Query Data K- Means Clustering Columns Clustering Input: Group using K-Means, Means Shift, Affinity Propagation, Spectral Clustering Use Cluster Variance Analysis to Determine N-Groups TF-IDF Vectorizer Python Dictionary (IDF) Inverse Document Frequency weighting Clustered Categorical Data Split Data Test Data Training Data Out to Streaming Analysis ML Classification: Ada Boosting, Boosted Trees, Support Vector Machines (SVM), Neural Networks (Multi-layer Perceptron), Stochastic Gradient Descent (SGD) Optimization Tuning: Bagging, Ensembles, Boosting, Changing Kernel Functions, Changing Learning Rate/ Step Size Parameter, Loss/Error Function Benefits Improve analytics by reducing the time that it takes to manually query each data source. Reduce overhead by reducing time that it takes to manually query each data source. Normalize data process for consistent and reliable analytics. Identifying a consistent set of (KPI’s) companywide. Challenges Dealing with highly nested hierarchical data. Variable time intervals for metrics record recorded by collectors. Constantly changing features associated with different element releases. Dealing with effects of multicollinearity across data. AIQ System design, operations and data management. Operations Data management best practices Monitoring and alerting Disaster Recovery Implementation of replication and backup practices for critical business systems. AIQ, AT2 and DMA. Support Move from Reactive to Predictive model for DU/DL Engineering Analytics tools for better resource management and identification of potential problems. . Automating DU Quality Tracking Identify data sources and quality metrics previously monitored. Completed– Identify schema structure for database and machine learning. Setup schemas with automated updates using Cron and SQL. Automated data store with information automatically pulled in from AIQ, Salesforce, Jira, and Fogbugs. Currently Working On– Implement Predictive Learning Algorithms Measure performance for input fields related to DU events Fine tune extraction, translation and loading (ETL) pipeline . Data Sources Normalized Data Store Data Extraction, Translation, and Loading Automating DU Tracking Building python connections using SQL Alchemy and PYSH 2 connectors. Import NoSQL Data into MySQL Database schema, normalize, and perform ETL processes. Provide visualizations and regularly timed export options for tracking key performance indicators (KPI’s). Algorithms and TrainingData Management Life Cycle Dealing With Textual Data