SlideShare ist ein Scribd-Unternehmen logo
1 von 3
Downloaden Sie, um offline zu lesen
CBD vacancy rate vs. asking rate
Source: JLL Research
NKY Riverfront vacancy rate projection
Source: JLL Research, Excludes government buildings*
Major planned office projects
Source: JLL Research
Property Developer Bldg s.f.
Blue Ash Airport Al Neyer 600,000
Northpointe Scott Street 260,000
Greens at Kenwood Neyer Properties 250,500
Oakley Station Vandercar 180,000
3%
13%
23%
33%
43%
2011 2012 2013 2014 2015 2016 2017
Without new HQ With new HQ
$22.00
$22.20
$22.40
$22.60
$22.80
$23.00
2012 2013 2014 2015 2016
10.0%
15.0%
20.0%
25.0%
Vacancy Asking Rate
GE Building, streetcar deliver in Q3 as CBD momentum continues
Of the numerous high-profile projects that have taken place in Cincinnati’s
reinvigorated urban core of the last five years perhaps none have been more
highly anticipated than the Streetcar and GE Global operations center at the
Banks. The third quarter saw the delivery of both projects, which were
accompanied with declining vacancy and significant absorption. While GE
provided the big splash, leasing activity within the CBD remained positive and
market fundamentals continued to tighten. In addition, the $106 million Fourth
and Race mixed-use project commenced. These projects further solidify the
CBD as a live-work-play environment and are driving downtown leasing activity.
Third quarter provides bittersweet announcements for NKY Riverfront
CTI Clinical Trial and Consulting Services announced it would relocate from it’s
Blue Ash Headquarters to RiverCenter II, a big win Covington. The company will
relocate 250 employees in the first quarter of 2017 with 500 additional
employees added over the next 12 years. Unfortunately the announcement was
followed by the news that the IRS will end it’s submission processing operation in
Covington after the 2019 filing season. The mixed-bag of headlines creates a
great opportunity for Covington, which contains the majority of office supply in
the NKY Riverfront submarket. In the coming years landlords will have quality
blocks of space available accompanied with an educated work force.
Market strengthens, developers still await commitments from large users
With the recent success of newly delivered speculative buildings and large build-
to-suit projects, as well as organic growth within the market, vacancy rates
across Cincinnati are decreasing as the market tightens. User demand within the
market has remained high leading to increases in rental rates. This activity has
caused for a favorable environment for developers to operate in. While
developers are confident in the market due to the recent activity, they are
cautiously waiting to build speculative space until large users commit to prelease
their projects. As the speculative space in the current pipeline is filled and the
market tightens further, look for developers to become more motivated to break
ground on their ambitious projects.
Large absorption gains lead to big third quarter
2,257
Office Insight
Cincinnati | Q3 2016
35,264,038
Total inventory (s.f.)
623,599
Q3 2016 net absorption (s.f.)
$19.41
Direct average asking rent
260,000
Total under construction (s.f.)
16.1%
Total vacancy
1,254,696
YTD net absorption (s.f.)
0.9%
12-month rent growth
11.0%
Total preleased
Current conditions – submarket Historical leasing activity (s.f.)
Source: JLL Research Source: JLL Research
Total net absorption (s.f.)
Source: JLL Research
Total vacancy rate (%)
Source: JLL Research
Direct average asking rent ($ p.s.f.)
Source: JLL Research
953,267
815,426
-123,487
-38,624
79,469 143,641
290,120
562,970
763,222
1,254,696
-500,000
0
500,000
1,000,000
1,500,000
2007 2008 2009 2010 2011 2012 2013 2014 2015 YTD 2016
$19.16 $19.25
$18.45
$17.39
$17.94
$18.41
$19.68
$19.15 $19.24
$19.41
$16.00
$17.00
$18.00
$19.00
$20.00
2007 2008 2009 2010 2011 2012 2013 2014 2015 YTD 2016
17.3% 18.1%
19.4%
22.7% 22.6% 22.5%
21.3%
19.8%
18.1%
16.1%
5.0%
10.0%
15.0%
20.0%
25.0%
2007 2008 2009 2010 2011 2012 2013 2014 2015 YTD 2016
1,700,000 1,800,000
2,200,000
1,891,000 1,794,000
0
500,000
1,000,000
1,500,000
2,000,000
2,500,000
2012 2013 2014 2015 YTD 2016
©2016 Jones Lang LaSalle IP, Inc. All rights reserved.For more information, contact: Ross Bratcher | ross.bratcher@am.jll.com
Landlordleverage
Tenantleverage
Peaking
market
Falling
market
Rising
market
Blue Ash / Montgomery,
Midtown, Fields Ertel /
Mason, West Chester
CBD Peripheral,
NKY Riverfront
East, West
Kenwood
Bottoming
market
Northern Kentucky
2,257
Office Statistics
Cincinnati | Q3 2016
Class Inventory (s.f.)
Total net
absorption
(s.f.)
YTD total net
absorption
(s.f.)
YTD total net
absorption (%
of stock)
Direct vacancy
(%)
Total vacancy
(%)
Average direct
asking rent ($
p.s.f.)
YTD
completions
(s.f.)
Under
construction
(s.f.)
CBD Totals 12,266,866 340,171 443,245 3.6% 15.5% 16.5% $20.27 338,000 0
CBD Peripheral Totals 1,622,161 10,306 -72,364 -4.5% 30.4% 30.4% $18.97 0 0
Midtown Totals 2,376,193 57,477 386,122 16.2% 7.8% 8.5% $21.67 365,000 0
Urban Totals 16,265,220 407,954 757,003 4.7% 15.9% 16.7% $20.12 703,000 0
Blue Ash/Montgomery Totals 4,889,330 26,908 42,358 0.9% 9.7% 9.8% $17.62 0 143,000
East Totals 1,128,534 1,576 13,959 1.2% 9.5% 9.5% $16.60 0 0
Fields Ertel/Mason Totals 2,604,432 89,446 154,408 5.9% 13.2% 13.5% $19.65 83,000 60,000
Kenwood Totals 1,451,516 12,168 101,777 7.0% 8.8% 9.1% $25.46 0 0
Northern Kentucky Totals 2,657,389 69,654 123,281 4.6% 14.1% 14.7% $18.08 0 57,000
Northern Kentucky Riverfront Totals 1,435,604 -1,749 4,102 0.3% 34.1% 34.1% $21.72 0 0
Tri-County Totals 3,133,895 -772 116,479 3.7% 23.3% 24.5% $15.87 0 0
West Totals 156,329 0 9,945 6.4% 14.0% 14.0% $16.93 0 0
West Chester Totals 1,541,789 18,414 -68,616 -4.5% 15.0% 15.0% $21.33 0 0
Suburbs Totals 18,998,818 215,645 497,693 2.6% 15.3% 15.6% $18.77 83,000 260,000
Cincinnati Totals 35,264,038 623,599 1,254,696 3.6% 15.5% 16.1% $19.41 786,000 260,000
CBD A 7,478,198 363,966 451,703 6.0% 14.8% 15.8% $22.78 338,000 0
CBD Peripheral A 789,967 7,135 -86,952 -11.0% 40.1% 40.1% $21.41 0 0
Midtown A 1,723,546 39,786 381,953 22.2% 8.4% 9.0% $22.71 365,000 0
Urban A 9,991,711 410,887 746,704 7.5% 15.7% 16.5% $22.50 703,000 0
Blue Ash/Montgomery A 2,906,394 7,479 21,827 0.8% 6.1% 6.1% $20.44 0 143,000
East A 741,078 0 11,786 1.6% 2.1% 2.1% $17.93 0 0
Fields Ertel/Mason A 2,063,777 87,181 150,103 7.3% 12.2% 12.4% $21.00 83,000 60,000
Kenwood A 1,031,123 5,381 96,943 9.4% 8.6% 9.1% $27.51 0 0
Northern Kentucky A 1,368,910 16,407 26,044 1.9% 12.7% 13.7% $19.48 0 57,000
Northern Kentucky Riverfront A 1,320,104 -503 3,068 0.2% 35.6% 35.6% $21.91 0 0
Tri-County A 1,141,529 995 13,837 1.2% 11.5% 12.6% $19.89 0 0
West A 22,472 0 5,382 23.9% 28.9% 28.9% $18.95 0 0
West Chester A 1,329,626 13,570 -67,100 -5.0% 14.5% 14.5% $22.20 0 0
Suburbs A 11,925,013 130,510 261,890 2.2% 12.6% 12.9% $21.44 83,000 260,000
Cincinnati A 21,916,724 541,397 1,008,594 4.6% 14.0% 14.6% $21.98 786,000 260,000
CBD B 4,788,668 -23,795 -8,458 -0.2% 16.5% 17.6% $16.76 0 0
CBD Peripheral B 832,194 3,171 14,588 1.8% 21.2% 21.2% $14.59 0 0
Midtown B 652,647 17,691 4,169 0.6% 6.2% 7.0% $17.96 0 0
Urban B 6,273,509 -2,933 10,299 0.2% 16.1% 17.0% $16.43 0 0
Blue Ash/Montgomery B 1,982,936 19,429 20,531 1.0% 15.1% 15.1% $15.96 0 0
East B 387,456 1,576 2,173 0.6% 23.8% 23.8% $16.38 0 0
Fields Ertel/Mason B 540,655 2,265 4,305 0.8% 17.2% 17.6% $15.98 0 0
Kenwood B 420,393 6,787 4,834 1.1% 9.1% 9.1% $20.71 0 0
Northern Kentucky B 1,288,479 53,247 97,237 7.5% 15.7% 15.7% $16.89 0 0
Northern Kentucky Riverfront B 115,500 -1,246 1,034 0.9% 17.3% 17.3% $17.15 0 0
Tri-County B 1,992,366 -1,767 102,642 5.2% 30.1% 31.4% $14.99 0 0
West B 133,857 0 4,563 3.4% 11.5% 11.5% $16.08 0 0
West Chester B 212,163 4,844 -1,516 -0.7% 18.2% 18.2% $17.03 0 0
Suburbs B 7,073,805 85,135 235,803 3.3% 19.8% 20.2% $15.89 0 0
Cincinnati B 13,347,314 82,202 246,102 1.8% 18.0% 18.6% $16.11 0 0
©2016 Jones Lang LaSalle IP, Inc. All rights reserved.For more information, contact: Ross Bratcher | ross.bratcher@am.jll.com

Weitere ähnliche Inhalte

Was ist angesagt?

JLL Pittsburgh Office Insight & Statistics - Q3 2021
JLL Pittsburgh Office Insight & Statistics - Q3 2021JLL Pittsburgh Office Insight & Statistics - Q3 2021
JLL Pittsburgh Office Insight & Statistics - Q3 2021Tobiah Bilski
 
JLL Pittsburgh Industrial Insight & Statistics - Q3 2017
JLL Pittsburgh Industrial Insight & Statistics - Q3 2017JLL Pittsburgh Industrial Insight & Statistics - Q3 2017
JLL Pittsburgh Industrial Insight & Statistics - Q3 2017Tobiah Bilski
 
JLL Cleveland Office Outlook: Q4 2018
JLL Cleveland Office Outlook: Q4 2018JLL Cleveland Office Outlook: Q4 2018
JLL Cleveland Office Outlook: Q4 2018Andrew Batson
 
JLL Pittsburgh Office Insight & Statistics - Q1 2019
JLL Pittsburgh Office Insight & Statistics - Q1 2019JLL Pittsburgh Office Insight & Statistics - Q1 2019
JLL Pittsburgh Office Insight & Statistics - Q1 2019Tobiah Bilski
 
JLL Cleveland Office Outlook: Q2 2018
JLL Cleveland Office Outlook: Q2 2018JLL Cleveland Office Outlook: Q2 2018
JLL Cleveland Office Outlook: Q2 2018Andrew Batson
 
JLL Grand Rapids Office Insight & Statistics - Q3 2018
JLL Grand Rapids Office Insight & Statistics - Q3 2018JLL Grand Rapids Office Insight & Statistics - Q3 2018
JLL Grand Rapids Office Insight & Statistics - Q3 2018Harrison West
 
JLL Detroit Office Insight & Statistics - Q2 2019
JLL Detroit Office Insight & Statistics - Q2 2019JLL Detroit Office Insight & Statistics - Q2 2019
JLL Detroit Office Insight & Statistics - Q2 2019Harrison West
 
JLL Pittsburgh Office Insight & Statistics - Q3 2019
 JLL Pittsburgh Office Insight & Statistics - Q3 2019 JLL Pittsburgh Office Insight & Statistics - Q3 2019
JLL Pittsburgh Office Insight & Statistics - Q3 2019Tobiah Bilski
 
JLL Grand Rapids Office Insight & Statistics - Q2 2019
JLL Grand Rapids Office Insight & Statistics - Q2 2019JLL Grand Rapids Office Insight & Statistics - Q2 2019
JLL Grand Rapids Office Insight & Statistics - Q2 2019Harrison West
 
JLL Cleveland Office Outlook: Q4 2017
JLL Cleveland Office Outlook: Q4 2017JLL Cleveland Office Outlook: Q4 2017
JLL Cleveland Office Outlook: Q4 2017Andrew Batson
 
JLL Pittsburgh Office Insight & Statistics - Q2 2019
JLL Pittsburgh Office Insight & Statistics - Q2 2019JLL Pittsburgh Office Insight & Statistics - Q2 2019
JLL Pittsburgh Office Insight & Statistics - Q2 2019Tobiah Bilski
 
JLL Cleveland Office Outlook: Q2 2018
JLL Cleveland Office Outlook: Q2 2018JLL Cleveland Office Outlook: Q2 2018
JLL Cleveland Office Outlook: Q2 2018Andrew Batson
 
Pittsburgh Office Insight & Stats Q1 2022
Pittsburgh Office Insight & Stats Q1 2022Pittsburgh Office Insight & Stats Q1 2022
Pittsburgh Office Insight & Stats Q1 2022Tobiah Bilski
 
JLL Cleveland Office Outlook: Q3 2018
JLL Cleveland Office Outlook: Q3 2018JLL Cleveland Office Outlook: Q3 2018
JLL Cleveland Office Outlook: Q3 2018Andrew Batson
 
Q4 2014 San Francisco Office Report
Q4 2014 San Francisco Office ReportQ4 2014 San Francisco Office Report
Q4 2014 San Francisco Office ReportCoy Davidson
 
JLL Pittsburgh Office Insight & Statistics - Q1 2018
JLL Pittsburgh Office Insight & Statistics - Q1 2018JLL Pittsburgh Office Insight & Statistics - Q1 2018
JLL Pittsburgh Office Insight & Statistics - Q1 2018Tobiah Bilski
 
JLL Pittsburgh Office Insight & Statistics - Q4 2018
JLL Pittsburgh Office Insight & Statistics - Q4 2018JLL Pittsburgh Office Insight & Statistics - Q4 2018
JLL Pittsburgh Office Insight & Statistics - Q4 2018Tobiah Bilski
 

Was ist angesagt? (19)

JLL Pittsburgh Office Insight & Statistics - Q3 2021
JLL Pittsburgh Office Insight & Statistics - Q3 2021JLL Pittsburgh Office Insight & Statistics - Q3 2021
JLL Pittsburgh Office Insight & Statistics - Q3 2021
 
JLL Pittsburgh Industrial Insight & Statistics - Q3 2017
JLL Pittsburgh Industrial Insight & Statistics - Q3 2017JLL Pittsburgh Industrial Insight & Statistics - Q3 2017
JLL Pittsburgh Industrial Insight & Statistics - Q3 2017
 
JLL Cleveland Office Outlook: Q4 2018
JLL Cleveland Office Outlook: Q4 2018JLL Cleveland Office Outlook: Q4 2018
JLL Cleveland Office Outlook: Q4 2018
 
JLL Pittsburgh Office Insight & Statistics - Q1 2019
JLL Pittsburgh Office Insight & Statistics - Q1 2019JLL Pittsburgh Office Insight & Statistics - Q1 2019
JLL Pittsburgh Office Insight & Statistics - Q1 2019
 
JLL Cleveland Office Outlook: Q2 2018
JLL Cleveland Office Outlook: Q2 2018JLL Cleveland Office Outlook: Q2 2018
JLL Cleveland Office Outlook: Q2 2018
 
JLL Grand Rapids Office Insight & Statistics - Q3 2018
JLL Grand Rapids Office Insight & Statistics - Q3 2018JLL Grand Rapids Office Insight & Statistics - Q3 2018
JLL Grand Rapids Office Insight & Statistics - Q3 2018
 
JLL Detroit Office Insight & Statistics - Q2 2019
JLL Detroit Office Insight & Statistics - Q2 2019JLL Detroit Office Insight & Statistics - Q2 2019
JLL Detroit Office Insight & Statistics - Q2 2019
 
JLL Pittsburgh Office Insight & Statistics - Q3 2019
 JLL Pittsburgh Office Insight & Statistics - Q3 2019 JLL Pittsburgh Office Insight & Statistics - Q3 2019
JLL Pittsburgh Office Insight & Statistics - Q3 2019
 
JLL Grand Rapids Office Insight & Statistics - Q2 2019
JLL Grand Rapids Office Insight & Statistics - Q2 2019JLL Grand Rapids Office Insight & Statistics - Q2 2019
JLL Grand Rapids Office Insight & Statistics - Q2 2019
 
Granite ridge tif
Granite ridge tifGranite ridge tif
Granite ridge tif
 
JLL Cleveland Office Outlook: Q4 2017
JLL Cleveland Office Outlook: Q4 2017JLL Cleveland Office Outlook: Q4 2017
JLL Cleveland Office Outlook: Q4 2017
 
JLL Pittsburgh Office Insight & Statistics - Q2 2019
JLL Pittsburgh Office Insight & Statistics - Q2 2019JLL Pittsburgh Office Insight & Statistics - Q2 2019
JLL Pittsburgh Office Insight & Statistics - Q2 2019
 
JLL Cleveland Office Outlook: Q2 2018
JLL Cleveland Office Outlook: Q2 2018JLL Cleveland Office Outlook: Q2 2018
JLL Cleveland Office Outlook: Q2 2018
 
2021 Q3 Office Austin Report
2021 Q3 Office Austin Report2021 Q3 Office Austin Report
2021 Q3 Office Austin Report
 
Pittsburgh Office Insight & Stats Q1 2022
Pittsburgh Office Insight & Stats Q1 2022Pittsburgh Office Insight & Stats Q1 2022
Pittsburgh Office Insight & Stats Q1 2022
 
JLL Cleveland Office Outlook: Q3 2018
JLL Cleveland Office Outlook: Q3 2018JLL Cleveland Office Outlook: Q3 2018
JLL Cleveland Office Outlook: Q3 2018
 
Q4 2014 San Francisco Office Report
Q4 2014 San Francisco Office ReportQ4 2014 San Francisco Office Report
Q4 2014 San Francisco Office Report
 
JLL Pittsburgh Office Insight & Statistics - Q1 2018
JLL Pittsburgh Office Insight & Statistics - Q1 2018JLL Pittsburgh Office Insight & Statistics - Q1 2018
JLL Pittsburgh Office Insight & Statistics - Q1 2018
 
JLL Pittsburgh Office Insight & Statistics - Q4 2018
JLL Pittsburgh Office Insight & Statistics - Q4 2018JLL Pittsburgh Office Insight & Statistics - Q4 2018
JLL Pittsburgh Office Insight & Statistics - Q4 2018
 

Ähnlich wie JLL Cincinnati Office Insight & Statistics - Q3 2016

Jll cincinnati office outlook q2 2017
Jll cincinnati office outlook   q2 2017Jll cincinnati office outlook   q2 2017
Jll cincinnati office outlook q2 2017Abby Armbruster
 
Q1 2017 - Chicago Suburbs Office Reports
Q1 2017 - Chicago Suburbs Office ReportsQ1 2017 - Chicago Suburbs Office Reports
Q1 2017 - Chicago Suburbs Office ReportsHailey Harrington
 
JLL Pittsburgh Office Insight & Statistics - Q3 2018
JLL Pittsburgh Office Insight & Statistics - Q3 2018JLL Pittsburgh Office Insight & Statistics - Q3 2018
JLL Pittsburgh Office Insight & Statistics - Q3 2018Tobiah Bilski
 
JLL Detroit Office Insight & Statistics - Q3 2018
JLL Detroit Office Insight & Statistics - Q3 2018JLL Detroit Office Insight & Statistics - Q3 2018
JLL Detroit Office Insight & Statistics - Q3 2018Harrison West
 
St. Louis Office Outlook Q3 2016
St. Louis Office Outlook Q3 2016St. Louis Office Outlook Q3 2016
St. Louis Office Outlook Q3 2016Blaise Tomazic
 
St. Louis Office Outlook Q2 2016
St. Louis Office Outlook Q2 2016St. Louis Office Outlook Q2 2016
St. Louis Office Outlook Q2 2016Blaise Tomazic
 
JLL Cincinnati Office Outlook Q4 2020
JLL Cincinnati Office Outlook Q4 2020JLL Cincinnati Office Outlook Q4 2020
JLL Cincinnati Office Outlook Q4 2020Abby Armbruster
 
JLL Downtown Chicago Office Market Update - Q3 2016
JLL Downtown Chicago Office Market Update - Q3 2016JLL Downtown Chicago Office Market Update - Q3 2016
JLL Downtown Chicago Office Market Update - Q3 2016Hailey Harrington
 
JLL Detroit Office Insight & Statistics – Q2 2016
JLL Detroit Office Insight & Statistics – Q2 2016JLL Detroit Office Insight & Statistics – Q2 2016
JLL Detroit Office Insight & Statistics – Q2 2016Aaron Moore
 
JLL Detroit Office Insight & Statistics - Q3 2017
JLL Detroit Office Insight & Statistics - Q3 2017JLL Detroit Office Insight & Statistics - Q3 2017
JLL Detroit Office Insight & Statistics - Q3 2017Harrison West
 
JLL Detroit Office Insight & Statistics - Q1 2018
JLL Detroit Office Insight & Statistics - Q1 2018JLL Detroit Office Insight & Statistics - Q1 2018
JLL Detroit Office Insight & Statistics - Q1 2018Harrison West
 
JLL Louisville Office Outlook - Q3 2018
JLL Louisville Office Outlook - Q3 2018JLL Louisville Office Outlook - Q3 2018
JLL Louisville Office Outlook - Q3 2018Alex Westcott
 
Q4 2014 san_francisco_office
Q4 2014 san_francisco_officeQ4 2014 san_francisco_office
Q4 2014 san_francisco_officeCoy Davidson
 
JLL Cleveland Office Outlook: Q1 2018
JLL Cleveland Office Outlook: Q1 2018JLL Cleveland Office Outlook: Q1 2018
JLL Cleveland Office Outlook: Q1 2018Andrew Batson
 
JLL Cleveland Office Outlook: Q1 2018
JLL Cleveland Office Outlook: Q1 2018JLL Cleveland Office Outlook: Q1 2018
JLL Cleveland Office Outlook: Q1 2018Andrew Batson
 
JLL Cleveland Office Outlook: Q4 2020
JLL Cleveland Office Outlook: Q4 2020JLL Cleveland Office Outlook: Q4 2020
JLL Cleveland Office Outlook: Q4 2020Andrew Batson
 
JLL Cincinnati Industrial Outlook - Q3 2016
JLL Cincinnati Industrial Outlook - Q3 2016JLL Cincinnati Industrial Outlook - Q3 2016
JLL Cincinnati Industrial Outlook - Q3 2016Ross Bratcher
 
JLL Detroit Office Insight & Statistics - Q4 2019
JLL Detroit Office Insight & Statistics - Q4 2019JLL Detroit Office Insight & Statistics - Q4 2019
JLL Detroit Office Insight & Statistics - Q4 2019Harrison West
 
JLL Detroit Office Insight & Statistics - Q4 2018
JLL Detroit Office Insight & Statistics - Q4 2018JLL Detroit Office Insight & Statistics - Q4 2018
JLL Detroit Office Insight & Statistics - Q4 2018Harrison West
 

Ähnlich wie JLL Cincinnati Office Insight & Statistics - Q3 2016 (20)

Jll cincinnati office outlook q2 2017
Jll cincinnati office outlook   q2 2017Jll cincinnati office outlook   q2 2017
Jll cincinnati office outlook q2 2017
 
Q1 2017 - Chicago Suburbs Office Reports
Q1 2017 - Chicago Suburbs Office ReportsQ1 2017 - Chicago Suburbs Office Reports
Q1 2017 - Chicago Suburbs Office Reports
 
JLL Pittsburgh Office Insight & Statistics - Q3 2018
JLL Pittsburgh Office Insight & Statistics - Q3 2018JLL Pittsburgh Office Insight & Statistics - Q3 2018
JLL Pittsburgh Office Insight & Statistics - Q3 2018
 
JLL Detroit Office Insight & Statistics - Q3 2018
JLL Detroit Office Insight & Statistics - Q3 2018JLL Detroit Office Insight & Statistics - Q3 2018
JLL Detroit Office Insight & Statistics - Q3 2018
 
St. Louis Office Outlook Q3 2016
St. Louis Office Outlook Q3 2016St. Louis Office Outlook Q3 2016
St. Louis Office Outlook Q3 2016
 
St. Louis Office Outlook Q2 2016
St. Louis Office Outlook Q2 2016St. Louis Office Outlook Q2 2016
St. Louis Office Outlook Q2 2016
 
JLL Cincinnati Office Outlook Q4 2020
JLL Cincinnati Office Outlook Q4 2020JLL Cincinnati Office Outlook Q4 2020
JLL Cincinnati Office Outlook Q4 2020
 
JLL Downtown Chicago Office Market Update - Q3 2016
JLL Downtown Chicago Office Market Update - Q3 2016JLL Downtown Chicago Office Market Update - Q3 2016
JLL Downtown Chicago Office Market Update - Q3 2016
 
JLL Detroit Office Insight & Statistics – Q2 2016
JLL Detroit Office Insight & Statistics – Q2 2016JLL Detroit Office Insight & Statistics – Q2 2016
JLL Detroit Office Insight & Statistics – Q2 2016
 
SVNR Office Market Report Q116
SVNR Office Market Report Q116SVNR Office Market Report Q116
SVNR Office Market Report Q116
 
JLL Detroit Office Insight & Statistics - Q3 2017
JLL Detroit Office Insight & Statistics - Q3 2017JLL Detroit Office Insight & Statistics - Q3 2017
JLL Detroit Office Insight & Statistics - Q3 2017
 
JLL Detroit Office Insight & Statistics - Q1 2018
JLL Detroit Office Insight & Statistics - Q1 2018JLL Detroit Office Insight & Statistics - Q1 2018
JLL Detroit Office Insight & Statistics - Q1 2018
 
JLL Louisville Office Outlook - Q3 2018
JLL Louisville Office Outlook - Q3 2018JLL Louisville Office Outlook - Q3 2018
JLL Louisville Office Outlook - Q3 2018
 
Q4 2014 san_francisco_office
Q4 2014 san_francisco_officeQ4 2014 san_francisco_office
Q4 2014 san_francisco_office
 
JLL Cleveland Office Outlook: Q1 2018
JLL Cleveland Office Outlook: Q1 2018JLL Cleveland Office Outlook: Q1 2018
JLL Cleveland Office Outlook: Q1 2018
 
JLL Cleveland Office Outlook: Q1 2018
JLL Cleveland Office Outlook: Q1 2018JLL Cleveland Office Outlook: Q1 2018
JLL Cleveland Office Outlook: Q1 2018
 
JLL Cleveland Office Outlook: Q4 2020
JLL Cleveland Office Outlook: Q4 2020JLL Cleveland Office Outlook: Q4 2020
JLL Cleveland Office Outlook: Q4 2020
 
JLL Cincinnati Industrial Outlook - Q3 2016
JLL Cincinnati Industrial Outlook - Q3 2016JLL Cincinnati Industrial Outlook - Q3 2016
JLL Cincinnati Industrial Outlook - Q3 2016
 
JLL Detroit Office Insight & Statistics - Q4 2019
JLL Detroit Office Insight & Statistics - Q4 2019JLL Detroit Office Insight & Statistics - Q4 2019
JLL Detroit Office Insight & Statistics - Q4 2019
 
JLL Detroit Office Insight & Statistics - Q4 2018
JLL Detroit Office Insight & Statistics - Q4 2018JLL Detroit Office Insight & Statistics - Q4 2018
JLL Detroit Office Insight & Statistics - Q4 2018
 

Mehr von Ross Bratcher

JLL Louisville Industrial Outlook Q3 2017
JLL Louisville Industrial Outlook  Q3 2017 JLL Louisville Industrial Outlook  Q3 2017
JLL Louisville Industrial Outlook Q3 2017 Ross Bratcher
 
JLL Louisville Office Outlook - Q1 2017
JLL Louisville Office Outlook - Q1 2017JLL Louisville Office Outlook - Q1 2017
JLL Louisville Office Outlook - Q1 2017Ross Bratcher
 
JLL Louisville Industrial Outlook - Q1 2017
JLL Louisville Industrial Outlook - Q1 2017 JLL Louisville Industrial Outlook - Q1 2017
JLL Louisville Industrial Outlook - Q1 2017 Ross Bratcher
 
JLL Louisville: Full Circle Report 2017
JLL Louisville: Full Circle Report 2017JLL Louisville: Full Circle Report 2017
JLL Louisville: Full Circle Report 2017Ross Bratcher
 
JLL Cincinnati: Full Circle Report 2017
JLL Cincinnati: Full Circle Report 2017JLL Cincinnati: Full Circle Report 2017
JLL Cincinnati: Full Circle Report 2017Ross Bratcher
 
JLL Louisville Industrial Outlook - Q4 2016
JLL Louisville Industrial Outlook - Q4 2016JLL Louisville Industrial Outlook - Q4 2016
JLL Louisville Industrial Outlook - Q4 2016Ross Bratcher
 
JLL Louisville Office Insight & Statistics - Q4 2016
JLL Louisville Office Insight & Statistics -  Q4 2016JLL Louisville Office Insight & Statistics -  Q4 2016
JLL Louisville Office Insight & Statistics - Q4 2016Ross Bratcher
 
JLL Louisville Industrial Outlook - Q3 2016
JLL Louisville Industrial Outlook - Q3 2016JLL Louisville Industrial Outlook - Q3 2016
JLL Louisville Industrial Outlook - Q3 2016Ross Bratcher
 
JLL Louisville Office Insight & Statistics - Q3 2016
JLL Louisville Office Insight & Statistics - Q3 2016JLL Louisville Office Insight & Statistics - Q3 2016
JLL Louisville Office Insight & Statistics - Q3 2016Ross Bratcher
 
JLL Columbus Chart of the Week: November 23, 2015
JLL Columbus Chart of the Week: November 23, 2015 JLL Columbus Chart of the Week: November 23, 2015
JLL Columbus Chart of the Week: November 23, 2015 Ross Bratcher
 

Mehr von Ross Bratcher (10)

JLL Louisville Industrial Outlook Q3 2017
JLL Louisville Industrial Outlook  Q3 2017 JLL Louisville Industrial Outlook  Q3 2017
JLL Louisville Industrial Outlook Q3 2017
 
JLL Louisville Office Outlook - Q1 2017
JLL Louisville Office Outlook - Q1 2017JLL Louisville Office Outlook - Q1 2017
JLL Louisville Office Outlook - Q1 2017
 
JLL Louisville Industrial Outlook - Q1 2017
JLL Louisville Industrial Outlook - Q1 2017 JLL Louisville Industrial Outlook - Q1 2017
JLL Louisville Industrial Outlook - Q1 2017
 
JLL Louisville: Full Circle Report 2017
JLL Louisville: Full Circle Report 2017JLL Louisville: Full Circle Report 2017
JLL Louisville: Full Circle Report 2017
 
JLL Cincinnati: Full Circle Report 2017
JLL Cincinnati: Full Circle Report 2017JLL Cincinnati: Full Circle Report 2017
JLL Cincinnati: Full Circle Report 2017
 
JLL Louisville Industrial Outlook - Q4 2016
JLL Louisville Industrial Outlook - Q4 2016JLL Louisville Industrial Outlook - Q4 2016
JLL Louisville Industrial Outlook - Q4 2016
 
JLL Louisville Office Insight & Statistics - Q4 2016
JLL Louisville Office Insight & Statistics -  Q4 2016JLL Louisville Office Insight & Statistics -  Q4 2016
JLL Louisville Office Insight & Statistics - Q4 2016
 
JLL Louisville Industrial Outlook - Q3 2016
JLL Louisville Industrial Outlook - Q3 2016JLL Louisville Industrial Outlook - Q3 2016
JLL Louisville Industrial Outlook - Q3 2016
 
JLL Louisville Office Insight & Statistics - Q3 2016
JLL Louisville Office Insight & Statistics - Q3 2016JLL Louisville Office Insight & Statistics - Q3 2016
JLL Louisville Office Insight & Statistics - Q3 2016
 
JLL Columbus Chart of the Week: November 23, 2015
JLL Columbus Chart of the Week: November 23, 2015 JLL Columbus Chart of the Week: November 23, 2015
JLL Columbus Chart of the Week: November 23, 2015
 

Kürzlich hochgeladen

Ryan Mahoney - How Property Technology Is Altering the Real Estate Market
Ryan Mahoney - How Property Technology Is Altering the Real Estate MarketRyan Mahoney - How Property Technology Is Altering the Real Estate Market
Ryan Mahoney - How Property Technology Is Altering the Real Estate MarketRyan Mahoney
 
Call Girls In Sahibabad Ghaziabad ❤️8860477959 Low Rate Escorts Service In 24...
Call Girls In Sahibabad Ghaziabad ❤️8860477959 Low Rate Escorts Service In 24...Call Girls In Sahibabad Ghaziabad ❤️8860477959 Low Rate Escorts Service In 24...
Call Girls In Sahibabad Ghaziabad ❤️8860477959 Low Rate Escorts Service In 24...lizamodels9
 
Ebullient Investments Limited specializes in Building contractor
Ebullient Investments Limited specializes in Building contractorEbullient Investments Limited specializes in Building contractor
Ebullient Investments Limited specializes in Building contractorEbullient Investments Limited
 
Prestige Sector 94 at Noida E Brochure.pdf
Prestige Sector 94 at Noida E Brochure.pdfPrestige Sector 94 at Noida E Brochure.pdf
Prestige Sector 94 at Noida E Brochure.pdfsarak0han45400
 
Kumar Fireworks Hadapsar Link Road Pune Brochure.pdf
Kumar Fireworks Hadapsar Link Road Pune Brochure.pdfKumar Fireworks Hadapsar Link Road Pune Brochure.pdf
Kumar Fireworks Hadapsar Link Road Pune Brochure.pdfBabyrudram
 
Shapoorji Pallonji Vanaha GolfLand 2 | A Space For You To Find Your Space
Shapoorji Pallonji Vanaha GolfLand 2 | A Space For You To Find Your SpaceShapoorji Pallonji Vanaha GolfLand 2 | A Space For You To Find Your Space
Shapoorji Pallonji Vanaha GolfLand 2 | A Space For You To Find Your Spaceaidasheikh47
 
Anandtara Iris Residences Mundhwa Pune Brochure.pdf
Anandtara Iris Residences Mundhwa Pune Brochure.pdfAnandtara Iris Residences Mundhwa Pune Brochure.pdf
Anandtara Iris Residences Mundhwa Pune Brochure.pdfabbu831446
 
Brigade Neopolis Kokapet, Hyderabad E- Brochure
Brigade Neopolis Kokapet, Hyderabad E- BrochureBrigade Neopolis Kokapet, Hyderabad E- Brochure
Brigade Neopolis Kokapet, Hyderabad E- Brochurefaheemali990101
 
Dynamic Netsoft A leader In Property management Software
Dynamic Netsoft A leader In Property management SoftwareDynamic Netsoft A leader In Property management Software
Dynamic Netsoft A leader In Property management SoftwareDynamic Netsoft
 
A Brief History of Intangibles in Ad Valorem Taxation.pdf
A Brief History of Intangibles in Ad Valorem Taxation.pdfA Brief History of Intangibles in Ad Valorem Taxation.pdf
A Brief History of Intangibles in Ad Valorem Taxation.pdfTim Wilmath
 
Rustomjee The Panorama At Pali Hill, Bandra West, Mumbai - Brochure.pdf
Rustomjee The Panorama At Pali Hill, Bandra West, Mumbai - Brochure.pdfRustomjee The Panorama At Pali Hill, Bandra West, Mumbai - Brochure.pdf
Rustomjee The Panorama At Pali Hill, Bandra West, Mumbai - Brochure.pdfmonikasharma630
 
What Is Biophilic Design .pdf
What Is Biophilic Design            .pdfWhat Is Biophilic Design            .pdf
What Is Biophilic Design .pdfyamunaNMH
 
Provident Solitaire Park Square Kanakapura Road, Bangalore E- Brochure.pdf
Provident Solitaire Park Square Kanakapura Road, Bangalore E- Brochure.pdfProvident Solitaire Park Square Kanakapura Road, Bangalore E- Brochure.pdf
Provident Solitaire Park Square Kanakapura Road, Bangalore E- Brochure.pdffaheemali990101
 
How to Navigate the Eviction Process in Pennsylvania: A Landlord's Guide
How to Navigate the Eviction Process in Pennsylvania: A Landlord's GuideHow to Navigate the Eviction Process in Pennsylvania: A Landlord's Guide
How to Navigate the Eviction Process in Pennsylvania: A Landlord's GuideezLandlordForms
 
Experion Elements Sector 45 Noida_Brochure.pdf.pdf
Experion Elements Sector 45 Noida_Brochure.pdf.pdfExperion Elements Sector 45 Noida_Brochure.pdf.pdf
Experion Elements Sector 45 Noida_Brochure.pdf.pdfkratirudram
 
8 Key Elements for Comfortable Farmland Living
8 Key Elements for Comfortable Farmland Living 8 Key Elements for Comfortable Farmland Living
8 Key Elements for Comfortable Farmland Living Farmland Bazaar
 
Pride Wonderland Dhanori Pune Brochure.pdf
Pride Wonderland Dhanori Pune Brochure.pdfPride Wonderland Dhanori Pune Brochure.pdf
Pride Wonderland Dhanori Pune Brochure.pdfabbu831446
 
Radiance Majestic Valasaravakkam Chennai.pdf
Radiance Majestic Valasaravakkam Chennai.pdfRadiance Majestic Valasaravakkam Chennai.pdf
Radiance Majestic Valasaravakkam Chennai.pdfashiyadav24
 
Shapoorji Spectra Sensorium Hinjewadi Pune | E-Brochure
Shapoorji Spectra Sensorium Hinjewadi Pune | E-BrochureShapoorji Spectra Sensorium Hinjewadi Pune | E-Brochure
Shapoorji Spectra Sensorium Hinjewadi Pune | E-BrochureOmanaConsulting
 
SVN Live 4.22.24 Weekly Property Broadcast
SVN Live 4.22.24 Weekly Property BroadcastSVN Live 4.22.24 Weekly Property Broadcast
SVN Live 4.22.24 Weekly Property BroadcastSVN International Corp.
 

Kürzlich hochgeladen (20)

Ryan Mahoney - How Property Technology Is Altering the Real Estate Market
Ryan Mahoney - How Property Technology Is Altering the Real Estate MarketRyan Mahoney - How Property Technology Is Altering the Real Estate Market
Ryan Mahoney - How Property Technology Is Altering the Real Estate Market
 
Call Girls In Sahibabad Ghaziabad ❤️8860477959 Low Rate Escorts Service In 24...
Call Girls In Sahibabad Ghaziabad ❤️8860477959 Low Rate Escorts Service In 24...Call Girls In Sahibabad Ghaziabad ❤️8860477959 Low Rate Escorts Service In 24...
Call Girls In Sahibabad Ghaziabad ❤️8860477959 Low Rate Escorts Service In 24...
 
Ebullient Investments Limited specializes in Building contractor
Ebullient Investments Limited specializes in Building contractorEbullient Investments Limited specializes in Building contractor
Ebullient Investments Limited specializes in Building contractor
 
Prestige Sector 94 at Noida E Brochure.pdf
Prestige Sector 94 at Noida E Brochure.pdfPrestige Sector 94 at Noida E Brochure.pdf
Prestige Sector 94 at Noida E Brochure.pdf
 
Kumar Fireworks Hadapsar Link Road Pune Brochure.pdf
Kumar Fireworks Hadapsar Link Road Pune Brochure.pdfKumar Fireworks Hadapsar Link Road Pune Brochure.pdf
Kumar Fireworks Hadapsar Link Road Pune Brochure.pdf
 
Shapoorji Pallonji Vanaha GolfLand 2 | A Space For You To Find Your Space
Shapoorji Pallonji Vanaha GolfLand 2 | A Space For You To Find Your SpaceShapoorji Pallonji Vanaha GolfLand 2 | A Space For You To Find Your Space
Shapoorji Pallonji Vanaha GolfLand 2 | A Space For You To Find Your Space
 
Anandtara Iris Residences Mundhwa Pune Brochure.pdf
Anandtara Iris Residences Mundhwa Pune Brochure.pdfAnandtara Iris Residences Mundhwa Pune Brochure.pdf
Anandtara Iris Residences Mundhwa Pune Brochure.pdf
 
Brigade Neopolis Kokapet, Hyderabad E- Brochure
Brigade Neopolis Kokapet, Hyderabad E- BrochureBrigade Neopolis Kokapet, Hyderabad E- Brochure
Brigade Neopolis Kokapet, Hyderabad E- Brochure
 
Dynamic Netsoft A leader In Property management Software
Dynamic Netsoft A leader In Property management SoftwareDynamic Netsoft A leader In Property management Software
Dynamic Netsoft A leader In Property management Software
 
A Brief History of Intangibles in Ad Valorem Taxation.pdf
A Brief History of Intangibles in Ad Valorem Taxation.pdfA Brief History of Intangibles in Ad Valorem Taxation.pdf
A Brief History of Intangibles in Ad Valorem Taxation.pdf
 
Rustomjee The Panorama At Pali Hill, Bandra West, Mumbai - Brochure.pdf
Rustomjee The Panorama At Pali Hill, Bandra West, Mumbai - Brochure.pdfRustomjee The Panorama At Pali Hill, Bandra West, Mumbai - Brochure.pdf
Rustomjee The Panorama At Pali Hill, Bandra West, Mumbai - Brochure.pdf
 
What Is Biophilic Design .pdf
What Is Biophilic Design            .pdfWhat Is Biophilic Design            .pdf
What Is Biophilic Design .pdf
 
Provident Solitaire Park Square Kanakapura Road, Bangalore E- Brochure.pdf
Provident Solitaire Park Square Kanakapura Road, Bangalore E- Brochure.pdfProvident Solitaire Park Square Kanakapura Road, Bangalore E- Brochure.pdf
Provident Solitaire Park Square Kanakapura Road, Bangalore E- Brochure.pdf
 
How to Navigate the Eviction Process in Pennsylvania: A Landlord's Guide
How to Navigate the Eviction Process in Pennsylvania: A Landlord's GuideHow to Navigate the Eviction Process in Pennsylvania: A Landlord's Guide
How to Navigate the Eviction Process in Pennsylvania: A Landlord's Guide
 
Experion Elements Sector 45 Noida_Brochure.pdf.pdf
Experion Elements Sector 45 Noida_Brochure.pdf.pdfExperion Elements Sector 45 Noida_Brochure.pdf.pdf
Experion Elements Sector 45 Noida_Brochure.pdf.pdf
 
8 Key Elements for Comfortable Farmland Living
8 Key Elements for Comfortable Farmland Living 8 Key Elements for Comfortable Farmland Living
8 Key Elements for Comfortable Farmland Living
 
Pride Wonderland Dhanori Pune Brochure.pdf
Pride Wonderland Dhanori Pune Brochure.pdfPride Wonderland Dhanori Pune Brochure.pdf
Pride Wonderland Dhanori Pune Brochure.pdf
 
Radiance Majestic Valasaravakkam Chennai.pdf
Radiance Majestic Valasaravakkam Chennai.pdfRadiance Majestic Valasaravakkam Chennai.pdf
Radiance Majestic Valasaravakkam Chennai.pdf
 
Shapoorji Spectra Sensorium Hinjewadi Pune | E-Brochure
Shapoorji Spectra Sensorium Hinjewadi Pune | E-BrochureShapoorji Spectra Sensorium Hinjewadi Pune | E-Brochure
Shapoorji Spectra Sensorium Hinjewadi Pune | E-Brochure
 
SVN Live 4.22.24 Weekly Property Broadcast
SVN Live 4.22.24 Weekly Property BroadcastSVN Live 4.22.24 Weekly Property Broadcast
SVN Live 4.22.24 Weekly Property Broadcast
 

JLL Cincinnati Office Insight & Statistics - Q3 2016

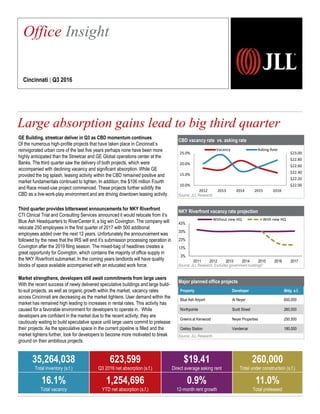
  • 1. CBD vacancy rate vs. asking rate Source: JLL Research NKY Riverfront vacancy rate projection Source: JLL Research, Excludes government buildings* Major planned office projects Source: JLL Research Property Developer Bldg s.f. Blue Ash Airport Al Neyer 600,000 Northpointe Scott Street 260,000 Greens at Kenwood Neyer Properties 250,500 Oakley Station Vandercar 180,000 3% 13% 23% 33% 43% 2011 2012 2013 2014 2015 2016 2017 Without new HQ With new HQ $22.00 $22.20 $22.40 $22.60 $22.80 $23.00 2012 2013 2014 2015 2016 10.0% 15.0% 20.0% 25.0% Vacancy Asking Rate GE Building, streetcar deliver in Q3 as CBD momentum continues Of the numerous high-profile projects that have taken place in Cincinnati’s reinvigorated urban core of the last five years perhaps none have been more highly anticipated than the Streetcar and GE Global operations center at the Banks. The third quarter saw the delivery of both projects, which were accompanied with declining vacancy and significant absorption. While GE provided the big splash, leasing activity within the CBD remained positive and market fundamentals continued to tighten. In addition, the $106 million Fourth and Race mixed-use project commenced. These projects further solidify the CBD as a live-work-play environment and are driving downtown leasing activity. Third quarter provides bittersweet announcements for NKY Riverfront CTI Clinical Trial and Consulting Services announced it would relocate from it’s Blue Ash Headquarters to RiverCenter II, a big win Covington. The company will relocate 250 employees in the first quarter of 2017 with 500 additional employees added over the next 12 years. Unfortunately the announcement was followed by the news that the IRS will end it’s submission processing operation in Covington after the 2019 filing season. The mixed-bag of headlines creates a great opportunity for Covington, which contains the majority of office supply in the NKY Riverfront submarket. In the coming years landlords will have quality blocks of space available accompanied with an educated work force. Market strengthens, developers still await commitments from large users With the recent success of newly delivered speculative buildings and large build- to-suit projects, as well as organic growth within the market, vacancy rates across Cincinnati are decreasing as the market tightens. User demand within the market has remained high leading to increases in rental rates. This activity has caused for a favorable environment for developers to operate in. While developers are confident in the market due to the recent activity, they are cautiously waiting to build speculative space until large users commit to prelease their projects. As the speculative space in the current pipeline is filled and the market tightens further, look for developers to become more motivated to break ground on their ambitious projects. Large absorption gains lead to big third quarter 2,257 Office Insight Cincinnati | Q3 2016 35,264,038 Total inventory (s.f.) 623,599 Q3 2016 net absorption (s.f.) $19.41 Direct average asking rent 260,000 Total under construction (s.f.) 16.1% Total vacancy 1,254,696 YTD net absorption (s.f.) 0.9% 12-month rent growth 11.0% Total preleased
  • 2. Current conditions – submarket Historical leasing activity (s.f.) Source: JLL Research Source: JLL Research Total net absorption (s.f.) Source: JLL Research Total vacancy rate (%) Source: JLL Research Direct average asking rent ($ p.s.f.) Source: JLL Research 953,267 815,426 -123,487 -38,624 79,469 143,641 290,120 562,970 763,222 1,254,696 -500,000 0 500,000 1,000,000 1,500,000 2007 2008 2009 2010 2011 2012 2013 2014 2015 YTD 2016 $19.16 $19.25 $18.45 $17.39 $17.94 $18.41 $19.68 $19.15 $19.24 $19.41 $16.00 $17.00 $18.00 $19.00 $20.00 2007 2008 2009 2010 2011 2012 2013 2014 2015 YTD 2016 17.3% 18.1% 19.4% 22.7% 22.6% 22.5% 21.3% 19.8% 18.1% 16.1% 5.0% 10.0% 15.0% 20.0% 25.0% 2007 2008 2009 2010 2011 2012 2013 2014 2015 YTD 2016 1,700,000 1,800,000 2,200,000 1,891,000 1,794,000 0 500,000 1,000,000 1,500,000 2,000,000 2,500,000 2012 2013 2014 2015 YTD 2016 ©2016 Jones Lang LaSalle IP, Inc. All rights reserved.For more information, contact: Ross Bratcher | ross.bratcher@am.jll.com Landlordleverage Tenantleverage Peaking market Falling market Rising market Blue Ash / Montgomery, Midtown, Fields Ertel / Mason, West Chester CBD Peripheral, NKY Riverfront East, West Kenwood Bottoming market Northern Kentucky
  • 3. 2,257 Office Statistics Cincinnati | Q3 2016 Class Inventory (s.f.) Total net absorption (s.f.) YTD total net absorption (s.f.) YTD total net absorption (% of stock) Direct vacancy (%) Total vacancy (%) Average direct asking rent ($ p.s.f.) YTD completions (s.f.) Under construction (s.f.) CBD Totals 12,266,866 340,171 443,245 3.6% 15.5% 16.5% $20.27 338,000 0 CBD Peripheral Totals 1,622,161 10,306 -72,364 -4.5% 30.4% 30.4% $18.97 0 0 Midtown Totals 2,376,193 57,477 386,122 16.2% 7.8% 8.5% $21.67 365,000 0 Urban Totals 16,265,220 407,954 757,003 4.7% 15.9% 16.7% $20.12 703,000 0 Blue Ash/Montgomery Totals 4,889,330 26,908 42,358 0.9% 9.7% 9.8% $17.62 0 143,000 East Totals 1,128,534 1,576 13,959 1.2% 9.5% 9.5% $16.60 0 0 Fields Ertel/Mason Totals 2,604,432 89,446 154,408 5.9% 13.2% 13.5% $19.65 83,000 60,000 Kenwood Totals 1,451,516 12,168 101,777 7.0% 8.8% 9.1% $25.46 0 0 Northern Kentucky Totals 2,657,389 69,654 123,281 4.6% 14.1% 14.7% $18.08 0 57,000 Northern Kentucky Riverfront Totals 1,435,604 -1,749 4,102 0.3% 34.1% 34.1% $21.72 0 0 Tri-County Totals 3,133,895 -772 116,479 3.7% 23.3% 24.5% $15.87 0 0 West Totals 156,329 0 9,945 6.4% 14.0% 14.0% $16.93 0 0 West Chester Totals 1,541,789 18,414 -68,616 -4.5% 15.0% 15.0% $21.33 0 0 Suburbs Totals 18,998,818 215,645 497,693 2.6% 15.3% 15.6% $18.77 83,000 260,000 Cincinnati Totals 35,264,038 623,599 1,254,696 3.6% 15.5% 16.1% $19.41 786,000 260,000 CBD A 7,478,198 363,966 451,703 6.0% 14.8% 15.8% $22.78 338,000 0 CBD Peripheral A 789,967 7,135 -86,952 -11.0% 40.1% 40.1% $21.41 0 0 Midtown A 1,723,546 39,786 381,953 22.2% 8.4% 9.0% $22.71 365,000 0 Urban A 9,991,711 410,887 746,704 7.5% 15.7% 16.5% $22.50 703,000 0 Blue Ash/Montgomery A 2,906,394 7,479 21,827 0.8% 6.1% 6.1% $20.44 0 143,000 East A 741,078 0 11,786 1.6% 2.1% 2.1% $17.93 0 0 Fields Ertel/Mason A 2,063,777 87,181 150,103 7.3% 12.2% 12.4% $21.00 83,000 60,000 Kenwood A 1,031,123 5,381 96,943 9.4% 8.6% 9.1% $27.51 0 0 Northern Kentucky A 1,368,910 16,407 26,044 1.9% 12.7% 13.7% $19.48 0 57,000 Northern Kentucky Riverfront A 1,320,104 -503 3,068 0.2% 35.6% 35.6% $21.91 0 0 Tri-County A 1,141,529 995 13,837 1.2% 11.5% 12.6% $19.89 0 0 West A 22,472 0 5,382 23.9% 28.9% 28.9% $18.95 0 0 West Chester A 1,329,626 13,570 -67,100 -5.0% 14.5% 14.5% $22.20 0 0 Suburbs A 11,925,013 130,510 261,890 2.2% 12.6% 12.9% $21.44 83,000 260,000 Cincinnati A 21,916,724 541,397 1,008,594 4.6% 14.0% 14.6% $21.98 786,000 260,000 CBD B 4,788,668 -23,795 -8,458 -0.2% 16.5% 17.6% $16.76 0 0 CBD Peripheral B 832,194 3,171 14,588 1.8% 21.2% 21.2% $14.59 0 0 Midtown B 652,647 17,691 4,169 0.6% 6.2% 7.0% $17.96 0 0 Urban B 6,273,509 -2,933 10,299 0.2% 16.1% 17.0% $16.43 0 0 Blue Ash/Montgomery B 1,982,936 19,429 20,531 1.0% 15.1% 15.1% $15.96 0 0 East B 387,456 1,576 2,173 0.6% 23.8% 23.8% $16.38 0 0 Fields Ertel/Mason B 540,655 2,265 4,305 0.8% 17.2% 17.6% $15.98 0 0 Kenwood B 420,393 6,787 4,834 1.1% 9.1% 9.1% $20.71 0 0 Northern Kentucky B 1,288,479 53,247 97,237 7.5% 15.7% 15.7% $16.89 0 0 Northern Kentucky Riverfront B 115,500 -1,246 1,034 0.9% 17.3% 17.3% $17.15 0 0 Tri-County B 1,992,366 -1,767 102,642 5.2% 30.1% 31.4% $14.99 0 0 West B 133,857 0 4,563 3.4% 11.5% 11.5% $16.08 0 0 West Chester B 212,163 4,844 -1,516 -0.7% 18.2% 18.2% $17.03 0 0 Suburbs B 7,073,805 85,135 235,803 3.3% 19.8% 20.2% $15.89 0 0 Cincinnati B 13,347,314 82,202 246,102 1.8% 18.0% 18.6% $16.11 0 0 ©2016 Jones Lang LaSalle IP, Inc. All rights reserved.For more information, contact: Ross Bratcher | ross.bratcher@am.jll.com