Presentation on financial statement analysis of food industries, Bangladesh
Q12016
1. FIMG Traditional Portfolio
Dane Hudson
Bobby Gorney
Damon Smith
Natalie Clark
Credit Quality
CYTD AAA
Performance (%) 1mo 3mo 6mo 9mo 1yr 3yr 5yr 10yr AA
2.43 2.87 4.03 3.70 1.93 -0.08 2.20 A
0.99 3.12 2.53 3.79 2.05 2.53 3.80 BBB
iShares Core U.S. Credit Bond ETF 2.53 3.82 3.31 4.03 0.39 2.64 4.69 Sum
Excess Over Barclays US Aggregate Bond Index 1.44 -0.25 1.50 -0.09 -0.12 -2.61 -1.60
Excess Over iShares Core U.S. Credit Bond ETF -0.10 -0.95 0.72 -0.33 1.54 -2.72 -2.50
Holding CUSIP MTY RTG CPN YTM OAD OAS Weight MV
ANHEUSER-BUSCH 035242AM8 2036 A- 4.70% 3.96 13.23 171.36 7.41% 111,222.11
AT&T INC 00206RDH2 2042 BBB+ 5.15% 4.81 14.74 240.10 7.03% 105,573.22
BERKSHIRE HATHWY 084670BK3 2043 AA 4.50% 3.90 16.37 141.25 7.39% 110,868.00
DELPHI CORP 247126AH8 2023 BBB 5.00% 3.96 3.47 135.80 7.14% 107,133.22
FN 932839 31412RLU9 2025 AAA 3.50% 1.51 1.90 -8.00 1.59% 23,804.97
GILEAD SCIENCES 375558AW3 2024 A 3.70% 2.60 6.89 83.38 7.20% 108,057.67
JPMORGAN CHASE 46625HJY7 2024 BBB+ 3.88% 3.47 7.18 171.00 6.89% 103,386.38
MERRILL LYNCH 59022CAA1 2026 BBB 1.39% 3.22 -0.88 272.76 5.59% 83,925.74
ORACLE CORP 68389XBC8 2025 AA- 2.95% 2.66 7.88 81.81 6.90% 103,618.11
SCHWAB CHARLES 808513AE5 2022 BBB 7.00% 5.09 4.98 287.55 7.70% 115,508.33 Contact Information
STANLEY BLACK 854502AF8 2053 BBB+ 5.75% 4.80 2.43 278.71 7.12% 106,826.39 Ohio University Student Fixed Income Management Group
US TREASURY N/B 912828G46 2016 AAA 0.50% 0.46 0.59 4.35 6.68% 100,224.26 Ohio University College of Business
VERIZON COMM INC 92343VBR4 2023 BBB+ 5.15% 2.97 6.27 128.97 7.66% 114,957.22 Copeland Hall, Suite 603
WAL-MART STORES 931142DP5 2024 AA 3.30% 2.27 7.06 48.88 7.17% 107,536.50 Athens, OH 45701
Cash 6.54% 98,089.25
FIMG TRADITIONAL PORTFOLIO A 3.88% 3.17 6.57 143.92 100.00% 1,500,731.38$ Applied Investment Management Program
BARCLAYS US AGGREGATE BOND INDEX AA 3.28% 2.11 5.86 59.73 Ohio University College of Business
DIFFERENCE 0.61% 1.06 0.71 84.19 Division of Finance and Adminsitration
100.00% 100.0%
22.96% 4.40%
FIMG Traditional 15.63% 11.40%
Barclays US Aggregate Bond Index 52.57% 12.70%
FIMG Traditional AGG
FYTD Annualized 8.84% 71.50%
Current Executive Board Members
The FIMG is an OU College of Business student organization that manages a portion of the Ohio University long term working capital pool. We operate
under the supervision of the College of Business and the OU Division of Finance and Administration. The FIMG Traditional Fixed Income Portfolio operates
with the objective of long-term capital appreciation and a mandate to provide exposure to the broad US Fixed Income market. We achieve this objective
by investing in a diversified portfolio composed primarily of US corporate fixed income securities.
President
VP of Portfolio Management
VP of Investments
VP of Operations
First-Quarter End Report
As of March 31, 2016
0%
10%
20%
30%
40%
50%
60%
70%
80%
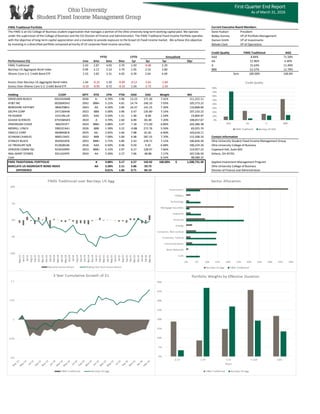
AAA AA A BBB
Credit Quality
FIMG Traditional Barclays US AGG
2. FIMG Sustainable Portfolio
Dane Hudson
Bobby Gorney
Damon Smith
Natalie Clark
Credit Quality
CYTD AAA
Performance (%) 1mo 3mo 6mo 9mo 1yr 3yr 5yr 10yr AA
2.35 2.92 3.90 3.18 1.87 A
0.99 3.12 2.53 3.79 2.05 2.53 3.80 BBB
iShares Core U.S. Credit Bond ETF 2.53 3.82 3.31 4.03 0.39 2.64 4.69 Sum
Excess Over Barclays US Aggregate Bond Index 1.36 -0.20 1.37 -0.62 -0.17
Excess Over iShares Core U.S. Credit Bond ETF -0.18 -0.90 0.60 -0.86 1.49
Holding CUSIP MTY RTG CPN YTM OAD OAS Weight MV
APPLE INC 037833AQ3 2019 AA+ 2.10% 1.2851 2.90 26.97 8.39% 103,393.83
CARDINAL HEALTH 14149YAZ1 2019 A- 2.40% 1.9383 3.37 82.71 8.33% 102,641.67
EBAY INC 278642AL7 2024 BBB+ 3.45% 3.4317 7.13 165.78 8.19% 100,932.00
EXELON GENERATIO 30161MAH6 2020 BBB 4.00% 2.8511 3.99 153.35 8.52% 105,009.67
FEDEX CORP 31428XBC9 2025 BBB 3.20% 2.8069 7.67 100.49 8.42% 103,777.67
GN 717835 3620A3PU2 2024 AAA 4.00% 1.761 2.48 40.50 1.99% 24,469.42
HASBRO INC 418056AT4 2021 BBB 3.15% 2.8195 4.58 143.03 8.36% 102,944.00
HCP INC 40414LAJ8 2023 BBB+ /*- 4.25% 4.2199 6.32 250.91 8.29% 102,079.89
INTEL CORP 458140AK6 2041 A+ 4.80% 3.9695 15.65 154.28 9.22% 113,538.00 Contact Information
MERRILL LYNCH 59022CAA1 2026 BBB 1.39% 3.2212 -0.88 272.76 6.81% 83,925.74 Ohio University Student Fixed Income Management Group
SHELL INTL FIN 822582BM3 2018 A+ /*- 1.63% 1.4337 2.46 49.46 8.22% 101,218.79 Ohio University College of Business
SHERWIN-WILLIAMS 824348AP1 2017 A /*- 1.35% 1.2894 1.60 55.18 4.08% 50,292.25 Copeland Hall, Suite 603
US TREASURY N/B 912828N89 2021 AAA 1.38% 1.3477 4.62 0.97 4.08% 50,223.04 Athens, OH 45701
US TREASURY N/B 912810RP5 2045 AAA 3.00% 2.7066 20.57 1.99 4.35% 53,638.29
CASH 2.76% 34,000.00 Applied Investments Program
FIMG SUSTAINABLE PORTFOLIO A 2.88% 2.58 5.78 117.0503 100.00% 1,232,084.26 Ohio University College of Business
BARCLAYS US AGGREGATE BOND INDEX AA 3.28% 2.11 5.86 59.73 Division of Finance and Adminsitration
DIFFERENCE -0.40% 0.47 -0.08 57.32 Office of Sustainability
100.00% 100.00%
8.63% 4.40%
FIMG Sustainable 30.69% 11.40%
Barclays US Aggregate Bond Index 49.97% 12.70%
FIMG ESG AGG
FYTD Annualized 10.71% 71.50%
Current Executive Board Members
The FIMG is an OU College of Business student organization that manages a portion of the Ohio University long term working capital pool. We operate under the
supervision of the College of Business and the OU Division of Finance and Administration. The FIMG Sustainable Fixed Income Portfolio operates with the objective
of long-term capital appreciation and a mandate to provide exposure to the broad US Fixed Income market. We achieve this objective by investing in a socially-
responsible portfolio composed primarily of US corporate fixed income securities with a mandated weighted average MSCI score of at least 4.
President
VP of Portfolio Management
VP of Investments
VP of Operations
First-Quarter End Report
As of March 31, 2016
0%
10%
20%
30%
40%
50%
60%
70%
80%
AAA AA A BBB
Credit Quality
FIMG Sustainable Barclays US Agg