Building Wealth Basics
•Als PPT, PDF herunterladen•
0 gefällt mir•226 views

Interactive wealth creation slides demonstrating the power of time, rates of return and the effects of inflation.

Empfohlen
Empfohlen
Weitere ähnliche Inhalte
Kürzlich hochgeladen
Kürzlich hochgeladen (20)
Empfohlen
Empfohlen (20)
Building Wealth Basics
- 2. Effect of Inflation on Income
- 3. Importance of Higher Returns
- 4. Real Rate of Return
- 5. Rule of 72 Years to Double Your Money
- 6. Rule of 72 Years to Double Your Money
Hinweis der Redaktion
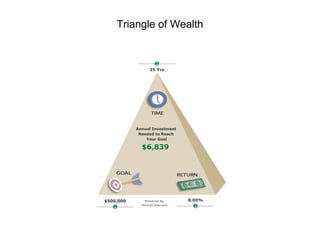
- About This Slide This interactive slide illustrates the trade-offs involved in reaching financial goals. The tradeoffs are made between the amount of your goal, the time you have to reach the goal and rate of return on your investments. As these three variables change, the Annual Investment Amount Needed to Reach Your Goal will change on-screen. It is assumed that annual investments are made at the end of the year. Changing Numbers on the Slide To change numbers on the slide, move the sliders for TIME, GOAL and RETURN and the Annual Investment Needed to Reach Your Goal figure will change. How to Copy the Slide to Another Presentation To move this slide to another presentation, click on the above chart, select Copy from the Edit menu, open the other presentation and Paste into the slide you select. Navigating During a Presentation Using keyboard shortcuts to move between slides will only work if no changes are made to the slide. If you change a value or slider on a slide during a presentation, you must use the mouse to navigate to the next or previous slide. Right-click anywhere on the outer edges of the slide, and on the shortcut menu, click Next or Previous. Do not right click directly on the chart since the shortcut menu will not be available if you do. Slide created by www.AdvisorTek.com.
- About This Slide This interactive slide illustrates the effect of inflation on future income needs. The first bar in the above chart shows the current income, the second bar shows the inflation adjusted income using one inflation rate and the third bar shows the inflation adjusted income using a second inflation rate. You can show the effects of inflation in two ways: (1) by inflating future income needs to show what income is needed to maintain today’s purchasing power or (2) by deflating future income needs, to show the loss in purchasing power. Changing Numbers on the Slide To change numbers on the slide, double-click on a cell, type in a number and then press Enter or Tab. Pressing Enter or Tab will not take you to the next cell. You need to double-click on each cell individually to change numbers. How to Copy the Slide to Another Presentation To move this slide to another presentation, click on the above chart, select Copy from the Edit menu, open the other presentation and Paste into the slide you select. Navigating During a Presentation Using keyboard shortcuts to move between slides will not work if changes are made to the interactive slide. If you change a value or slider on a slide during a presentation, you must use the mouse to navigate to the next or previous slide. Right-click anywhere on the outer edges of the slide and then click Next or Previous. Do not right click directly on the chart since the shortcut menu will not be available if you do. Slide created by www.AdvisorTek.com.
- About This Slide This interactive slide illustrates the importance of earning a higher rate of return on your investments. The first bar in the above chart shows future value of the investment using the first rate of return, the second bar shows the future value using the second rate of return and the third bar shows the difference between the two. It is assumed that the annual investments are made at the end of the year. Changing Numbers on the Slide To change numbers on the slide, double-click on a cell, type in a number and then press Enter or Tab. Pressing Enter or Tab will not take you to the next cell. You need to double-click on each cell individually to change numbers. How to Copy the Slide to Another Presentation To move this slide to another presentation, click on the above chart, select Copy from the Edit menu, open the other presentation and Paste into the slide you select. Navigating During a Presentation Using keyboard shortcuts to move between slides will only work if no changes are made to the slide. If you change a value or slider on a slide during a presentation, you must use the mouse to navigate to the next or previous slide. Right-click anywhere on the outer edges of the slide, and on the shortcut menu, click Next or Previous. Do not right click directly on the chart since the shortcut menu will not be available if you do. Slide created by www.AdvisorTek.com.
- About This Slide This interactive slide shows the effect of taxes and inflation on an investment’s rate of return. The first bar in the above chart shows the nominal or stated rate of return, the second bar shows the after-tax rate of return and the third bar shows the real rate of return, after taxes and inflation. Changing Numbers on the Slide To change numbers on the slide, double-click on a cell, type in a number and then press Enter or Tab. Pressing Enter or Tab will not take you to the next cell. You need to double-click on each cell individually to change numbers. How to Copy the Slide to Another Presentation To move this slide to another presentation, click on the graph, select Copy from the Edit menu, open the other presentation and Paste into the slide you select. Navigating During a Presentation Using keyboard shortcuts to move between slides will only work if no changes are made to the slide. If you change a value or slider on a slide during a presentation, you must use the mouse to navigate to the next or previous slide. Right-click anywhere on the outer edges of the slide, and on the shortcut menu, click Next or Previous. Do not right click directly on the chart since the shortcut menu will not be available if you do. Slide created by www.AdvisorTek.com.
- About This Slide This interactive slide illustrates the Rule of 72 investing principle. Divide the rate of return into 72 to see how many years it will take to double your money. Changing Numbers on the Slide To change the rate of return number on the slide, move the slider and the Years variable will change. How to Copy the Slide to Another Presentation To move this slide to another presentation, click on the above chart, select Copy from the Edit menu, open the other presentation and Paste into the slide you select. Navigating During a Presentation Using keyboard shortcuts to move between slides will only work if no changes are made to the slide. If you change a value or slider on a slide during a presentation, you must use the mouse to navigate to the next or previous slide. Right-click anywhere on the outer edges of the slide, and on the shortcut menu, click Next or Previous. Do not right click directly on the chart since the shortcut menu will not be available if you do. Slide created by www.AdvisorTek.com.