
Recommended
More Related Content
What's hot
What's hot (20)
Similar to Catastrophic floods and flow declines in the Upper Colorado basin, Texas
Similar to Catastrophic floods and flow declines in the Upper Colorado basin, Texas (20)
Recently uploaded
Recently uploaded (20)
Catastrophic floods and flow declines in the Upper Colorado basin, Texas
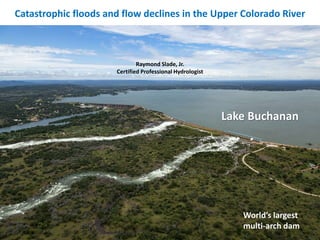
- 1. Catastrophic floods and flow declines in the Upper Colorado River Lake Travis near Austin World’s largest multi-arch dam Lake Buchanan Raymond Slade, Jr. Certified Professional Hydrologist
- 2. The Oasis on Lake Travis diving?
- 3. Colorado R. basin Austin 42,000 sq. mi. drainage 5th largest in Texas but larger than 15 states serves 36 million people The Colorado River basin
- 4. Colorado basin Austin Lower Colorado basin excluded Lake Buchanan Lake Travis Lake Buchanan 64% of basin
- 5. Contents Floods Extremes Trends Most of the data and informaiton herein are from Slade, R.M., Jr., 2020, Runoff Inflow Volumes to the Highland Lakes in Central Texas: Temporal Trends in Volumes and Relations between Volumes and Selected Climatic Indices: Texas Water Journal, vol. 11 No. 1 https://twj-ojs-tdl.tdl.org/twj/index.php/twj/article/view/7025
- 6. Arrows indicate passage of time Flood planning Floods flood panic concern awareness apathy People often have extended panic
- 7. Colorado River at Austin, 1935 “Floods are merely a hazard… mankind is the disaster” Gilbert White
- 8. Remnants of 1935 flood Iron Works BBQ restaurant Downtown Austin
- 9. Colorado River at Austin, 1936 A 1938 peak also inundated the Congress Avenue bridge Buchanan Dam was built after the 1938 flood—Congress Ave. hasn’t flooded since
- 10. Typical storms in the Colorado basin • During a storm its location, size, intensity, direction and speed can quickly change. • Storms often retain their character but tend to move east following many Texas streams.
- 11. Causes for large floods • The Colorado has a large watershed but individual storms never cover the entire basin. • Storms in the Southwest can be intense but are limited to a few counties at most. • Many of the storms travel in a similar direction as the river, at speeds of about 15 to 20 miles per hour. • This speed coincides with the approximate flood-wave velocity of the river. • Such storms often cause local tributaries to peak at the same time as the river, thus causing an increase in the main-channel crest.
- 12. Storms moving down a basin often cause local tributaries to peak at the same time as the river, thus causing an increase in the main-channel crest. Basin boundary Affect of moving storms on peaks The video shows the leading and trailing edges of runoff. Dispersion of runoff is not shown.
- 13. Extreme wet: Colorado River At Wharton, 1935 Extremes
- 14. Extreme dry Inflow to Buchanan has been no flow on 43 days
- 15. Range in inflow to Lake Buchanan 1957 2011 1957 2011 Avg Year Annual flow (ft3/s) % of mean 2011 69 7% 1957 4340 450%
- 16. 1 big peak in 31 years Extremes in flood peaks 5 big peaks in 6 years 98% decrease The gage is near Lake Buchanan 3
- 17. Variation and decline in Lake Buchanan inflow 59% reduction Spence Reservoir Ivie Reservoir From Slade, 2020, TWJ report inflow Basin regulation Extremes and trends
- 18. Lake Buchanan North 88% 82% 39% Reservoirs impacting Lake Buchanan inflow Impoundment dates 1963 1934 1991 Limited data Reduction in flow due to reservoirs Major releases from these reservoirs 3-5% of time Basin boundaries 69% of basin regulated by 3 reservoirs However, most of the reduction is due to ponds in the reservoir basins
- 19. Pond density By 2013, the area exceeded 165,000 acres 1 In 1940, ponds in the basin had a combined surface area of less than 40,000 acres
- 20. Water budget major components Inflow rainfall Outflow runoff evapotranspiration and seepage to groundwater (ET) overland flow stream channels impoundments withdrawals
- 21. Water-budget analysis rainfall Year Much of the increased evapotranspiration would have otherwise been lost downstream as ET in the channel before reaching Lake Buchanan. runoff represents about 2% of rainfall Inflow Outflow 12%
- 22. Affect of ponds on Buchanan inflow • Basin rainfall increased 12% • Lake Buchanan inflow reduced 59% • 19 reservoirs and 70,000 ponds in basin • > 81 percent of ET from ponds • Ponds exceeding 200 acre foot permitted: creation subject to contested public hearings • Most ponds have less than permitted volume--built without scrutiny, permitting, or regulation • 17,000 to 70,000 ponds from 1940 to 2013 • Pond ET exceeds inflow by 215% • Basin area extensively developing--ponds will increase • Buchanan inflow continue to decline