The article focuses on the Return on Equity (ROE)as the benchmark .docx
EY 3rd Remuneration Governance Survey
1. 1
EY’s third Remuneration
Governance Survey
Clear trends emerge
When EY’s first Remuneration Governance Survey took
place in 2012, remuneration was becoming a hot topic,
sparked by the financial crisis of 2008. The Companies
Act of 2008 and the King Report on Governance for
South Africa in 2009 had also opened the doors for
shareholders and the media to access remuneration
information freely.
This third survey shows that in response to shareholder
interest, remuneration committees are starting to come
to grips with their roles. Five clear trends are emerging
that are consistent across the three years, and look set
to dominate the remuneration agenda, at least over the
foreseeable future:
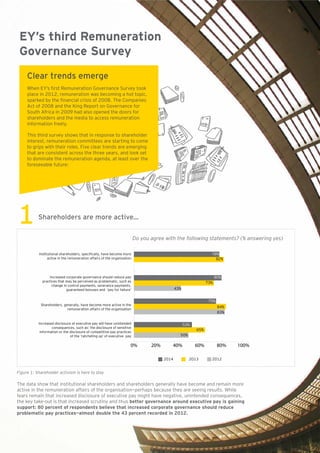
The data show that institutional shareholders and shareholders generally have become and remain more
active in the remuneration affairs of the organisation—perhaps because they are seeing results. While
fears remain that increased disclosure of executive pay might have negative, unintended consequences,
the key take-out is that increased scrutiny and thus better governance around executive pay is gaining
support: 80 percent of respondents believe that increased corporate governance should reduce
problematic pay practices—almost double the 43 percent recorded in 2012.
Shareholders are more active…
Figure 1: Shareholder activism is here to stay
Do you agree with the following statements? (% answering yes)
0% 20% 40% 60% 80% 100%
78%
82%
80%
73%
75%
84%
83%
50%
65%
53%
43%
2014 2013 2012
Institutional shareholders, specifically, have become more
active in the remuneration affairs of the organisation
Increased corporate governance should reduce pay
practices that may be perceived as problematic, such as
change in control payments, severance payments,
guaranteed bonuses and ‘pay for failure’
Shareholders, generally, have become more active in the
remuneration affairs of the organisation
Increased disclosure of executive pay will have unintended
consequences, such as: the disclosure of sensitive
information or the disclosure of competitive pay practices
of the ‘ratcheting up’ of executive pay
2. 2
3
…perhaps because
they are seeing
results. Shareholder
engagement is
influencing pay
practices
That sustained shareholder
interest in executive
remuneration could be linked
to results is suggested by
Figure 2, which shows that
remuneration committees
are proactively engaging with
shareholders before annual
general meetings. Critically,
they are making changes to
pay programmes as a result of
this engagement–43 percent
said they had made changes,
as compared with 29 percent
in 2012.
The top focus area
for remuneration
committees is linking
pay to performance…
The data clearly shows that
remuneration committees
continue to focus on ways
to link executive pay to
performance (Figure 3),
and that some performance
measures are beginning to
dominate (Figure 4 and 5).
When it comes to short-term
incentive schemes, profitability
measures are the most
popular measure used (71
percent), closely followed by
individual targets (57 percent)
and earnings per share (43
percent).
By contrast, long-term
incentive schemes tend to
favour earnings per share (57
percent), return on capital
employed (51 percent) and
total shareholder return (47
percent).
Figure 3: Focus areas for remuneration committees
Figure 2: Shareholder engagement is influencing remuneration practices
% who answered “yes”
Areas of “More” focus in the next 12 months
2014 2013 2012
0% 10% 20% 30% 40% 50% 60% 70%
‘Claw back’ provisions
The Remco Charter (terms of reference)
Pure retention schemes (i.e. with no performance element)
The independence of remuneration consultants
Review of proxy voting guidelines of institutional investor
Bonus deferral provisions
Co-operation with other board sub-committees, such as the Risk
Peer group identification for remuneration benchmarking
Capabilities of Remco members
Links with enterprise risk management
Remuneration benchmarking methodology
Reward strategy changes
Quality of information (breadth and depth)
in the annual remuneration
The ‘wage gap’
Shareholder dialogue / engagement
Short term incentive scheme design changes
Share based incentive scheme design changes
Long term cash incentive scheme design changes
Performance conditions for incentive schemes
Links between pay and corporate performance 65%
50%
54%
53%
52%
40%
40%
40%
30%
31%
29%
26%
26%
25%
23%
17%
17%
19%
13%
13%
9%
7%
0%
37%
12%
0%
0%
27%
33%
38%
14%
32%
35%
32%
34%
29%
43%
39%
38%
52%
52%
44%
44%
36%
36%
42%
42%
0%
29%
46%
21%
62%
49%
46%
55%
2014 2013 2012
20% 40% 60% 80%
51%
48%
19%
29%
54%
29%
15%
22%
Did your Remco make changes to your
pay programmes as a consequence of
engagement with shareholders?
Did your Remco take steps to proactively
engage indirectly with all shareholders
before your most recent AGM ?
43%
Did your Remco take steps to proactively
engage directly with your larger investors
before your most recent AGM ?
0%
3. Figure 4: Metrics used for linking Short Term Incentives to performance (multiple answers allowed)
4 …but non-financial metrics are still not prevalent
Figure 4 and 5 highlight that financial performance measures are favoured to a great extent—only 29 percent of
remuneration committees take non-financial measures into account for long-term incentive schemes. The figure is 43
percent for short-term schemes.
This trend implies that South African corporates have not yet fully embraced the broader understanding of corporate
governance, which seeks to secure the company’s long-term sustainability by understanding and mitigating all the
risks that threaten it—many of them non-financial. Similarly, the company’s executives should be incentivised in terms
of this broader spectrum of risks.
Figure 5: Metrics used for linking Long Term Incentives to performance (multiple answers allowed)
2014 2013 2012
0%
10%
20%
30%
40%
50%
60%
70%
80%
90%
100%
Earnings
pershare
Return
on
CapitalEm
ployed
Totalshareholderreturn
(TSR)
Profitability
m
easures
(e.g.EBIT,EBITDA)
Personal(Individual)targets
Othernon-financialm
easures
Econom
ic
value
added
(EVA)
Otherfinancialm
easures,e.g.units
produced
Health
and
Safety
m
easures
Cash
flow
Sales
/Revenue
/Turnover
Environm
entalm
easures
None
57%
51%
47%
45%
31%
29%
27% 27%
18%
16% 16%
12%
4%
16%
24% 24%
51%
25%
14%
10%
6% 6%
10%
20%
8%
4%
17%
24%
37% 35%
29%
24%
20% 21%
12%
21%
12% 12%
2014 2013 2012
Profitability
m
easures
(e.g.EBIT,EBITDA)
Personal(Individual)targets
Earnings
pershare
Othernon-financialm
easures
Otherfinancialm
easures,e.g.units
produced
Sales
/Revenue
/Turnover
Cash
flow
Return
on
CapitalEm
ployed
Health
and
Safety
m
easures
Totalshareholderreturn
(TSR)
Econom
ic
value
added
(EVA)
Environm
entalm
easures
None
0%
10%
20%
30%
40%
50%
60%
70%
80%
90%
100%
71%
62%
57%
69%
61%
73%
43%
18%
26%
43%
35%
47%
41%
16%
29%
31% 32%
41%
27% 27%
24%
18%
16%
20%
26%
2%
0%
10%
15%
12%
17%
29%
33% 33% 33%31% 31%
38%
Short term incentive schemes
Long term incentive schemes
4. 5Remuneration committees
are looking for 70% support of
their remuneration policy
As the survey has shown, shareholder
activism is more entrenched, perhaps
because it is yielding results, especially as
remuneration committees are proactively
engaging with shareholders ahead of annual
general meetings.
The flipside of these trends is that
remuneration committees seem to be setting
the bar for endorsement of their policies
fairly high, with a simple majority seen as
inadequate. Broad consensus seems to be
emerging that a “no” vote of more than
30% would constitute a rejection of the
remuneration policy.
Conclusion
In conclusion, the five trends emerging from
this year’s EY Remuneration Governance
Survey show that remuneration committees
are starting to get on top of the issues, and
that clear trends are starting to develop. It
is to be hoped that this will continue, and
that executive pay can, in time, cease to
become such a divisive issue as the link
between remuneration and overall corporate
performance becomes tighter.
Remuneration committee agendas will remain
full over the next year, according to the survey
results (Figure 5). Of particular note is the
focus on two areas that speak to the ongoing
controversy over executive pay levels: the link
between pay and corporate performance, and
the “wage gap”.
It’s also heartening to note that committees
will be placing much more focus on ensuring
that their members have the right skills and
capabilities.
Contact
For more information, contact Ray Harraway,
leader of the Performance and Reward
Competency for EY Africa
ray.harraway@za.ey.com
+27(0)117725466
In your view, what level of votes at the AGM against the remuneration
policy would you consider to be a ‘failed vote’?
2014 2013
More than 50% 20% 29%
More than 40% 14% 13%
More than 30% 39% 33%
More than 20% 18% 20%
More than 10% 4% 2%
Unsure 6% 2%
2012 2013 2014
Industrials 20% 27% 23%
Financials 27% 18% 25%
Basic Materials 23% 16% 12%
Consumer goods 7% 22% 17%
AltX 10% 8% 8%
Consumer Services 10% 6% 8%
Healthcare 3% 4% 8%
Total responses received 30 51 53
About the research
Members of remuneration committees from companies listed on
the Johannesburg Stock Exchange were asked to fill out an online
questionnaire. The sector breakdown is shown in the table below.
This report is intended to provide an overview of key trends
in and commentary on the key regulatory, governance and
stakeholder issues affecting remuneration of JSE companies.
It is not intended to be used as a benchmarking tool.
Survey participants by sector