From Luxury Escort Service Kamathipura : 9352852248 Make on-demand Arrangemen...
Weekly market report
1. Market Review and Outlook
QE Index and Volume
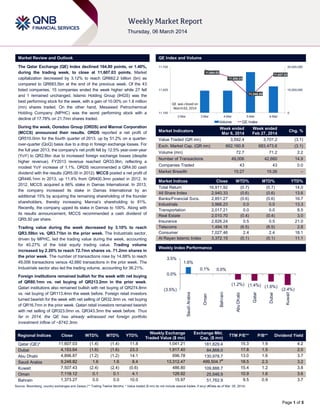
The Qatar Exchange (QE) Index declined 164.80 points, or 1.40%,
during the trading week, to close at 11,607.03 points. Market
capitalization decreased by 3.12% to reach QR662.2 billion (bn) as
compared to QR683.5bn at the end of the previous week. Of the 43
listed companies, 15 companies ended the week higher while 27 fell
and 1 remained unchanged. Islamic Holding Group (IHGS) was the
best performing stock for the week, with a gain of 10.00% on 1.8 million
(mn) shares traded. On the other hand, Mesaieed Petrochemical
Holding Company (MPHC) was the worst performing stock with a
decline of 17.78% on 21.7mn shares traded.
11,700
Regional Indices
Qatar (QE)*
Dubai
Abu Dhabi
Saudi Arabia
Kuwait
Oman
Bahrain
Close
11,607.03
4,153.64
4,896.87
9,248.82
7,507.43
7,118.12
1,373.27
WTD%
MTD%
YTD%
(1.4)
(1.6)
(1.2)
1.6
(2.4)
0.1
0.0
(1.4)
(1.6)
(1.2)
1.6
(2.4)
0.1
0.0
11.8
23.3
14.1
8.4
(0.6)
4.1
10.0
15,000,000
11,346.58
QE was closed on
March 02, 2014
11,150
0
2-Mar
3-Mar
4-Mar
5-Mar
Volume
QE Index
Week ended
Feb 27, 2014
3,707.2
662,160.8
683,473.6
72.7
71.2
2.2
49,006
42,660
14.9
43
43
0.0
15:27
Value Traded (QR mn)
15:26
–
Exch. Market Cap. (QR mn)
Volume (mn)
Number of Transactions
Companies Traded
Market Breadth
Market Indices
Close
Total Return
16,911.92
All Share Index
2,940.33
Banks/Financial Svcs.
2,851.27
Industrials
3,966.23
Transportation
2,017.21
Real Estate
2,010.70
Insurance
2,826.24
Telecoms
1,494.18
Consumer
7,027.46
Al Rayan Islamic Index
3,372.15
Market Indices
Weekly Index Performance
3.5%
6-Mar
Week ended
Mar 6, 2014
3,592.4
Market Indicators
WTD%
(0.7)
(0.6)
(0.6)
0.0
0.0
(0.4)
0.5
(6.5)
2.4
(0.1)
Chg. %
(3.1)
(3.1)
MTD%
(0.7)
(0.6)
(0.6)
0.0
0.0
(0.4)
0.5
(6.5)
2.4
(0.1)
YTD%
14.0
13.6
16.7
13.3
8.5
3.0
21.0
2.8
18.1
11.1
1.6%
0.1%
0.0%
0.0%
Weekly Exchange
Traded Value ($ mn)
1,041.21
1,917.40
696.78
13,312.47
486.80
126.92
15.97
Exchange Mkt.
Cap. ($ mn)
181,829.4
84,868.0
130,978.7
499,504.7#
109,888.7
25,546.9
51,762.9
(2.4%)
Kuwait
Dubai
Qatar
(1.2%) (1.4%)
(1.6%)
Abu Dhabi
(3.5%)
Bahrain
Foreign institutions remained bullish for the week with net buying
of QR80.1mn vs. net buying of QR213.2mn in the prior week.
Qatari institutions also remained bullish with net buying of QR274.8mn
vs. net buying of QR113.4mn the week before. Foreign retail investors
turned bearish for the week with net selling of QR32.3mn vs. net buying
of QR16.7mn in the prior week. Qatari retail investors remained bearish
with net selling of QR323.0mn vs. QR343.3mn the week before. Thus
far in 2014, the QE has already witnessed net foreign portfolio
investment inflow of ~$742.3mn.
11,425
Oman
Trading value during the week decreased by 3.10% to reach
QR3.59bn vs. QR3.71bn in the prior week. The Industrials sector,
driven by MPHC, led the trading value during the week, accounting
for 40.27% of the total equity trading value. Trading volume
increased by 2.20% to reach 72.7mn shares vs. 71.2mn shares in
the prior week. The number of transactions rose by 14.88% to reach
49,006 transactions versus 42,660 transactions in the prior week. The
Industrials sector also led the trading volume, accounting for 36.21%.
11,607.03
11,588.24
Saudi Arabia
During the week, Ooredoo Group (ORDS) and Mannai Corporation
(MCCS) announced their results. ORDS reported a net profit of
QR510.0mn for the fourth quarter of 2013, up by 51.2% on a quarterover-quarter (QoQ) basis due to a drop in foreign exchange losses. For
the full year 2013, the company's net profit fell by 12.5% year-over-year
(YoY) to QR2.6bn due to increased foreign exchange losses (despite
higher revenue). FY2013 revenue reached QR33.9bn, reflecting a
modest YoY increase of 1.1%. ORDS recommended a QR4.00 cash
dividend with the results (QR5.00 in 2012). MCCS posted a net profit of
QR446.1mn in 2013, up 11.4% from QR400.3mn posted in 2012. In
2012, MCCS acquired a 66% stake in Damas International. In 2013,
the company increased its stake in Damas International by an
additional 15% by acquiring the remaining shareholding of the founder
shareholders, thereby increasing Mannai‟s shareholding to 81%.
Recently, the company upped its stake in Damas to 100%. Along with
its results announcement, MCCS recommended a cash dividend of
QR5.50 per share.
30,000,000
11,664.02
TTM P/E**
P/B**
Dividend Yield
15.3
17.8
13.0
18.5
15.4
10.9
9.5
1.9
1.5
1.6
2.3
1.2
1.6
0.9
4.2
2.0
3.7
3.2
3.8
3.6
3.7
Source: Bloomberg, country exchanges and Zawya (** Trailing Twelve Months; * Value traded ($ mn) do not include special trades, if any) (#Data as of Mar. 05, 2014)
Page 1 of 5
2. News
Economic News
QNB Group: Qatar international reserves touch $41.9bn in
January – A new study has shown that Qatar‟s international
reserves surged by 22.2% YoY to reach a total of $41.9bn in
January 2014, reflecting the country‟s strong current account
surplus and lower capital outflows. According to QNB Group,
the country‟s international reserves had stood at $34.3bn in
January 2013. While the balance of payments data for 2013 are
yet to be released, the country‟s current account is expected to
have registered a strong surplus due to the large hydrocarbon
exports offsetting growing imports. Qatar‟s foreign reserves
have been rising steadily over the years due to large current
account surpluses. Going forward, QNB Group expects Qatar‟s
reserves to continue rising in 2014. (Gulf-Times.com)
QNB Group: Qatar’s population growth to be one of
world’s highest – According to a report by QNB Group,
Qatar‟s forecasted average population growth of 10.5% for
2014 will be one of the world‟s highest rates. Qatar‟s population
grew by 10.4% YoY in February to reach 2.12mn. Population
growth in recent months has been driven by the large ramp up
in infrastructure spending in preparation for the 2022 FIFA
World Cup. QNB Group said that the larger population will
enable higher economic growth by boosting aggregate demand
and investment in housing and services. Planned heavy
investments in major projects in 2014 are likely to accelerate
economic growth, which could lead to certain supply
bottlenecks, pushing up prices somewhat. (Gulf-Times.com)
QCB caps bonuses for bank board members – The Qatar
Central Bank (QCB) is capping bonuses for board members of
commercial banks in the country. This is a part of the Emir's
objective to undertake a number of steps to spread the
country's wealth more widely among all Qataris. The maximum
annual bonus for a bank chairman in Qatar has been set at
QR2mn ($550,000), while the cap for a board member is
QR1.5mn. Bonuses can only be granted if a bank makes a net
profit and 5% of a bank's capital has to be distributed among
investors. No bonuses can be distributed without the QCB's
approval. (Gulf-Times.com)
New Port Project set for early completion – According to a
top official, quick progress is being made in the construction of
the New Port Project (NPP) and more than 35% of the work has
been completed as of now. The project consists of the new
port, a naval base for the Emiri Naval Force and Qatar
Economic Zone 3. Situated 24 kilometers south of Doha, the
entire cost for the project is estimated at QR27bn. With an area
of 26.5 square kilometer, a major part of the project is
reclaimed land. (Gulf-Times.com)
S&P: Qatar may not issue long-term debt in 2014 –
Standard & Poor‟s (S&P) said that Qatar is not expected to
issue any long-term debt in 2014 even as the Middle East &
North Africa (MENA) region is slated to witness borrowings of
around $56bn. In general, sovereign debt capital markets are
relatively underdeveloped in the GCC and S&P said it does not
expect Abu Dhabi, Kuwait, Qatar, or Saudi Arabia to issue longterm debt in 2014. S&P viewed that financing these states‟
large investment programs could result in weaker government
balances, but as long as oil prices remain high, it expects them
to continue to post fiscal surpluses. However, S&P expects that
smaller GCC countries such as Oman and Bahrain to issue
commercial debt in the market. (Gulf-Times.com)
Market & Corporate News
ORDS reports QR510mn net profit in 4Q2013 - Ooredoo
Group (ORDS) reported a net profit of QR510.0mn for 4Q2013,
up by 51.2% on a QoQ basis due to a drop in FX Losses. The
company's 4Q2013 revenue declined by 3.6% QoQ to reach
QR8,199.8mn. For FY2013, the company's net profit fell by
12.5% YoY to QR2.6bn, despite higher revenue, due to
increased FX losses, SG&A expenses, operating expenses and
net finance costs. FY2013 revenue reached QR33.9bn,
reflecting a modest YoY increase of 1.1%. In line with the
decline in net profit, EPS decreased to QR8.05 in FY2013
compared to QR9.89 in FY2012. Meanwhile, ORDS' BoD
recommended a 40% cash dividend which is to be approved
during the shareholders meeting scheduled to be convened
later. (QE)
MCCS net profit rises by 11.4% to QR446.1mn in 2013 –
Mannai Corporation (MCCS) earned a net profit of QR446.1mn
in 2013, up 11.4% from QR400.3mn posted in 2012. Moreover
the company‟s revenue surged by 17.5% to reach QR5.6bn vs.
QR4.8bn in 2012. Mannai said its acquisition in 2012 of a 66%
stake in Damas was a defining moment in the company‟s
history. The company increased its stake in Damas
International by an additional 15% by acquiring the remaining
shareholding of the founder shareholders, thereby increasing
Mannai‟s shareholding to 81%. Recently, the company upped
its stake in Damas to 100%. MCCS‟s board of directors has
recommended a 55% cash dividend to its shareholders, which
work out to QR5.50 a share. MCCS‟ AGM will be held on March
23, 2014 at the Grand Hyatt Hotel Doha, where the
recommendation will be submitted for approval. (QE, GulfTimes.com)
Al Khaliji to finance QR117mn greenfield recycling project
in Qatar – Al Khalij Commercial Bank (Al Khaliji) is financing
one of the largest greenfield projects for recycling materials in
Qatar, estimated to cost QR117mn. The 20,000-square meter
modern recycling plant located in Mesaieed Industrial City is
focused on recycling used tires and rubber materials in line with
government‟s efforts to make recycling a standard practice that
promotes environmental sustainability, as well as creating
economic opportunities that contribute to diversifying state
revenues. The funding initiative comes as part of the
Generation Green Program at Al Khaliji, which is the first
incentive-driven loan initiative for green projects by a bank in
Qatar. (Gulf-Times.com)
Doha Bank to acquire bank branches in India – Doha Bank‟s
(DHBK) Group CEO R. Seetharaman said that the bank is
exploring opportunities to buy branches of foreign and Indian
banks operating in India. Shareholders of Doha Bank
authorized its board of directors to acquire branches of foreign
and Indian banks in India at the bank's ordinary general
meeting. Seetharaman said instead of taking the organic route,
the bank is planning to take the investment route to grow its
operations in India. In the first phase of DHBK‟s expansion in
India, the bank will aim at acquiring the branches of only foreign
banks operating in India. In the second-phase, the bank will
look at acquiring the branches of Indian banks. (Qatar Tribune)
Alijarah to add 200 vehicles to Mowasalat fleet – Alijarah
Holding (NLCS) has signed an agreement with Mowasalat
Company to add 200 new vehicles to its existing taxi fleet in
order to take it to 1,000 vehicles. (QE)
Page 2 of 5
3. Qatar Exchange
Top 5 Gainers
Top 5 Decliners
0.0%
12.0%
10.0%
-4.2%
-7.0%
8.0%
6.9%
-8.2%
-7.3%
-6.9%
Ooredoo
Salam
International
Investment
5.5%
-14.0%
4.0%
3.0%
2.1%
-17.8%
0.0%
-21.0%
Islamic
Gulf
Qatar Cinema Qatar Islamic
Holding Group International
& Film
Insurance
Services
Distribution
Al Meera
Consumer
Goods
Source: Qatar Exchange (QE)
Mesaieed
Petrochemical
Holding
Company
Doha Bank
Mannai Corp.
Source: Qatar Exchange (QE)
Most Active Shares by Value (QR Million)
Most Active Shares by Volume (Million)
1,200.0
24.0
21.7
904.0
800.0
16.0
400.0
307.5
303.7
8.0
204.0
5.6
180.6
5.4
4.9
3.8
0.0
Mesaieed
Petrochemical
Holding
Company
QNB Group
Industries
Qatar
Masraf Al
Rayan
Source: Qatar Exchange (QE)
Doha Bank
0.0
Mesaieed
Petrochemical
Holding
Company
Barwa Real
Estate
Masraf Al
Rayan
Vodafone
Qatar
Qatar Gas
Transport
(Nakilat)
Source: Qatar Exchange (QE)
Investor Trading Percentage to Total Value Traded
Net Traded Value by Nationality (QR Million)
48
100%
25.72%
23.49%
12.07%
12.97%
Non-Qatari
80%
60%
19.45%
1,358
11.80%
40%
42.76%
1,310
(48)
51.75%
20%
Qatari
2,283
2,235
0%
Buy
Sell
Qatari Individuals
Qatari Institutions
Non-Qatari Individuals
Non-Qatari Institutions
Source: Qatar Exchange (QE)
(500)
Net Investment
500
1,000
Total Sold
1,500
2,000
2,500
Total Bought
Source: Qatar Exchange (QE)
Page 3 of 5
4. TECHNICAL ANALYSIS OF THE QE INDEX
Source: Bloomberg
The QE Index continued its slide for the second consecutive week losing around 165 points. The index started the curtailed week on a bearish note and
caved under heavy selling pressure on Wednesday; it breached the important supports of the 21-day moving average and the 11,400.0 psychological level
suffering its largest single day loss in the past six months. However, Thursday was a different day as the index witnessed a gap-up opening and erased all
its Wednesday‟s losses, reclaiming the 11,400.0, the 21-day moving average and 11,600.0 levels within one trading session as bulls were back in action.
Technically, the index has strong support near 11,520.0. The medium-term trend is up and intact until it holds onto the support of the 11,520.0 level. A
continued push toward 11,660.0 is possible considering the current higher push. Moreover, a rise above this level may indicate that the correction is over
and further confirms the bullish move toward the 11,750.0-11,800.0 levels. On the flip side a drop below the 21-day moving average as well as the 11,520.0
levels will get traders thinking that the index may continue its downmove signaling a bearish sign. Meanwhile, both indicators are providing mixed signals
suggesting the likely continuation of volatility.
DEFINITIONS OF KEY TERMS USED IN TECHNICAL ANALYSIS
RSI (Relative Strength Index) indicator – RSI is a momentum oscillator that measures the speed and change of price movements. The RSI oscillates
between 0 to 100. The index is deemed to be overbought once the RSI approaches the 70 level, indicating that a correction is likely. On the other hand, if
the RSI approaches 30, it is an indication that the index may be getting oversold and therefore likely to bounce back.
MACD (Moving Average Convergence Divergence) indicator – The indicator consists of the MACD line and a signal line. The divergence or the
convergence of the MACD line with the signal line indicates the strength in the momentum during the uptrend or downtrend, as the case may be. When the
MACD crosses the signal line from below and trades above it, it gives a positive indication. The reverse is the situation for a bearish trend.
Candlestick chart – A candlestick chart is a price chart that displays the high, low, open, and close for a security. The „body‟ of the chart is portion between
the open and close price, while the high and low intraday movements form the „shadow‟. The candlestick may represent any time frame. We use a one-day
candlestick chart (every candlestick represents one trading day) in our analysis.
Doji candlestick pattern – A Doji candlestick is formed when a security's open and close are practically equal. The pattern indicates indecisiveness, and
based on preceding price actions and future confirmation, may indicate a bullish or bearish trend reversal.
Shooting Star/Inverted Hammer candlestick patterns – These candlestick patterns have a small real body (open price and close price are near to each
other), and a long upper shadow (large intraday movement on the upside). The Shooting Star is a bearish reversal pattern that forms after a rally. The
Inverted Hammer looks exactly like a Shooting Star, but forms after a downtrend. Inverted Hammers represent a potential bullish trend reversal.
Page 4 of 5
5. Price % Change 5(Mar 06)
Day
% Change
YTD
Market Cap.
QR Million
TTM P/E
P/B
Div. Yield
191.00
(2.05)
11.05
133,648
14.1
2.5
3.7
Qatar Islamic Bank
75.00
(0.92)
8.70
17,722
13.3
1.5
5.3
Commercial Bank of Qatar
77.20
(0.90)
9.04
19,103
11.9
1.2
7.8
Doha Bank
61.50
(8.21)
5.67
15,890
10.7
1.4
7.3
Al Ahli Bank
50.80
(0.20)
20.07
8,392
16.0
2.4
N/A
Qatar International Islamic Bank
76.50
1.59
23.99
11,580
15.4
2.2
4.6
Masraf Al Rayan
38.60
(0.90)
23.32
28,950
17.0
2.8
3.9
Al Khaliji Bank
21.05
(0.71)
5.30
7,578
13.8
1.3
4.8
National Leasing
28.45
(3.07)
(5.64)
1,408
16.1
1.1
5.3
Dlala Holding
20.55
(1.49)
(7.01)
456
N/M
2.0
N/A
Qatar & Oman Investment
12.59
1.53
0.56
397
20.0
1.2
4.0
Islamic Holding Group
48.40
10.00
5.22
194
21.4
3.3
3.5
Company Name
Qatar National Bank
245,317
Banking and Financial Services
Zad Holding
70.80
1.14
1.87
926
9.4
0.7
5.7
Qatar German Co. for Medical Devices
13.97
0.58
0.87
161
N/M
0.9
N/A
Salam International Investment
12.05
(6.88)
(7.38)
1,377
12.1
0.8
8.3
Medicare Group
66.00
0.30
25.71
1,858
30.2
2.4
2.7
Qatar Cinema & Film Distribution
43.25
5.49
7.86
247
33.0
1.8
4.6
21,833
18.0
3.4
3.0
732
13.3
2.9
9.8
3,084
15.0
2.3
5.2
258.50
Qatar Meat and Livestock
(0.28)
18.29
40.65
Qatar Fuel
(3.44)
(21.37)
2.12
15.68
154.20
Al Meera Consumer Goods
30,218
Consumer Goods and Services
44.40
0.53
5.30
2,110
10.4
1.5
5.6
Qatar National Cement
120.00
0.76
0.84
5,892
13.5
2.4
5.0
Industries Qatar
194.90
(0.56)
15.39
117,915
14.7
3.5
4.0
40.80
(1.69)
(6.64)
5,073
23.0
2.4
1.8
Qatar Electricity and Water
170.00
(2.30)
2.80
18,700
13.5
3.1
4.0
Mannai Corp.
101.90
(4.23)
13.35
4,649
10.4
2.0
4.7
Aamal
13.95
(1.06)
(7.00)
8,370
16.6
1.2
N/A
Gulf International Services
91.60
13,618
20.1
4.4
1.6
Mesaieed Petrochem. Holding Co.
40.70
51,132
N/A
N/A
N/A
Qatar Industrial Manufacturing
Qatari Investors Group
6.88
(17.78)
50.16
N/A
227,458
Industrials
Qatar Insurance
65.40
0.46
22.93
10,499
12.9
2.0
3.1
Doha Insurance
24.50
(0.81)
(2.00)
631
9.4
1.1
8.2
Qatar General Insurance & Reinsurance
47.00
0.00
(1.88)
2,709
1.3
0.6
1.9
Al Khaleej Takaful Insurance
41.50
1.34
13.70
709
10.8
1.2
2.0
Qatar Islamic Insurance
69.20
2.98
19.52
1,038
16.3
3.8
5.1
15,586
Insurance
United Development
21.48
0.37
(5.00)
7,244
22.4
0.7
4.7
Barwa Real Estate
32.05
(0.77)
7.55
12,471
18.3
1.0
4.7
Ezdan Real Estate
16.33
(2.68)
(3.94)
43,315
N/M
1.6
0.8
Mazaya Qatar Real Estate Development
12.23
(1.37)
9.39
1,223
18.5
1.1
4.9
64,253
Real Estate
139.00
(7.33)
1.31
44,524
17.3
1.8
3.6
11.93
(1.57)
11.39
10,086
N/M
1.7
N/A
Qatar Navigation (Milaha)
92.50
1.09
11.45
10,594
11.1
0.8
4.1
Gulf Warehousing
41.60
(3.26)
0.24
1,979
19.5
2.5
3.6
Qatar Gas Transport (Nakilat)
Transportation
21.69
(0.28)
7.11
12,146
16.4
2.8
4.6
Qatar Telecom
Vodafone Qatar
54,610
Telecoms
24,719
Qatar Exchange
662,161
Source: Bloomberg
Contacts
Saugata Sarkar
Ahmed M. Shehada
Keith Whitney
Sahbi Kasraoui
Head of Research
Head of Trading
Head of Sales
Manager - HNWI
Tel: (+974) 4476 6534
Tel: (+974) 4476 6535
Tel: (+974) 4476 6533
Tel: (+974) 4476 6544
saugata.sarkar@qnbfs.com.qa
ahmed.shehada@qnbfs.com.qa
keith.whitney@qnbfs.com.qa
sahbi.alkasraoui@qnbfs.com.qa
QNB Financial Services SPC
Contact Center: (+974) 4476 6666
PO Box 24025, Doha, Qatar
DISCLAIMER: This publication has been prepared by QNB Financial Services SPC (“QNBFS”) a wholly-owned subsidiary of Qatar National Bank (“QNB”). QNBFS is regulated by the Qatar
Financial Markets Authority and the Qatar Exchange; QNB is regulated by the Qatar Central Bank. This publication expresses the views and opinions of QNBFS at a given time only. It is not an
offer, promotion or recommendation to buy or sell securities or other investments, nor is it intended to constitute legal, tax, accounting, or financial advice. We therefore strongly advise potential
investors to seek independent professional advice before making any investment decision. Although the information in this report has been obtained from sources that QNBFS believes to be
reliable, we have not independently verified such information and it may not be accurate or complete. While this publication has been prepared with the utmost degree of care by our analysts,
QNBFS does not make any representations warranties as to the accuracy and completeness of the information it may contain, and declines any liability in that respect. QNBFS reserves the right
to amend the views and opinions expressed in this publication at any time. It may also express viewpoints or make investment decisions that differ significantly from, or even contradict, the views
and opinions included in this report.
COPYRIGHT: No part of this document may be reproduced without the explicit written permission of QNBFS.
Page 5 of 5