1. Page 1 of 5
Market Review and Outlook QE Index and Volume
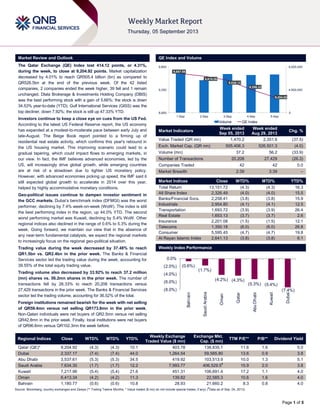
The Qatar Exchange (QE) Index lost 414.12 points, or 4.31%,
during the week, to close at 9,204.92 points. Market capitalization
decreased by 4.01% to reach QR505.4 billion (bn) as compared to
QR526.5bn at the end of the previous week. Of the 42 listed
companies, 2 companies ended the week higher, 39 fell and 1 remain
unchanged. Dlala Brokerage & Investments Holding Company (DBIS)
was the best performing stock with a gain of 5.66%; the stock is down
34.53% year-to-date (YTD). Gulf International Services (GISS) was the
top decliner, down 7.92%; the stock is still up 47.33% YTD.
Investors continue to keep a close eye on cues from the US Fed.
According to the latest US Federal Reserve report, the US economy
has expanded at a modest-to-moderate pace between early July and
late-August. The Beige Book report pointed to a firming up of
residential real estate activity, which confirms this year's rebound in
the US housing market. This improving scenario could lead to a
gradual tapering, which could impact flows to emerging markets, in
our view. In fact, the IMF believes advanced economies, led by the
US, will increasingly drive global growth, while emerging countries
are at risk of a slowdown due to tighter US monetary policy.
However, with advanced economies picking up speed, the IMF said it
still expected global growth to accelerate in 2014 over this year,
helped by highly accommodative monetary conditions.
Geo-political issues continue to dampen investor sentiment in
the GCC markets. Dubai‟s benchmark index (DFMGI) was the worst
performer, declining by 7.4% week-on-week (WoW). The index is still
the best performing index in the region, up 44.0% YTD. The second
worst performing market was Kuwait, declining by 5.4% WoW. Other
regional indices also declined in the range of 0.6% to 5.3% during the
week. Going forward, we maintain our view that in the absence of
any near-term fundamental catalysts, we expect the regional markets
to increasingly focus on the regional geo-political situation.
Trading value during the week decreased by 37.48% to reach
QR1.5bn vs. QR2.4bn in the prior week. The Banks & Financial
Services sector led the trading value during the week, accounting for
39.55% of the total equity trading value.
Trading volume also decreased by 33.92% to reach 37.2 million
(mn) shares vs. 56.2mn shares in the prior week. The number of
transactions fell by 26.33% to reach 20,208 transactions versus
27,429 transactions in the prior week. The Banks & Financial Services
sector led the trading volume, accounting for 36.52% of the total.
Foreign institutions remained bearish for the week with net selling
of QR59.4mn versus net selling QR173.8mn in the prior week.
Non-Qatari individuals were net buyers of QR2.5mn versus net selling
QR42.8mn in the prior week. Finally, local institutions were net buyers
of QR96.6mn versus QR102.3mn the week before.
Market Indicators
Week ended
Sep 05, 2013
Week ended
Aug 29, 2013
Chg. %
Value Traded (QR mn) 1,470.2 2,351.6 (37.5)
Exch. Market Cap. (QR mn) 505,406.3 526,501.3 (4.0)
Volume (mn) 37.2 56.2 (33.9)
Number of Transactions 20,208 27,429 (26.3)
Companies Traded 42 42 0.0
Market Breadth 2:39 3:39 –
Market Indices Close WTD% MTD% YTD%
Total Return 13,151.72 (4.3) (4.3) 16.3
All Share Index 2,326.49 (4.0) (4.0) 15.5
Banks/Financial Svcs. 2,258.41 (3.8) (3.8) 15.9
Industrials 2,954.80 (4.1) (4.1) 12.5
Transportation 1,693.72 (3.9) (3.9) 26.4
Real Estate 1,653.13 (3.7) (3.7) 2.6
Insurance 2,201.08 (1.5) (1.5) 12.1
Telecoms 1,350.18 (6.0) (6.0) 26.8
Consumer 5,595.45 (4.7) (4.7) 19.8
Al Rayan Islamic Index 2,641.13 (3.8) (3.8) 6.1
Market Indices
Weekly Index Performance
Regional Indices Close WTD% MTD% YTD%
Weekly Exchange
Traded Value ($ mn)
Exchange Mkt.
Cap. ($ mn)
TTM P/E** P/B** Dividend Yield
Qatar (QE)* 9,204.92 (4.3) (4.3) 10.1 403.78 138,835.1 11.6 1.6 5.0
Dubai 2,337.17 (7.4) (7.4) 44.0 1,264.54 59,585.80 13.6 0.9 3.8
Abu Dhabi 3,537.61 (5.3) (5.3) 34.5 419.92 103,513.9 10.0 1.3 5.1
Saudi Arabia 7,634.30 (1.7) (1.7) 12.2 7,993.77 406,529.5#
15.9 2.0 3.8
Kuwait 7,217.96 (5.4) (5.4) 21.6 451.31 106,691.4 17.2 1.1 4.0
Oman 6,413.34 (4.2) (4.2) 11.3 139.82 22,585.3 10.6 1.6 4.0
Bahrain 1,180.77 (0.6) (0.6) 10.8 28.93 21,660.2 8.3 0.8 4.0
Source: Bloomberg, country exchanges and Zawya (** Trailing Twelve Months; * Value traded ($ mn) do not include special trades, if any) (
#
Data as of Sep. 04, 2013)
9,667.58
9,618.26
9,536.12
9,356.32
9,204.92
0
4,500,000
9,000,000
8,900
9,350
9,800
1-Sep 2-Sep 3-Sep 4-Sep 5-Sep
Volume QE Index
(0.6%)
(1.7%)
(4.2%) (4.3%)
(5.3%) (5.4%)
(7.4%)(8.0%)
(6.0%)
(4.0%)
(2.0%)
0.0%
Bahrain
SaudiArabia
Oman
Qatar
AbuDhabi
Kuwait
Dubai
2. Page 2 of 5
News
Economic News
Qatar leads growth in Gulf projects with 1.3% value gain –
According to a report released by MEED, Qatar has led Gulf
Projects‟ Index growth with the value of schemes planned or
underway climbing 1.3% in the week up to August 27, 2013.
The report added that Qatar‟s performance was supported by
the launch of five new projects worth $600mn and revision of a
construction project worth $2.4bn. The Gulf Projects‟ Index
recorded a growth of 0.1% (to $3.1tn) in the period under
review, following a rise in four of the six GCC region projects
markets. (Gulf-Times.com)
EC Harris: Qatar has 4th
highest asset wealth per head –
According to the Global Built Asset Wealth Index published by
EC Harris, Qatar has the fourth highest built asset wealth per
person in the world with an estimated per capita wealth of
$143,000. During 2011-2012, the rate of growth in built asset
wealth per capita stood at 8.4%, which is the highest growth in
the world. The index illustrates how Qatar compares with 30
other countries that collectively represent 82% of the global
GDP. The Index also revealed the total built asset wealth
among these countries stood at $193tn - equivalent to almost
three times the GDP of these countries ($68tn). (Peninsula
Qatar)
Market & Corporate News
Qatar banking sector can meet $100bn projects boom –
According to a report by MEED, Qatar's banking sector, the
fastest growing in the world in the past decade, is ready to rise
to the challenge of financing a $100bn boom in the country‟s
projects industry until 2022. (Qatar Tribune)
QNB Group grabs top spot among GCC's 10 fastest
growing global banks – According to a report released by the
QNB Group, the group leads the top 10 GCC banks that are
among the fastest growing across the globe. QNB Group's
assets totaled $118bn in June 2013, up 30% over June 2012.
QNB Group is the only Qatari bank in the list of top 10 GCC
banks. QNB Group‟s asset growth was driven by the strategic
acquisition of NSGB in Egypt and higher international stakes. At
the end of 2012, 79% of QNB Group‟s assets were in Qatar.
The report said the top ten GCC banks are likely to remain well
insulated from the current turmoil in emerging markets as their
growth is underpinned by strong economic fundamentals in the
region. (Gulf-Times.com)
Barwa Bank management team update – Barwa Bank has
announced a series of changes to its leadership team. The
changes include the promotion of Khalid Al Ahbabi as the
General Manager, Wholesale & Business Banking and Hussain
Al Abdulla as the General Manager, Personal Banking &
Wealth Management; a new role for Keith Bradley as Group
Chief Operating Officer & General Manager International; as
well as the appointment of Nasser Mohamad Al Hajiri as Chief
Administrative Officer. (Peninsula Qatar)
QP to develop Mesaieed infrastructure – Qatar Petroleum
(QP) is working on the development of Mesaieed Industrial City
through a comprehensive plan over a 25-year period. The
project includes a number of road works and expansion of
residential areas. The development plan covers the renovation
of the Al-Ajfa heritage village and setting up a sports club,
besides two civil defense stations and a public service complex.
Further, bridges will be built to protect oil & gas pipelines
passing under the road. Recently, 40 kilometers of streets in
the residential area were overhauled at a cost of QR800mn.
(Gulf-Times.com)
GWCS sign agreement with QAFAC for chemical
warehousing and record management services – Gulf
Warehousing Company (GWCS) has signed an agreement with
Qatar Fuel Additives Company (QAFAC), whereby GWCS is
contracted to handle QAFAC's offsite storage of chemicals and
general cargo. The agreement also includes scope for
document storage and records management services. The term
of the agreement is three years and type of agreement is a call-
off agreement. The estimated value of the agreement is
QR6mn during the full three-year period. (QE)
VFQS adds three more countries to Passport Service –
Vodafone Qatar (VFQS) has added three new countries -
France, the US and Switzerland to its Vodafone Passport
Service, a roaming plan that can be added for free to the
company‟s existing Postpaid Gold Plan. From now, VFQS
postpaid customers can enjoy a standard roaming rate of
QR0.75 per minute/SMS/MB while roaming in these countries.
This is a massive reduction to the regular rates that a customer
would pay while roaming. (Bloomberg)
ORDS to become global leader in fiber services – Ooredoo
(ORDS) is positioning itself as the leader in providing fiber
services in the developing world as the company sees new
opportunities in emerging markets. ORDS said it is pursuing a
first-mover advantage in countries that are seeking the
economic benefits delivered by improved broadband
infrastructure, which include job creation, increased household
income and permanent increases in GDP. (Gulf-Times.com)
Expansion of Al Ruwais port to be completed by end-2013
– The expansion and development works of the QR1bn Al
Ruwais Port project is set to be completed by the end-2013.
(Peninsula Qatar)
Kahramaa park to open in mid-2014 – Qatar General
Electricity & Water Corporation‟s (Kahramaa) Awareness Park
is set to open in mid-2014. The park in Al Thumama was
announced as part of a national campaign for rationalization of
water and electricity consumption. It will feature a number of
facilities, including an auditorium where documentary films on
energy rationalization will be screened. (Gulf-Times.com)
Muntajat to lead its global marketing from Hague office –
Qatar Chemical & Petrochemical Marketing and Distribution
Company (Muntajat) has chosen The Hague in the Netherlands
as the location for Muntajat Besloten Vennoot (Muntajat BV), its
international marketing company. The Netherlands Foreign
Investment Agency (NFIA) and the West Holland Foreign
Investment Agency (WFIA) advised & assisted Muntajat in its
location decision. Muntajat has the mandate to export Qatar‟s
10mn tons of chemicals and petrochemicals to worldwide
markets. (Gulf-Times.com)
Ezdan’s QR1.5bn Shamal Compound open for home-
seekers – Ezdan Holding Group has launched its “Shamal
Compound” on Al Shamal Road in Doha, which includes a large
number of residential units ranging from villas and apartments
to a four-star hotel. Ezdan Holding Group CEO Ali Mohammed
Al Obaidli said the QR1.5bn Shamal Compound project is
spread over an area of 115,000 square meters, which is now
open for those interested in renting the housing units. The
complex includes 183 luxury villas, 170 apartments and a four-
star hotel with 220 rooms. (Qatar Tribune)
3. Page 3 of 5
Qatar Exchange
Top Gainers Top Decliners
Source: Qatar Exchange (QE) Source: Qatar Exchange (QE)
Most Active Shares by Value (QR Million) Most Active Shares by Volume (Million)
Source: Qatar Exchange (QE) Source: Qatar Exchange (QE)
Investor Trading Percentage to Total Value Traded Net Traded Value by Nationality (QR Million)
Source: Qatar Exchange (QE) Source: Qatar Exchange (QE)
5.7%
1.9%
0.0%
0.0%
2.0%
4.0%
6.0%
Dlala Holding Qatar Industrial
Manufacturing
Qatar Cinema & Film
Distribution
-7.9%
-7.1% -7.1%
-6.6% -6.5%
-9.0%
-6.0%
-3.0%
0.0%
Gulf
International
Services
Medicare
Group
Al Meera
Consumer
Goods
Ooredoo United
Development
228.4
173.6
85.5 83.3 79.5
0.0
100.0
200.0
300.0
Industries
Qatar
QNB Group United
Development
Masraf Al
Rayan
Qatar Gas
Transport
(Nakilat)
4.2 4.1
3.5
2.9
2.4
0.0
2.0
4.0
6.0
Qatar Gas
Transport
(Nakilat)
United
Development
Al Khaliji Bank Masraf Al
Rayan
Vodafone Qatar
0%
20%
40%
60%
80%
100%
Buy Sell
41.58% 44.28%
21.00% 14.43%
16.87%
16.70%
20.55% 24.59%
Qatari Individuals Qatari Institutions
Non-Qatari Individuals Non-Qatari Institutions
920
550
863
607
57
(57)
(200) - 200 400 600 800 1,000
Qatari
Non-Qatari
Net Investment Total Sold Total Bought
4. Page 4 of 5
TECHNICAL ANALYSIS OF THE QE INDEX
Source: Bloomberg
The QE Index witnessed another week of sustained selling pressure and showed no signs of recovery, declining around 415 points for the second
consecutive week. The index lost around 906 points in the last two weeks, indicating significant weakness. Moreover, the index penetrated important
support levels of the 55-day moving average (current at 9,579.27) and psychological levels of (9,500.0, 9,400.0, 9,300.0), signifying this downmove is likely
to continue for a long time. This is a bad sign for the bulls as bears have taken full charge of the current trend. We believe, the index may continue to
witness additional selling pressure over the coming week and test the support level at 9,100.0, followed by 9,000.0. If the index slides below the important
psychological support of 9,000.0 (first time since May, 2013), it will create a prolonged gloomy scenario in the market. On the flip side, the index needs to
move above the resistance of 9,290.0 (January 2011 high) on a closing basis, in order to change this bearish trend, which seems difficult looking at the
current scenario. If the index breaks through this level, it could test higher levels at around 9,400.0 and 9,500.0. Meanwhile, both momentum indicators are
in a downtrend mode with no signs of immediate trend reversal, thus supporting our bearish stance.
DEFINITIONS OF KEY TERMS USED IN TECHNICAL ANALYSIS
RSI (Relative Strength Index) indicator – RSI is a momentum oscillator that measures the speed and change of price movements. The RSI oscillates
between 0 to 100. The index is deemed to be overbought once the RSI approaches the 70 level, indicating that a correction is likely. On the other hand, if
the RSI approaches 30, it is an indication that the index may be getting oversold and therefore likely to bounce back.
MACD (Moving Average Convergence Divergence) indicator – The indicator consists of the MACD line and a signal line. The divergence or the
convergence of the MACD line with the signal line indicates the strength in the momentum during the uptrend or downtrend, as the case may be. When the
MACD crosses the signal line from below and trades above it, it gives a positive indication. The reverse is the situation for a bearish trend.
Candlestick chart – A candlestick chart is a price chart that displays the high, low, open, and close for a security. The „body‟ of the chart is portion between
the open and close price, while the high and low intraday movements form the „shadow‟. The candlestick may represent any time frame. We use a one-day
candlestick chart (every candlestick represents one trading day) in our analysis.
Doji candlestick pattern – A Doji candlestick is formed when a security's open and close are practically equal. The pattern indicates indecisiveness, and
based on preceding price actions and future confirmation, may indicate a bullish or bearish trend reversal.
Shooting Star/Inverted Hammer candlestick patterns – These candlestick patterns have a small real body (open price and close price are near to each
other), and a long upper shadow (large intraday movement on the upside). The Shooting Star is a bearish reversal pattern that forms after a rally. The
Inverted Hammer looks exactly like a Shooting Star, but forms after a downtrend. Inverted Hammers represent a potential bullish trend reversal.
5. Contacts
Saugata Sarkar Ahmed M. Shehada Keith Whitney Sahbi Kasraoui
Head of Research Head of Trading Head of Sales Manager - HNWI
Tel: (+974) 4476 6534 Tel: (+974) 4476 6535 Tel: (+974) 4476 6533 Tel: (+974) 4476 6544
saugata.sarkar@qnbfs.com.qa ahmed.shehada@qnbfs.com.qa keith.whitney@qnbfs.com.qa sahbi.alkasraoui@qnbfs.com.qa
QNB Financial Services SPC
Contact Center: (+974) 4476 6666
PO Box 24025, Doha, Qatar
DISCLAIMER: This publication has been prepared by QNB Financial Services SPC (“QNBFS”) a wholly-owned subsidiary of Qatar National Bank (“QNB”). QNBFS is regulated by the Qatar
Financial Markets Authority and the Qatar Exchange; QNB is regulated by the Qatar Central Bank. This publication expresses the views and opinions of QNBFS at a given time only. It is not an
offer, promotion or recommendation to buy or sell securities or other investments, nor is it intended to constitute legal, tax, accounting, or financial advice. We therefore strongly advise potential
investors to seek independent professional advice before making any investment decision. Although the information in this report has been obtained from sources that QNBFS believes to be
reliable, we have not independently verified such information and it may not be accurate or complete. While this publication has been prepared with the utmost degree of care by our analysts,
QNBFS does not make any representations warranties as to the accuracy and completeness of the information it may contain, and declines any liability in that respect. QNBFS reserves the right
to amend the views and opinions expressed in this publication at any time. It may also express viewpoints or make investment decisions that differ significantly from, or even contradict, the views
and opinions included in this report.
COPYRIGHT: No part of this document may be reproduced without the explicit written permission of QNBFS.
Page 5 of 5
Source: Bloomberg
Company Name
Price
(Sep 05)
% Change 5-
Day
% Change
Monthly
Market Cap.
QR Million TTM P/E P/B Div. Yield
Qatar National Bank 160.50 (4.18) (4.18) 112,307 12.5 2.4 3.7
Qatar Islamic Bank 66.70 (4.44) (4.44) 15,761 14.0 1.4 5.6
Commercial Bank of Qatar 66.30 (3.07) (3.07) 16,406 8.1 1.2 9.0
Doha Bank 50.60 (5.77) (5.77) 13,074 8.7 1.5 8.2
Al Ahli Bank 52.00 (5.45) (5.45) 6,608 12.8 2.0 5.7
Qatar International Islamic Bank 54.60 (1.62) (1.62) 8,265 11.7 1.7 6.4
Masraf Al Rayan 28.05 (2.94) (2.94) 21,038 13.1 2.2 3.6
Al Khaliji Bank 17.90 (3.19) (3.19) 6,444 11.9 1.2 5.6
National Leasing 32.70 (4.39) (4.39) 1,618 9.5 1.2 6.1
Dlala Holding 20.35 5.66 5.66 452 N/M 2.1 N/A
Qatar & Oman Investment 12.31 (1.12) (1.12) 388 20.2 1.2 4.1
Islamic Holding Group 37.00 (4.64) (4.64) 148 23.6 2.8 3.0
Banking and Financial Services 202,506
Zad Holding 62.20 (1.27) (1.27) 814 8.7 1.1 6.4
Qatar German Co. for Medical Devices 14.30 (0.69) (0.69) 165 N/M 0.9 N/A
Salam International Investment 12.07 (3.29) (3.29) 1,380 22.9 0.9 5.8
Medicare Group 44.55 (7.09) (7.09) 1,254 21.1 1.6 4.0
Qatar Cinema & Film Distribution 49.10 0.00 0.00 280 29.7 2.1 4.1
Qatar Fuel 270.00 (4.56) (4.56) 17,542 15.4 3.1 3.7
Qatar Meat and Livestock 49.50 (6.07) (6.07) 891 13.6 3.9 8.1
Al Meera Consumer Goods 122.20 (7.07) (7.07) 2,444 16.0 2.0 6.5
Consumer Goods and Services 24,769
Qatar Industrial Manufacturing 49.00 1.87 1.87 1,940 11.4 1.5 6.1
Qatar National Cement 101.00 (1.17) (1.17) 4,959 11.4 2.1 5.9
Industries Qatar 146.00 (4.89) (4.89) 88,330 9.8 2.9 5.3
Qatari Investors Group 26.65 (4.99) (4.99) 3,313 16.6 1.6 2.8
Qatar Electricity and Water 153.10 (3.10) (3.10) 15,310 10.7 2.9 4.8
Mannai Corp. 83.20 (0.95) (0.95) 3,796 8.8 1.7 5.7
Aamal 14.30 (2.05) (2.05) 8,580 13.4 1.3 N/A
Gulf International Services 44.20 (7.92) (7.92) 6,571 11.7 2.4 3.4
Industrials 132,800
Qatar Insurance 59.50 (0.83) (0.83) 7,642 9.2 1.6 3.4
Doha Insurance 25.00 (3.85) (3.85) 644 11.7 1.3 3.6
Qatar General Insurance & Reinsurance 51.00 (0.58) (0.58) 2,940 3.5 0.9 1.7
Al Khaleej Takaful Insurance 38.20 (5.68) (5.68) 652 13.7 1.2 2.2
Qatar Islamic Insurance 54.00 (5.92) (5.92) 810 13.7 3.1 6.5
Insurance 12,687
United Development 20.02 (6.45) (6.45) 6,751 8.9 0.6 5.0
Barwa Real Estate 24.00 (2.04) (2.04) 9,339 15.5 0.7 6.3
Ezdan Real Estate 17.18 (1.49) (1.49) 45,570 N/M 1.6 0.8
Mazaya Qatar Real Estate Development 11.26 (0.62) (0.62) 1,126 16.9 1.0 5.3
Real Estate 62,786
Qatar Telecom 129.90 (6.55) (6.55) 41,610 12.4 1.6 3.8
Vodafone Qatar 8.81 (2.33) (2.33) 7,448 N/M 1.2 N/A
Telecoms 49,058
Qatar Navigation (Milaha) 76.10 (2.44) (2.44) 8,715 9.0 0.7 4.9
Gulf Warehousing 39.20 (1.38) (1.38) 1,864 19.3 2.5 N/A
Qatar Gas Transport (Nakilat) 18.25 (5.39) (5.39) 10,220 13.6 3.2 5.5
Transportation 20,800
Qatar Exchange 505,406