Weekly Market Report
•
0 likes•532 views

The Qatar Exchange Index gained 2.25% over the week to close at 10,109.50 points. Trading value and volume increased substantially compared to the prior week. Al Khalij Commercial Bank was the best performing stock, up 11.79% for the week. Emerging markets remain under pressure from the potential tapering of US quantitative easing programs, which could slow global growth. Regional markets have fared better than emerging markets in recent weeks.

Recommended
More Related Content
What's hot
What's hot (20)
Viewers also liked
Viewers also liked (8)
Similar to Weekly Market Report
Similar to Weekly Market Report (20)
More from QNB Group
More from QNB Group (20)
Recently uploaded
Recently uploaded (20)
Weekly Market Report
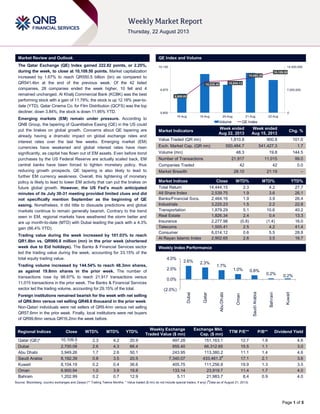
- 1. Page 1 of 5 Market Review and Outlook QE Index and Volume The Qatar Exchange (QE) Index gained 222.82 points, or 2.25%, during the week, to close at 10,109.50 points. Market capitalization increased by 1.67% to reach QR550.5 billion (bn) as compared to QR541.4bn at the end of the previous week. Of the 42 listed companies, 28 companies ended the week higher, 10 fell and 4 remained unchanged. Al Khalij Commercial Bank (KCBK) was the best performing stock with a gain of 11.79%; the stock is up 12.18% year-to- date (YTD). Qatar Cinema Co. for Film Distribution (QCFS) was the top decliner, down 3.84%; the stock is down 11.95% YTD. Emerging markets (EM) remain under pressure. According to QNB Group, the tapering of Quantitative Easing (QE) in the US could put the brakes on global growth. Concerns about QE tapering are already having a dramatic impact on global exchange rates and interest rates over the last few weeks. Emerging market (EM) currencies have weakened and global interest rates have risen significantly, as capital has flown out of EM assets. Even before bond purchases by the US Federal Reserve are actually scaled back, EM central banks have been forced to tighten monetary policy, thus reducing growth prospects. QE tapering is also likely to lead to further EM currency weakness. Overall, this tightening of monetary policy is likely to lead to lower EM activity that can put the brakes on future global growth. However, the US Fed’s much anticipated minutes of its July 30-31 meeting provided limited clues and did not specifically mention September as the beginning of QE easing. Nonetheless, it did little to dissuade predictions and global markets continue to remain generally bearish. Contrary to the trend seen in EM, regional markets have weathered the storm better and are up month-to-date (MTD) with Dubai leading the pack with a 4.3% gain (66.4% YTD). Trading value during the week increased by 101.03% to reach QR1.8bn vs. QR900.8 million (mn) in the prior week (shortened week due to Eid holidays). The Banks & Financial Services sector led the trading value during the week, accounting for 33.15% of the total equity trading value. Trading volume increased by 144.54% to reach 48.3mn shares, as against 19.8mn shares in the prior week. The number of transactions rose by 98.97% to reach 21,917 transactions versus 11,015 transactions in the prior week. The Banks & Financial Services sector led the trading volume, accounting for 29.15% of the total. Foreign institutions remained bearish for the week with net selling of QR6.9mn versus net selling QR48.6 thousand in the prior week. Non-Qatari individuals were net sellers of QR9.4mn versus net selling QR57.6mn in the prior week. Finally, local institutions were net buyers of QR99.8mn versus QR16.2mn the week before. Market Indicators Week ended Aug 22, 2013 Week ended Aug 15, 2013 Chg. % Value Traded (QR mn) 1,810.8 900.8 101.0 Exch. Market Cap. (QR mn) 550,484.7 541,427.3 1.7 Volume (mn) 48.3 19.8 144.5 Number of Transactions 21,917 11,015 99.0 Companies Traded 42 42 0.0 Market Breadth 28:10 21:19 – Market Indices Close WTD% MTD% YTD% Total Return 14,444.15 2.3 4.2 27.7 All Share Index 2,539.75 1.9 3.6 26.1 Banks/Financial Svcs. 2,464.16 1.9 3.9 26.4 Industrials 3,225.23 1.5 2.2 22.8 Transportation 1,879.29 5.1 10.6 40.2 Real Estate 1,826.34 2.4 0.4 13.3 Insurance 2,277.98 (0.8) (1.4) 16.0 Telecoms 1,505.41 2.5 4.2 41.4 Consumer 6,014.12 0.6 5.5 28.8 Al Rayan Islamic Index 2,902.65 2.6 3.5 16.7 Market Indices Weekly Index Performance Regional Indices Close WTD% MTD% YTD% Weekly Exchange Traded Value ($ mn) Exchange Mkt. Cap. ($ mn) TTM P/E** P/B** Dividend Yield Qatar (QE)* 10,109.5 0 2.3 4.2 20.9 497.28 151,163.1 12.7 1.8 4.6 Dubai 2,700.08 2.6 4.3 66.4 855.40 66,312.65 15.5 1.1 3.0 Abu Dhabi 3,949.26 1.7 2.6 50.1 243.95 113,380.2 11.1 1.4 4.6 Saudi Arabia 8,192.39 0.8 3.5 20.5 7,340.07 433,461.3# 17.1 2.1 3.6 Kuwait 8,104.19 0.2 0.4 36.6 405.75 111,256.8 19.9 1.3 3.5 Oman 6,900.94 1.0 3.9 19.8 133.14 23,919.7 11.4 1.7 4.0 Bahrain 1,202.99 0.2 0.7 12.9 5.11 21,983.7 8.4 0.9 4.0 Source: Bloomberg, country exchanges and Zawya (** Trailing Twelve Months; * Value traded ($ mn) do not include special trades, if any) ( # Data as of August 21, 2013) 9,909.85 10,038.40 10,044.13 10,065.20 10,109.50 0 7,000,000 14,000,000 9,800 9,975 10,150 18-Aug 19-Aug 20-Aug 21-Aug 22-Aug Volume QE Index 2.6% 2.3% 1.7% 1.0% 0.8% 0.2% 0.2% (2.0%) 0.0% 2.0% 4.0% Dubai Qatar AbuDhabi Oman SaudiArabia Bahrain Kuwait
- 2. Page 2 of 5 News Economic News Qatar’s current account surplus widens to QR71.3bn in 1Q2013 – According to the data released by the Qatar Central Bank (QCB), Qatar's current account surplus has widened to QR71.3bn in 1Q2013, which is 38.5% of the GDP. The data also showed that Qatar had a surplus of QR49.6bn in 4Q2012, which was 27.4% of the GDP. In 1Q2013, trade balance stood at QR103.0bn as compared to QR92.6bn in 4Q2012. Exports were up to QR129.8bn in 1Q2013, while imports declined to QR26.8bn in 1Q2013. Meanwhile, according to the forecast of analysts polled by Reuters in April, Qatar would post a current account surplus of 25.5% of GDP in 2013 and 20.0% in 2014. (Reuters) FDI outflow from Qatar slips by 8.5% in 2012 – According to the annual World Investment Report 2013 of the United Nations Conference on Trade & Development (UNCTAD), FDI outflows from Qatar to other countries declined by 8.5% to $1.8bn in 2012. UNCTAD‟s country fact sheet on Qatar‟s cross-border merger & acquisitions shows the country‟s net purchases reached $4.61bn in 2012. Meanwhile, Qatar‟s inward fund flow saw a marginal increase of 0.6% to $327mn. (Peninsula Qatar) Qatari government spending slows in 2012-13 – According to the data released by Qatar Central Bank, the Qatar government‟s spending rose 2.2% to a record high of QR178.2bn in its last fiscal year, though slowing sharply from the double-digit increases seen in the previous decade. It was the first time that the government's annual spending undershot its budget plan since 1990. Total spending came in slightly below the initial plan of QR178.6bn for the fiscal year that ended in March 2013. Development expenditure stood at QR49.3bn, well below the QR62.1bn that the government had originally earmarked for the year. Qatar spent a record QR34.1bn on public sector wages in FY2013, nearly 15% more than in the previous year. (Reuters) Qatar sees 75,000 visitors from GCC during Eid-al-Fitr holiday – According to the Qatar Tourism Authority, nearly 75,000 visitors from the GCC region had chosen Qatar as their destination of choice for the Eid-al-Fitr holiday. Tourists joined celebrations across the country in programs at Doha Exhibition Center, Katara Cultural Village, Souq Waqif, malls, museums, Aquapark, The Pearl Qatar and other locations. (AME Info) Market & Corporate News QCB sends draft on Basel III rules to banks – The Qatar Central Bank (QCB) has sent a draft circular on the new Basel III capital rules to conventional and Islamic banks in Qatar. These new capital rules include the requirements for issuing instruments such as hybrid bonds. QCB said this is a consultative circular and the final version is slated to be completed once a quantitative impact study is undertaken for national banks. The hybrid debt, which has equity-like characteristics allowing it to be counted toward banks‟ core capital ratios, can include perpetual debt and Islamic bonds. (GulfBase.com) Qatar monthly banking update for July 2013 – Deposits decreased by 4.8% MoM (+11.1% YTD), while loans increased by 2.3% MoM (+9.1% YTD) in July 2013. However, the banking sector‟s loan-to-deposit ratio (LDR) rose to 109% in July 2013 versus 102% at the end of June 2013. (QCB) S&P affirms rating for DHBK’s subsidiary with Stable outlook – S&P has affirmed the rating for Doha Bank Assurance Company‟s (Doha Bank‟s (DHBK) subsidiary) counterparty credit and insurer financial strength at BBB with a Stable outlook. (Gulf-Times.com) Qatar leads MENA M&A deals in 1H2013 – According to a report by E&Y, Qatar led the Middle East & North Africa (MENA) region with four out of the top 10 merger & acquisition (M&A) deals by value, followed by the UAE during 1H2013. The largest sovereign wealth fund (SWF) deal was the Qatar Foundation‟s acquisition of 5% stake in India-based Bharti Airtel Ltd for $1.26bn. The majority of SWF and private equity activities were in the telecommunications sector. The value of disclosed inbound deals in the MENA region increased from $5.1bn in 1H2012 to $10.6bn in 1H2013, indicating a rise of 108%. However, outbound deals dropped by 37% from $10.5bn in 1H2012 to $6.6bn in 1H2013. (Peninsula Qatar) RasGas completes offshore drilling in Barzan Gas project – RasGas Company Limited has successfully completed offshore drilling for 30 development wells worth $10.3bn in Barzan Gas Project. This paves the way for subsequent phases of the project to proceed for connecting the wells to subsea pipelines that will bring the gas to shore.. (AME Info) Qatar real estate transactions double in July – According to a report by Ezdan Holding, real estate transactions in Qatar grew by 103% YoY in July to reach QR5.5bn despite the onset of the summer season and Ramadan holidays. The report said that Qatar's real estate sector has benefited from the boom in projects related to Qatar's National Vision 2030 strategy and also due to the commencement of mega projects for the 2022 FIFA World Cup. Further, the award of tenders for Doha Metro by Qatar Rail has created a positive impact, stimulating the real estate sector. The report referred to the sales growth in The Pearl Qatar during 2Q2013, which continues to attract investors interested in the luxury residential sector. (Peninsula Qatar) Markhiya infrastructure upgrade gathers steam – Several infrastructure projects are being implemented in Markhiya as part of the Central Municipal Council‟s plans to upgrade public services and facilities in the area. The Central Municipal Council‟s Member for Markhiya constituency, Dr Mohamed Jassim al-Mislimani said several projects have been completed as part of Hazm Al Markhiya‟s infrastructure development undertaken at an estimated cost of QR400mn. These projects include constructing new streets, providing adequate lighting, paving and other road works, developing a water and sanitation grid, and building cycling tracks and public gardens. (Gulf- Times.com) Es'hailSat, ARABSAT sign strategic partnership agreement – Es'hailSat Qatar Satellite Company and Arab Satellite Communications Organization (ARABSAT) have signed a strategic partnership agreement to promote cooperation and strengthen the reach of TV broadcasting in Qatar. Under this agreement, Es'hailSat will acquire the rights to 500MHz of premium Ku-band bandwidth at the 26 degrees East TV broadcasting hot-spot. Es'hailSat's second satellite, Es'hail 2, will use these frequencies and will be designed to provide DTH and other telecommunications services from this hot spot. This will significantly increase Es'hailSat's capacity, and will strengthen Es'hailSat's in-orbit back-up capability when both Es'hail 1 and Es'hail 2 are operational. (AME Info) QA to extend its network to Delhi and Bangalore – Qatar Airways (QA) is planning to extend its Boeing 787 Dreamliner network to the Indian cities of Delhi and Bangalore starting from September 1, 2013. (AME Info)
- 3. Page 3 of 5 Qatar Exchange Top 5 Gainers Top 5 Decliners Source: Qatar Exchange (QE) Source: Qatar Exchange (QE) Most Active Shares by Value (QR Million) Most Active Shares by Volume (Million) Source: Qatar Exchange (QE) Source: Qatar Exchange (QE) Investor Trading Percentage to Total Value Traded Net Traded Value by Nationality (QR Million) Source: Qatar Exchange (QE) Source: Qatar Exchange (QE) 11.8% 8.5% 7.9% 6.5% 6.4% 0.0% 3.0% 6.0% 9.0% 12.0% Al Khaliji Bank Qatari Investors Group Milaha Aamal Qatar International Islamic Bank -3.8% -1.7% -1.3% -1.1% -0.8% -6.0% -4.5% -3.0% -1.5% 0.0% Qatar Cinema & Film Distribution Qatar General Insurance & Reinsurance Qatar Electricity and Water Mannai Corp. Qatar Insurance 158.2 157.0 147.1 109.8 97.7 0.0 60.0 120.0 180.0 Milaha Qatar Gas Transport (Nakilat) Industries Qatar Qatar Insurance QNB Group 7.6 4.9 3.1 3.1 3.0 0.0 2.0 4.0 6.0 8.0 Qatar Gas Transport (Nakilat) Al Khaliji Bank Mazaya Qatar Real Estate Development Barwa Real Estate United Development 0% 20% 40% 60% 80% 100% Buy Sell 41.37% 45.99% 26.66% 21.15% 12.40% 12.92% 19.57% 19.95% Qatari Individuals Qatari Institutions Non-Qatari Individuals Non-Qatari Institutions 1,232 579 1,216 595 16 (16) (200) - 200 400 600 800 1,000 1,200 1,400 Qatari Non-Qatari Net Investment Total Sold Total Bought
- 4. Page 4 of 5 TECHNICAL ANALYSIS OF THE QE INDEX Source: Bloomberg The QE Index ended last week on a strong note extending its upswing, tagging a new 52-week high of 10,109.50, continuing its recent trend of new highs. There were many positive developments last week as the index breached all the three psychological levels (9,900.0, 10,000.0 and 10,100.0) registering impressive gains. The index gained around 223 points (2.25%) last week. Strong buying pushed the index to its weekly high on Thursday – registering its highest level since 2008. The index rebounded near the 9,850.0 level, staging a remarkable rally thus indicating strength. We believe the index is in upswing mode and may continue its bullish trend toward the 10,200.0 level. If the index continues to advance beyond this level, it may proceed toward the 10,300.0 level. The recent uptrend has been sharp, which is keeping the RSI in perpetual overbought state; however, it does not seem to be affecting the index‟s current performance. Meanwhile, the MACD is in uptrend mode showing no immediate trend reversal signs, indicating that this rally may not fizzle out. On the downside, the ascending trendline remains a key support area for the index as any penetration below this trendline may test the 10,000.0 level. Thus, traders may continue to adopt a bullish approach, but should keep a close watch on the trendline for any reversal. DEFINITIONS OF KEY TERMS USED IN TECHNICAL ANALYSIS RSI (Relative Strength Index) indicator – RSI is a momentum oscillator that measures the speed and change of price movements. The RSI oscillates between 0 to 100. The index is deemed to be overbought once the RSI approaches the 70 level, indicating that a correction is likely. On the other hand, if the RSI approaches 30, it is an indication that the index may be getting oversold and therefore likely to bounce back. MACD (Moving Average Convergence Divergence) indicator – The indicator consists of the MACD line and a signal line. The divergence or the convergence of the MACD line with the signal line indicates the strength in the momentum during the uptrend or downtrend, as the case may be. When the MACD crosses the signal line from below and trades above it, it gives a positive indication. The reverse is the situation for a bearish trend. Candlestick chart – A candlestick chart is a price chart that displays the high, low, open, and close for a security. The „body‟ of the chart is portion between the open and close price, while the high and low intraday movements form the „shadow‟. The candlestick may represent any time frame. We use a one-day candlestick chart (every candlestick represents one trading day) in our analysis. Doji candlestick pattern – A Doji candlestick is formed when a security's open and close are practically equal. The pattern indicates indecisiveness, and based on preceding price actions and future confirmation, may indicate a bullish or bearish trend reversal. Shooting Star/Inverted Hammer candlestick patterns – These candlestick patterns have a small real body (open price and close price are near to each other), and a long upper shadow (large intraday movement on the upside). The Shooting Star is a bearish reversal pattern that forms after a rally. The Inverted Hammer looks exactly like a Shooting Star, but forms after a downtrend. Inverted Hammers represent a potential bullish trend reversal.
- 5. Contacts Saugata Sarkar Ahmed M. Shehada Keith Whitney Sahbi Kasraoui Head of Research Head of Trading Head of Sales HNWI Tel: (+974) 4476 6534 Tel: (+974) 4476 6535 Tel: (+974) 4476 6533 Tel: (+974) 4476 6544 saugata.sarkar@qnbfs.com.qa ahmed.shehada@qnbfs.com.qa keith.whitney@qnbfs.com.qa sahbi.alkasraoui@qnbfs.com.qa QNB Financial Services SPC Contact Center: (+974) 4476 6666 PO Box 24025, Doha, Qatar DISCLAIMER: This publication has been prepared by QNB Financial Services SPC (“QNBFS”) a wholly-owned subsidiary of Qatar National Bank (“QNB”). QNBFS is regulated by the Qatar Financial Markets Authority and the Qatar Exchange; QNB is regulated by the Qatar Central Bank. This publication expresses the views and opinions of QNBFS at a given time only. It is not an offer, promotion or recommendation to buy or sell securities or other investments, nor is it intended to constitute legal, tax, accounting, or financial advice. We therefore strongly advise potential investors to seek independent professional advice before making any investment decision. Although the information in this report has been obtained from sources that QNBFS believes to be reliable, we have not independently verified such information and it may not be accurate or complete. While this publication has been prepared with the utmost degree of care by our analysts, QNBFS does not make any representations warranties as to the accuracy and completeness of the information it may contain, and declines any liability in that respect. QNBFS reserves the right to amend the views and opinions expressed in this publication at any time. It may also express viewpoints or make investment decisions that differ significantly from, or even contradict, the views and opinions included in this report. COPYRIGHT: No part of this document may be reproduced without the explicit written permission of QNBFS. Page 5 of 5 Source: Bloomberg Company Name Price (August 22) % Change 5- Day % Change Monthly Market Cap. QR Million TTM P/E P/B Div. Yield Qatar National Bank 177.10 0.63 0.06 123,922 13.8 2.6 3.4 Qatar Islamic Bank 73.80 6.03 7.11 17,438 15.5 1.6 5.1 Commercial Bank of Qatar 70.10 0.14 2.34 17,346 8.6 1.2 8.6 Doha Bank 55.90 (0.18) 10.26 14,443 9.6 1.7 7.4 Al Ahli Bank 54.50 0.00 2.64 6,926 13.4 2.1 5.5 Qatar International Islamic Bank 59.60 6.43 10.17 9,022 12.8 1.8 5.9 Masraf Al Rayan 30.05 1.01 6.94 22,538 14.1 2.3 3.3 Al Khaliji Bank 19.06 11.79 13.05 6,862 12.7 1.3 5.2 National Leasing 36.30 5.07 2.69 1,796 10.6 1.4 5.5 Dlala Holding 21.12 1.54 (0.42) 469 N/M 2.2 N/A Qatar & Oman Investment 13.20 1.93 1.07 416 21.7 1.3 3.8 Islamic Holding Group 40.50 0.00 0.00 162 25.9 3.1 2.8 Banking and Financial Services 221,339 Zad Holding 66.40 (0.15) 10.67 869 9.3 1.1 6.0 Qatar German Co. for Medical Devices 15.04 (0.07) (4.51) 174 N/M 0.9 N/A Salam International Investment 12.12 3.50 (3.35) 1,385 23.0 0.9 5.8 Medicare Group 51.20 3.23 10.34 1,441 24.3 1.9 3.5 Qatar Cinema & Film Distribution 50.10 (3.84) (4.21) 286 30.3 2.1 4.0 Qatar Fuel 289.00 0.24 7.84 18,776 16.4 3.3 3.5 Qatar Meat and Livestock 56.00 0.54 (6.51) 1,008 15.3 4.4 7.1 Al Meera Consumer Goods 134.80 0.52 (0.88) 2,696 17.7 2.2 5.9 Consumer Goods and Services 26,635 Qatar Industrial Manufacturing 50.00 (0.20) (2.53) 1,980 11.6 1.5 6.0 Qatar National Cement 103.50 0.88 4.02 5,082 11.7 2.1 5.8 Industries Qatar 161.00 1.19 1.32 97,405 10.9 3.2 4.8 Qatari Investors Group 31.15 8.54 9.88 3,873 19.4 1.9 2.4 Qatar Electricity and Water 163.40 (1.27) (0.37) 16,340 11.4 3.1 4.5 Mannai Corp. 87.00 (1.14) 0.23 3,969 9.2 1.8 5.5 Aamal 15.34 6.53 7.27 9,204 14.4 1.4 N/A Gulf International Services 49.90 0.00 4.28 7,419 13.2 2.7 3.0 Industrials 145,271 Qatar Insurance 61.00 (0.81) (0.65) 7,834 9.5 1.6 3.3 Doha Insurance 25.60 0.39 2.40 659 12.0 1.3 3.6 Qatar General Insurance & Reinsurance 53.00 (1.67) (5.02) 3,055 3.6 0.9 1.7 Al Khaleej Takaful Insurance 41.30 0.73 2.86 705 14.8 1.3 2.0 Qatar Islamic Insurance 59.00 0.51 (1.99) 885 14.9 3.4 5.9 Insurance 13,139 United Development 22.77 (0.57) 1.29 7,679 10.1 0.7 4.4 Barwa Real Estate 26.05 4.74 (0.76) 10,137 16.9 0.8 5.8 Ezdan Real Estate 17.86 2.06 4.75 47,374 N/M 1.7 0.7 Mazaya Qatar Real Estate Development 12.05 3.26 5.24 1,205 18.1 1.1 5.0 Real Estate 66,394 Qatar Telecom 145.80 2.60 4.29 46,703 13.9 1.8 3.4 Vodafone Qatar 9.38 1.74 3.65 7,930 N/M 1.3 N/A Telecoms 54,633 Qatar Navigation (Milaha) 83.80 7.85 10.26 9,597 9.9 0.8 4.5 Gulf Warehousing 42.00 0.00 1.20 1,998 20.7 2.6 N/A Qatar Gas Transport (Nakilat) 20.50 3.90 12.64 11,480 15.3 3.6 4.9 Transportation 23,075 Qatar Exchange 550,485