QNBFS Weekly Market Report October 25, 2018
•
0 likes•79 views

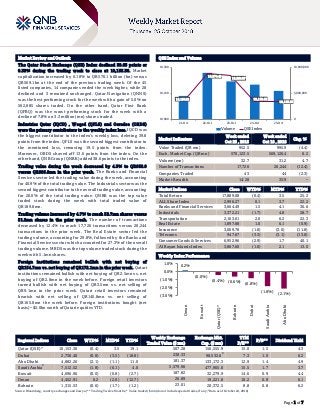
The Qatar Stock Exchange (QSE) Index declined 39.65 points or 0.39% during the trading week to close at 10,153.36.

Recommended
Recommended
More Related Content
More from QNB Group
More from QNB Group (20)
Recently uploaded
Recently uploaded (20)
QNBFS Weekly Market Report October 25, 2018
- 1. ` Page 1 of 7 Market Review and Outlook QSE Index and Volume The Qatar Stock Exchange (QSE) Index declined 39.65 points or 0.39% during the trading week to close at 10,153.36. Market capitalization increased by 0.18% to QR570.1 billion (bn) versus QR569.1bn at the end of the previous trading week. Of the 45 listed companies, 14 companies ended the week higher, while 28 declined and 3 remained unchanged. Qatar Navigation (QNNS) was the best performing stock for the week with a gain of 5.0% on 562,885 shares traded. On the other hand, Qatar First Bank (QFBQ) was the worst performing stock for the week with a decline of 7.8% on 3.3 million (mn) shares traded. Industries Qatar (IQCD) , Woqod (QFLS) and Ooredoo (ORDS) were the primary contributors to the weekly index loss. IQCD was the biggest contributor to the index’s weekly loss, deleting 39.8 points from the index. QFLS was the second biggest contributor to the mentioned loss, removing 19.5 points from the index. Moreover, ORDS shaved off 13.6 points from the index. On the other hand, QNB Group (QNBK) added 38.6 points to the index. Trading value during the week decreased by 4.3% to QR952.9 versus QR995.9mn in the prior week. The Banks and Financial Services sector led the trading value during the week, accounting for 40.9% of the total trading value. The Industrials sector was the second biggest contributor to the overall trading value, accounting for 20.0% of the total trading value. QNBK was the top value traded stock during the week with total traded value of QR189.8mn. Trading volume increased by 4.7% to reach 32.7mn shares versus 31.2mn shares in the prior week. The number of transactions decreased by 12.4% to reach 17,726 transactions versus 20,244 transactions in the prior week. The Real Estate sector led the trading volume, accounting for 29.8%, followed by the Banks and Financial Services sector which accounted for 27.3% of the overall trading volume. MRDS was the top volume traded stock during the week with 5.1mn shares. Foreign institutions remained bullish with net buying of QR134.7mn vs. net buying of QR172.1mn in the prior week. Qatari institutions remained bullish with net buying of QR2.5mn vs. net buying of QR2.8mn in the week before. Foreign retail investors turned bullish with net buying of QR3.5mn vs. net selling of QR9.1mn in the prior week. Qatari retail investors remained bearish with net selling of QR140.8mn vs. net selling of QR165.8mn the week before. Foreign institutions bought (net basis) ~$2.0bn worth of Qatari equities YTD. Market Indicators Week ended Oct 25 , 2018 Week ended Oct 18 , 2018 Chg. % Value Traded (QR mn) 952.5 995.9 (4.4) Exch. Market Cap. (QR mn) 570,123.5 569,126.4 0.2 Volume (mn) 32.7 31.2 4.7 Number of Transactions 17,726 20,244 (12.4) Companies Traded 43 44 (2.3) Market Breadth 14:28 35:9 – Market Indices Close WTD% MTD% YTD% Total Return 17,889.08 (0.4) 3.5 25.2 ALL Share Index 2,996.27 0.1 3.7 22.2 Banks and Financial Services 3,664.49 1.5 4.1 36.6 Industrials 3,372.21 (1.7) 4.8 28.7 Transportation 2,163.01 2.0 6.2 22.3 Real Estate 1,897.88 1.0 6.1 (0.9) Insurance 3,069.78 (1.8) (3.0) (11.8) Telecoms 947.67 (3.3) (3.1) (13.8) Consumer Goods & Services 6,952.96 (2.9) 1.7 40.1 Al Rayan Islamic Index 3,867.60 (1.0) 2.1 13.0 Market Indices Weekly Index Performance Regional Indices Close WTD% MTD% YTD% Weekly Exchange Traded Value ($ mn) Exchange Mkt. Cap. ($ mn) TTM P/E** P/B** Dividend Yield Qatar (QSE)* 10,153.36 (0.4) 3.5 19.1 507.28 156,555.9 15.0 1.5 4.3 Dubai 2,736.40 (0.8) (3.5) (18.8) 238.33 98,532.6# 7.3 1.0 6.2 Abu Dhabi 4,882.26 (2.1) (1.1) 11.0 181.37 133,172.3 12.9 1.4 4.9 Saudi Arabia# 7,512.52 (1.8) (6.1) 4.0 5,579.96 477,965.0 15.5 1.7 3.7 Kuwait 4,696.96 (0.0) (0.8) (2.7) 187.82 32,279.9 14.6 0.9 4.4 Oman 4,452.91 0.2 (2.0) (12.7) 26.89 19,221.8 10.2 0.8 6.1 Bahrain 1,315.53 (0.6) (1.7) (1.2) 23.01 20,372.5 8.8 0.8 6.2 Source: Bloomberg, country exchanges and Zawya (** Trailing Twelve Months; * Value traded ($ mn) do not include special trades, if any; # Data as of October 24, 2018) 10,154.21 10,274.45 10,264.07 10,152.62 10,153.36 0 5,000,000 10,000,000 10,080 10,190 10,300 21-Oct 22-Oct 23-Oct 24-Oct 25-Oct Volume QSE Index 0.2% (0.0%) (0.4%) (0.6%) (0.8%) (1.8%) (2.1%) (3.0%) (2.0%) (1.0%) 0.0% 1.0% Oman Kuwait Qatar(QSE)* Bahrain Dubai SaudiArabia AbuDhabi
- 2. Page 2 of 7 News Economic & Market News Qamco’s QR2.73bn IPO to hit the market on October 30 – The proposed QR2.73bn Initial Public Offering (IPO) of Qatar Aluminum Manufacturing Company (Qamco) will hit the market on October 30, offering 49% stake to citizens. Qatar Petroleum (QP) is the sole founder of Qamco, which has a proposed issued share capital of QR5.58bn of 558.01mn ordinary shares and one special share with nominal value of QR10 each. QP is offering 273.43mn shares of Qamco at QR10.1 (including the listing costs of 10 Dirhams). The offer will remain on tap until November 12. Qamco will hold 50% stake in Qatalum, a joint venture between QP and Norwegian company Hydro. QP will transfer its entire 50% stake in Qatalum, QP's successful downstream venture, to Qamco. Shares are expected to be traded on the Qatar Stock Exchange by mid-December after obtaining all remaining regulatory approvals. After the IPO, QP will have 51% stake and the balance 49% will be with the public. Of the 49% IPO, as much as 44% or 245.53mn shares will be allotted for individuals and the remaining 5% or 27.9mn shares for select institutions. Individuals can subscribe a minimum of 50 shares and maximum of 11.16mn shares. In the first allocation tranche, subscriptions of 50-750 offer shares (inclusive) will be allotted in full and in the second tranche, subscriptions of more than 750 offer shares will be allotted in multiples of 50 offer shares. (Gulf-Times.com) IQCD reports an in-line 3Q2018; maintain Market Perform with QR126 price target – IQCD’s bottom line rises 76.0% YoY and 6.0% QoQ in 3Q2018 to QR1,316.3mn in 3Q2018, in line with our estimate of QR1,290.6mn (variation of +2.0%). The company's reported steel sales came in at QR1,533.8mn in 3Q2018, which represents an increase of 33.5% YoY. However, on a QoQ basis, steel sales fell 6.8%. Steel sales exceeded our model by 6.6% continuing a recent trend, which has seen strong steel top-line as IQCD sells (from 4Q2017 onward) billets previously earmarked for steel bar production in its Dubai operations. Income from JVs that represents IQCD’s stakes in petrochemicals and fertilizers also came in line with our forecast at QR1,073.4bn (QNBFS estimate: QR1,028.9mn or a divergence of 4.3%). JV income jumped 89.2% YoY and 8.0% QoQ. EPS amounted to QR6.32 in 9M2018 as compared to QR3.90 in 9M2017. In 9M2018, steel revenue reported under IFRS 11 was QR4.6bn, significantly up by 43.6% on last year. This revenue growth was largely attributable to a moderate improvement in sales volumes due to the change of sales mix, marketing strategy and increased selling prices. On the other hand, on a like-for-like basis, management reporting revenue, that includes steel+ petchems+ fertilizers (assuming proportionate consolidation) was QR12.3bn (QNBFS estimate: QR12.2bn), a significant increase of 24% over 2017. This increase was due to the combined effect of improved prices and volumes versus the previous year. Net Profit for 9M2018 was QR3.8bn, a healthy growth of 62.3% YoY. This improved performance was driven by a combination of factors including increased product prices, a moderate growth in sales volumes, efficiently managed operating assets base and efforts towards optimizing operations and costs. The YoY moderate improvement of sales volumes was partially due to higher PE production, as the polyethylene facilities were on an extended unplanned shutdown during the first nine months of 2017 (specifically during 1Q2017). Additionally, stable global demand aided the group’s fertilizer segment to maintain its sales volumes, while the sales of steel products improved due to aforementioned factors. IQCD’s balance sheet continues to remain solid as cash across the group stands at QR12.1bn after paying 2017’s dividend of QR3.0bn, and periodic debt payments amounting to QR0.3bn. Total debt across the group now stands at only QR0.2bn, down from QR0.5bn as at December 31, 2017. We note that reported results are in-line with our model and we are comfortable with our QR5.1bn net income estimate (QR8.44 in EPS) for 2018 and believe modest upside to our estimates is possible. We rate IQCD a Market Perform with a PT of QR126. IQCD is fully valued-to- expensive @ 16.5x and 16.0x P/E for 2018 and 2019, respectively. (QNBFS Research, Company releases) CBQK bottom-line surges YoY but drops by 10.2% QoQ in 3Q2018, in-line with our estimate – The Commercial Bank's (CBQK) net profit surged YoY (but declined 10.2% on QoQ basis) to QR404.6mn in 3Q2018 driven by a 61.2% drop in provisions and impairments, in-line with our estimate of QR426.2mn (variation of -5.1%). Net interest income decreased 4.5% YoY and 13.3% QoQ in 3Q2018 to QR580.0mn. EPS amounted to QR1.00 in 3Q2018 as compared to QR0.20 in 3Q2017 and QR1.11 in 2Q2018. The bank's total assets stood at QR138.7bn at the end of September 30, 2018, up 3.5% YoY. However, on QoQ basis, the bank's total assets decreased 0.9%. Loans and advances to customers were QR84.8bn at the end of September 30, 2018, dropping by 2.8% QoQ (-4.9% YTD). Deposits remained flat QoQ (down 3.5% YTD) at QR74.9bn. In 9M2018, CBQK reported net profit of QR1.26bn, a significant 386.4% jump as compared to QR259.0mn recorded for the same period in 2017. Net operating income increased by 0.4% to QR2.66bn for the nine months ended 30 September 2018, up from QR2.65bn achieved in the same period in 2017. Net interest income increased by 4.0% to QR1.91bn compared to QR1.84bn recorded from a year ago, driven mainly by re- pricing of some of the loans during the period. Net interest margin was 2.3% for the nine months, an increase of 0.1%. Non-interest income decreased by 7.8% to QR755mn from QR819mn. The overall decrease in non-interest income was mainly due to lower income from investment securities as equity holdings were scaled down in line with the strategic plan and lower foreign exchange income. Total operating expenses were tightly managed at a group level, down 12% to QR892mn compared with QR1.01bn. Costs reductions were primarily driven by lower staff and administrative expenses. The group’s net provisions for loans and advances decreased 57.5% to QR 617mn from QR1.45bn. The non-performing loan (NPL) ratio decreased to 5.5% from 5.6%. The loan coverage ratio was maintained at 83.5% in 9M2018 compared to 91.6% a year ago. (QNBFS Research, QSE, Peninsula Qatar) KCBK posts flat YoY bottom-line (drops 19.2% QoQ) in 3Q2018, misses our estimates on weaker than expected revenue – Al
- 3. Page 3 of 7 Khalij Commercial Bank's (KCBK) net profit remained flat YoY (but declined 19.2% on QoQ basis) to QR134.1mn in 3Q2018, missing our estimate of QR162.0mn due to weaker than expected revenue. The flat performance was due to a 51.1% drop in provisions vs. 20.6% drop in net operating income. Net interest income decreased 13.9% YoY and 6.2% QoQ in 3Q2018 to QR219.2mn. EPS amounted to QR0.37 in 3Q2018 as compared to QR0.37 in 3Q2017 and QR0.46 in 2Q2018. The bank's total assets stood at QR53.6bn at the end of September 30, 2018, down 7.6% YoY (-3.7% QoQ). Gross loans declined by 4.4% QoQ (-4.0% YTD) to QR34.5bn, while deposits dropped by 5.1% QoQ (3.3% YTD) to QR31.6bn. In 9M2018, KCBK’s net profit rose 3.5% YoY to QR469.4mn on the back of effective margin management, cost control and lower impairments. “KCBK has delivered consistent growth in profitability, by maintaining focus on delivering our Qatar-centric medium- term strategy. These results reflect our commitment to our strategy, which is being delivered on the foundations of a strong capital base and excellent liquidity,” KCBK’s Chairman and Managing Director, Sheikh Hamad bin Faisal bin Thani Al- Thani said. Net fee and commission income was QR154.4mn, an increase of 2% YoY, he said, adding operating expenses stood at QR247mn, showing an improvement of 3.4% over the year-ago period. “These results embody selective growth, continued focus on our domestic market in Qatar and at the same time managing our cost base effectively,” KCBK’s CEO, Fahad Al-Khalifa said. The bank continues to focus on maintaining an efficient cost base, and consistent with earlier quarters, its costs are 3.4% lower YoY. Its cost-income ratio was at 27.8% in 9M2018 compared to 27.4% in the corresponding period of 2017. “We remain focused on credit quality across the group, and we continue to remain prudent in our provisioning. The bank’s non-performing loans ratio was at 1.94% at the end of September 30, 2018. (QNBFS Research, QSE, Gulf-Times.com) QATI reports net profit of QR67.1mn in 3Q2018 – Qatar Insurance Company (QATI) reported net profit of QR67.1mn in 3Q2018 as compared to net loss of QR200.8mn in 3Q2017 and net profit of QR154.3mn in 2Q2018. The company's net earned premiums came in at QR2,598.6mn in 3Q2018, which represents an increase of 14.0% YoY. However, on QoQ basis, net earned premiums fell 6.1%. EPS amounted to QR1.16 in 9M2018 as compared to QR0.95 in 9M2017. In 9M2018, QATI reported a 6% YoY growth in gross written premiums (GWP) to QR9.5bn. QATI’s international subsidiaries in Bermuda, the UK and Malta accounted for about 76% of the group’s total GWP. The group’s net underwriting result improved to QR378mn from -QR103mn for the same period last year, the third quarter of which saw the devastating series of major hurricanes (Harvey, Irma, Maria). QATI diligently applies its recently adopted strengthened reserving governance and philosophy, resulting in a more cautious view on market projections. The group is constantly expanding its low severity high frequency business, which now constitutes a significant portion of the total portfolio. Net investment income stood at QR615.0mn for the first nine months of 2018 against QR798.5mn in the year- ago period. QATI improved its already exceptional operational efficiency as its administrative expense ratio for its core operations stood at 6.5%, down from 6.6% in the same period of the previous year. (QSE, Gulf-Times.com) GWCS posts 10.6% YoY increase but 2.5% QoQ decline in net profit in 3Q2018, in-line with our estimate; maintain Outperform – Gulf Warehousing Company's (GWCS) net profit rose 10.6% YoY (but declined 2.5% on QoQ basis) to QR57.5mn in 3Q2018, in line with our estimate of QR57.5mn. The company's revenue came in at QR298.8mn in 3Q2018, which represents an increase of 24.4% YoY. However, on QoQ basis, revenue fell 3.8%. EPS amounted to QR0.98 in 3Q2018 as compared to QR0.89 in 3Q2017 and QR1.01 in 2Q2018. In 9M2018, GWCS posted net profit of QR173.2mn, up 10.1% YoY. Revenue totaled QR 920.8mn for 9M2018 vs. QR695.1mn in 9M2017. Overall results are in-line with our estimates and we maintain our Outperform rating. (QNBFS Research, QSE, Gulf- Times.com) VFQS reports QR26.7mn net profit in 3Q2018, misses our estimate; Maintain Market Perform – Vodafone Qatar (VFQS) reported net profit of QR26.7mn in 3Q2018, missing our estimate of QR32.1mn. The company had reported net loss of QR96.4mn in 3Q2017 and net profit of QR31.2mn in 2Q2018. The company's revenue came in at QR483.6mn in 3Q2018 vs. our estimate of QR514.0mn (divergence of -5.9%). Reported revenue represents an increase of 12.6% YoY. However, on QoQ basis, revenue fell 6.9%. EPS amounted to QR0.09 in 9M2018 as compared to loss per share of QR0.27 in 9M2017. VFQS reported net profit of QR75.4mn in nine months up to September, which represents an increase of QR303.2mn compared to the same period last year. VFQS stated it continued to deliver improvements in its financial and operational performance with postpaid and fixed growth segments driving increase in service revenues, while the company’s cost optimization program enhanced profitability. Total revenue for the nine months ended September 30, 2018 grew by 4.9% YoY to reach QR1.53bn, driven by a growth in postpaid subscribers, corporate Internet connections, and handset sales. Earnings before interest, taxes, depreciation, and amortization (EBITDA) increased by 15.8% YoY to QR425.5mn for 9M2018 on higher revenue and lower costs as a result of the cost optimization program. Consequently, the EBITDA margin improved by 2.6 percentage points to reach 28%, the company stated. Postpaid customers at September 30, 2018 grew by 24% YoY. This, together with higher service revenue, resulted in average revenue per user (ARPU) increasing by QR12 YoY to reach QR103. (QNBFS Research, Gulf-Times.com) QCFS' net profit declines 21.4% YoY and 36.8% QoQ in 3Q2018 – Qatar Cinema and Film Distribution Company's (QCFS) net profit declined 21.4% YoY (-36.8% QoQ) to QR1.4mn in 3Q2018. In 9M2018, QCFS reported net profit of QR6.3mn as compared to QR7.5mn in 9M2017. EPS declined to QR1.01 in 9M2018 from QR1.20 in 9M2017. (QSE) MRDS posts 41.6% YoY increase but 73.7% QoQ decline in net profit in 3Q2018 – Mazaya Qatar Real Estate Development's (MRDS) net profit rose 41.6% YoY (but declined 73.7% on QoQ basis) to QR5.9mn in 3Q2018. In 9M2018, MRDS reported net profit of QR22.1mn as compared to QR17.6mn in 9M2017. EPS rose to QR0.191 in 9M2018 from QR0.152 in 9M2017. (QSE)
- 4. Page 4 of 7 Qatar Stock Exchange Top Gainers Top Decliners Source: Qatar Stock Exchange (QSE) Source: Qatar Stock Exchange (QSE) Most Active Shares by Value (QR Million) Most Active Shares by Volume (Million) Source: Qatar Stock Exchange (QSE) Source: Qatar Stock Exchange (QSE) Investor Trading Percentage to Total Value Traded Net Traded Value by Nationality (QR Million) Source: Qatar Stock Exchange (QSE) Source: Qatar Stock Exchange (QSE) 5.0% 4.4% 3.1% 2.5% 2.5% 0.0% 2.0% 4.0% 6.0% Qatar Navigation Qatar National Cement Company The Commercial Bank QNB Group Qatar International Islamic Bank -7.8% -7.5% -5.1% -4.5% -3.6% -9.0% -6.0% -3.0% 0.0% Qatar FirstBank WidamFood Company QatarOman InvestmentCo. Dlala Brokerage & Inv. HoldingCo. Al KhaleejTakaful Insurance Co. 189.8 90.9 67.8 55.3 49.1 0.0 80.0 160.0 240.0 QNB Group Industries Qatar Qatar Gas Transport Co. Ltd. Qatar Islamic Bank Masraf Al Rayan 5.1 3.8 3.4 3.3 2.1 0.0 2.0 4.0 6.0 Mazaya Qatar Real Estate Dev. Qatar Gas Transport Co. Ltd. Vodafone Qatar Qatar First Bank Ezdan Holding Group 0% 20% 40% 60% 80% 100% Buy Sell 24.90% 39.67% 18.52% 18.25%11.45% 11.07% 45.14% 31.00% Qatari Individuals Qatari Institutions Non-Qatari Individuals Non-Qatari Institutions 414 539 552 401 (138) 138 (200) (100) - 100 200 300 400 500 600 Qatari Non-Qatari Net Investment Total Sold Total Bought
- 5. Page 5 of 7 TECHNICAL ANALYSIS OF THE QSE INDEX Source: Bloomberg The General Index remained above the 10,000 level; but closed at 10,153.36, down only 0.39% from last week. In our last-week’s outlook, we expected the Index to see possible resistance around the 38.2% Fibonacci retracement from the bearish move which has started back in 2014; that correction may have started. Corrections on the uptrend are expected but the good news is that the trend is up; dips can be used for accumulations. Our next resistance level is at 11,000 points and the weekly support remains at the 9,200 level. DEFINITIONS OF KEY TERMS USED IN TECHNICAL ANALYSIS RSI (Relative Strength Index) indicator – RSI is a momentum oscillator that measures the speed and change of price movements. The RSI oscillates between 0 to 100. The index is deemed to be overbought once the RSI approaches the 70 level, indicating that a correction is likely. On the other hand, if the RSI approaches 30, it is an indication that the index may be getting oversold and therefore likely to bounce back. MACD (Moving Average Convergence Divergence) indicator – The indicator consists of the MACD line and a signal line. The divergence or the convergence of the MACD line with the signal line indicates the strength in the momentum during the uptrend or downtrend, as the case may be. When the MACD crosses the signal line from below and trades above it, it gives a positive indication. The reverse is the situation for a bearish trend. Candlestick chart – A candlestick chart is a price chart that displays the high, low, open, and close for a security. The ‘body’ of the chart is portion between the open and close price, while the high and low intraday movements form the ‘shadow’. The candlestick may represent any time frame. We use a one-day candlestick chart (every candlestick represents one trading day) in our analysis. Doji candlestick pattern – A Doji candlestick is formed when a security's open and close are practically equal. The pattern indicates indecisiveness, and based on preceding price actions and future confirmation, may indicate a bullish or bearish trend reversal. Shooting Star/Inverted Hammer candlestick patterns – These candlestick patterns have a small real body (open price and close price are near to each other), and a long upper shadow (large intraday movement on the upside). The Shooting Star is a bearish reversal pattern that forms after a rally. The Inverted Hammer looks exactly like a Shooting Star, but forms after a downtrend. Inverted Hammers represent a potential bullish trend reversal.
- 6. Page 6 of 7 Source: Bloomberg Company Name Price October 25 % Change WTD % Change YTD Market Cap. QR Million TTM P/E P/B Div. Yield Qatar National Bank 188.02 2.51 49.21 173,663 13.5 2.6 3.2 Qatar Islamic Bank 144.00 0.57 48.45 34,026 14.0 2.2 3.5 Commercial Bank of Qatar 41.55 3.10 43.77 16,816 12.3 1.1 2.4 Doha Bank 21.29 (2.70) (25.30) 6,601 11.4 0.7 14.1 Al Ahli Bank 31.00 0.00 (16.52) 6,521 9.8 1.2 3.1 Qatar International Islamic Bank 60.69 2.48 11.15 9,187 10.6 1.6 6.6 Masraf Al Rayan 37.45 (0.13) (0.79) 28,088 13.4 2.2 5.3 Al Khalij Commercial Bank 11.10 (1.33) (21.83) 3,996 7.8 0.7 6.8 Qatar First Bank 4.39 (7.77) (32.77) 878 N/A 0.8 N/A National Leasing 8.60 (3.37) (19.70) 426 15.2 0.4 5.8 Dlala Holding 10.70 (4.46) (27.21) 304 N/A 1.4 N/A Qatar & Oman Investment 5.92 (5.13) (25.06) 186 44.0 0.6 8.4 Islamic Holding Group 24.55 (1.13) (34.53) 139 N/A 1.0 N/A Banking and Financial Services 280,831 Zad Holding 99.00 (1.00) 34.44 1,425 12.1 1.6 6.0 Qatar German Co. for Medical Devices 4.74 (2.07) (26.63) 55 N/A 1.1 N/A Salam International Investment 4.99 (0.20) (27.58) 570 N/A 0.4 N/A Medicare Group 64.64 0.39 (7.46) 1,819 21.5 1.9 2.8 Qatar Cinema & Film Distribution 16.53 0.00 (33.88) 104 15.5 0.7 6.0 Qatar Fuel 171.52 (3.59) 68.06 17,053 15.6 2.5 4.7 Widam Food Co. 68.43 (7.53) 9.49 1,232 11.5 3.8 6.2 Mannai Corp. 58.30 (2.82) (2.02) 2,660 5.2 1.0 6.9 Al Meera Consumer Goods 152.99 (0.97) 5.58 3,060 16.5 2.3 5.6 Consumer Goods and Services 27,977 Qatar Industrial Manufacturing 41.56 0.12 (4.90) 1,975 9.8 12.9 7.2 Qatar National Cement 60.55 4.40 (3.74) 3,957 13.1 1.3 7.4 Industries Qatar 139.50 (2.45) 43.81 84,398 17.6 2.4 3.6 Qatari Investors Group 29.23 (1.58) (20.14) 3,634 15.4 1.3 2.6 Qatar Electricity and Water 186.00 (2.10) 4.49 20,460 14.0 2.0 4.2 Aamal 9.59 (0.83) 10.48 6,042 12.4 0.8 6.3 Gulf International Services 20.06 (2.62) 13.33 3,728 36.1 1.0 N/A Mesaieed Petrochemical Holding 16.91 0.06 34.31 21,244 16.6 1.5 4.1 Invesment Holding Group 5.35 (0.56) (12.30) 444 10.4 0.5 4.7 Industrials 145,882 Qatar Insurance 36.22 (2.45) (19.91) 11,551 23.3 1.5 3.6 Doha Insurance 12.55 (3.46) (10.36) 628 14.5 0.6 6.0 Qatar General Insurance & Reinsurance 48.00 0.00 (2.04) 4,200 13.0 0.7 4.6 Al Khaleej Takaful Insurance 9.00 (3.64) (32.02) 230 37.3 0.5 5.6 Qatar Islamic Insurance 53.49 1.69 (2.69) 802 11.6 2.3 6.5 Insurance 17,411 United Development 14.02 0.21 (2.50) 4,964 10.2 0.5 8.9 Barw a Real Estate 36.99 (1.07) 15.59 14,394 9.0 0.8 6.8 Ezdan Real Estate 10.72 2.29 (11.26) 28,435 29.1 0.9 N/A Mazaya Qatar Real Estate Development 7.60 1.33 (15.56) 880 27.0 0.6 N/A Real Estate 48,673 Ooredoo 67.00 (3.30) (26.17) 21,461 13.8 1.0 5.2 Vodafone Qatar 8.40 (3.23) 4.74 7,101 10526.3 1.6 N/A Telecoms 28,563 Qatar Navigation (Milaha) 75.00 5.04 34.07 8,589 17.0 0.6 4.7 Gulf Warehousing 40.81 0.62 (7.23) 2,392 10.3 1.4 4.2 Qatar Gas Transport (Nakilat) 17.70 (0.06) 9.94 9,806 11.1 1.6 5.6 Transportation 20,787 Qatar Exchange 570,123
- 7. Contacts Saugata Sarkar, CFA, CAIA Shahan Keushgerian Zaid al-Nafoosi , CMT, CFTe Head of Research Senior Research Analyst Senior Research Analyst Tel: (+974) 4476 6534 Tel: (+974) 4476 6509 Tel: (+974) 4476 6535 saugata.sarkar@qnbfs.com.qa shahan.keushgerian@qnbfs.com.qa zaid.alnafoosi@qnbfs.com.qa QNB Financial Services Co. W.L.L. Contact Center: (+974) 4476 6666 PO Box 24025 Doha, Qatar Disclaimer and Copyright Notice: This publication has been prepared by QNB Financial Services Co. W.L.L. (“QNBFS”) a wholly-owned subsidiary of Qatar National Bank (Q.P.S.C.). QNBFS is regulated by the Qatar Financial Markets Authority and the Qatar Exchange. Qatar National Bank (Q.P.S.C.) is regulated by the Qatar Central Bank. This publication expresses the views and opinions of QNBFS at a given time only. It is not an offer, promotion or recommendation to buy or sell securities or other investments, nor is it intended to constitute legal, tax, accounting, or financial advice. QNBFS accepts no liability whatsoever for any direct or indirect losses arising from use of this report. Any investment decision should depend on the individual circumstances of the investor and be based on specifically engaged investment advice. We therefore strongly advise potential investors to seek independent professional advice before making any investment decision. Although the information in this report has been obtained from sources that QNBFS believes to be reliable, we have not independently verified such information and it may not be accurate or complete. QNBFS does not make any representations or warranties as to the accuracy and completeness of the information it may contain, and declines any liability in that respect. For reports dealing with Technical Analysis, expressed opinions and/or recommendations may be different or contrary to the opinions/recommendations of QNBFS Fundamental Research as a result of depending solely on the historical technical data (price and volume). QNBFS reserves the right to amend the views and opinions expressed in this publication at any time. It may also express viewpoints or make investment decisions that differ significantly from, or even contradict, the views and opinions included in this report. This report may not be reproduced in whole or in part without permission from QNBFS COPYRIGHT: No part of this document may be reproduced without the explicit written permission of QNBFS. Page 7 of 7