QNBFS Weekly Market Report November 29, 2018
•
0 gefällt mir•16 views

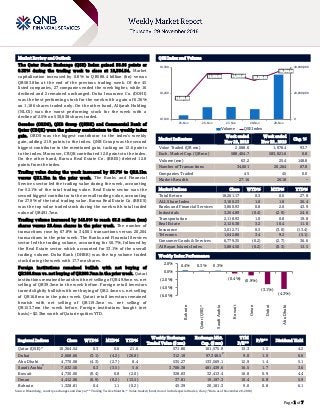
The Qatar Stock Exchange (QSE) Index gained 36.06 points or 0.35% during the trading week to close at 10,364.54

Empfohlen
Empfohlen
Weitere ähnliche Inhalte
Mehr von QNB Group
Mehr von QNB Group (20)
Kürzlich hochgeladen
Kürzlich hochgeladen (20)
QNBFS Weekly Market Report November 29, 2018
- 1. ` Page 1 of 7 Market Review and Outlook QSE Index and Volume The Qatar Stock Exchange (QSE) Index gained 36.06 points or 0.35% during the trading week to close at 10,364.54. Market capitalization increased by 0.8% to QR588.4 billion (bn) versus QR583.8bn at the end of the previous trading week. Of the 45 listed companies, 27 companies ended the week higher, while 16 declined and 2 remained unchanged. Doha Insurance Co. (DOHI) was the best performing stock for the week with a gain of 6.36% on 1,186 shares traded only. On the other hand, Alijarah Holding (NLCS) was the worst performing stock for the week with a decline of 2.5% on 530,638 shares traded. Ooredoo (ORDS), QNB Group (QNBK) and Commercial Bank of Qatar (CBQK) were the primary contributors to the weekly index gain. ORDS was the biggest contributor to the index’s weekly gain, adding 21.9 points to the index. QNB Group was the second biggest contributor to the mentioned gain, tacking on 12.6 points to the index. Moreover, CBQK contributed 12.0 points to the index. On the other hand, Barwa Real Estate Co. (BRES) deleted 12.8 points from the index. Trading value during the week increased by 93.7% to QR2.1bn versus QR1.1bn in the prior week. The Banks and Financial Services sector led the trading value during the week, accounting for 52.1% of the total trading value. Real Estate sector was the second biggest contributor to the overall trading value, accounting for 27.9% of the total trading value. Barwa Real Estate Co. (BRES) was the top value traded stock during the week with total traded value of QR491.7mn. Trading volume increased by 148.8% to reach 63.2 million (mn) shares versus 25.4mn shares in the prior week. The number of transactions rose by 67.8% to 34,001 transactions versus 20,264 transactions in the prior week. The Banks and Financial Services sector led the trading volume, accounting for 50.7%, followed by the Real Estate sector which accounted for 33.1% of the overall trading volume. Doha Bank (DHBK) was the top volume traded stock during the week with 17.7mn shares. Foreign institutions remained bullish with net buying of QR166.9mn vs. net buying of QR209.7mn in the prior week. Qatari institutions remained bearish with net selling of QR49.9mn vs. net selling of QR39.3mn in the week before. Foreign retail investors turned slightly bullish with net buying of QR2.4mn vs. net selling of QR16.8mn in the prior week. Qatari retail investors remained bearish with net selling of QR119.3mn vs. net selling of QR153.7mn the week before. Foreign institutions bought (net basis) ~$2.3bn worth of Qatari equities YTD. Market Indicators Week ended Nov 29, 2018 Week ended Nov 22 , 2018 Chg. % Value Traded (QR mn) 2,088.6 1,078.4 93.7 Exch. Market Cap. (QR mn) 588,404.7 583,821.6 0.8 Volume (mn) 63.2 25.4 148.8 Number of Transactions 34,001 20,264 67.8 Companies Traded 45 45 0.0 Market Breadth 27:16 26:18 – Market Indices Close WTD% MTD% YTD% Total Return 18,261.17 0.3 0.6 27.8 ALL Share Index 3,100.23 1.0 1.8 26.4 Banks and Financial Services 3,860.93 0.8 2.0 43.9 Industrials 3,264.89 (0.4) (2.9) 24.6 Transportation 2,118.93 1.0 0.8 19.8 Real Estate 2,126.38 3.2 10.4 11.0 Insurance 3,012.71 0.3 (3.0) (13.4) Telecoms 1,042.86 3.4 9.2 (5.1) Consumer Goods & Services 6,779.35 (0.2) (2.7) 36.6 Al Rayan Islamic Index 3,884.50 (0.2) (0.3) 13.5 Market Indices Weekly Index Performance Regional Indices Close WTD% MTD% YTD% Weekly Exchange Traded Value ($ mn) Exchange Mkt. Cap. ($ mn) TTM P/E** P/B** Dividend Yield Qatar (QSE)* 10,364.54 0.3 0.6 21.6 571.86 161,575.9 15.3 1.5 4.2 Dubai 2,668.66 (3.1) (4.2) (20.8) 312.18 97,348.5# 9.0 1.0 6.6 Abu Dhabi 4,770.08 (4.3) (2.7) 8.4 535.27 133,569.1 12.9 1.4 5.1 Saudi Arabia# 7,632.50 0.3 (3.5) 5.6 3,708.38 481,439.6 16.5 1.7 3.6 Kuwait 4,730.00 (0.4) 0.8 (2.0) 328.83 32,413.4 16.8 0.9 4.4 Oman 4,412.06 (0.9) (0.2) (13.5) 37.81 19,197.3 10.4 0.8 5.9 Bahrain 1,328.81 0.4 1.1 (0.2) 45.39 20,181.3 9.0 0.8 6.1 Source: Bloomberg, country exchanges and Zawya (** Trailing Twelve Months; * Value traded ($ mn) do not include special trades, if any; # Data as of November 28, 2018) 10,251.62 10,356.62 10,355.67 10,329.61 10,364.54 0 20,000,000 40,000,000 10,180 10,280 10,380 25-Nov 26-Nov 27-Nov 28-Nov 29-Nov Volume QSE Index 0.4% 0.3% 0.3% (0.4%) (0.9%) (3.1%) (4.3%)(6.0%) (4.0%) (2.0%) 0.0% 2.0% Bahrain Qatar(QSE)* SaudiArabia Kuwait Oman Dubai AbuDhabi
- 2. Page 2 of 7 News Economic News FocusEconomics: Qatar’s GDP to exceed $220bn by 2023 – Qatar’s GDP is expected to exceed $220bn by 2023, according to a report by FocusEconomics. By year-end, Qatar’s GDP will total $172bn, FocusEconomics noted in its latest country report. The country’s GDP per capita in Dollar terms will account for $77,422 in 2023 compared with $61,963 by end- 2018, it stated. Qatar’s economic growth in terms of nominal GDP will reach 5% in 2023 from 3.1% by the year-end. The report showed that Qatar’s international reserves will total $35.5bn in 2023 compared with $25.9bn this year. This, according to FocusEconomics, will cover 8.2 months of imports in place of 9.4 months this year. Qatar’s fiscal balance (as a percentage of the country’s GDP) will be 4.8% in 2023 compared to -0.3% this year. The country’s public debt (as a percentage of GDP) is expected to fall to 43.2% in 2023 in place of 53.4% in end-2018. Qatar’s public debt will fall gradually until 2023, the report noted. Next year, it will be 50.6% (as a percentage of the country’s GDP) and in the following years, it will be 47.5% (2020), 47.5% (2021) and 45.4% (2022). The current account balance (as a percentage of the country’s GDP) will be 8.2% in 2023 compared with 8.1% in 2018. (Gulf- Times.com) Qatar to open up more sectors for 100% foreign ownership – Qatar is set to further expand its investment ecosystem allowing foreign investors for 100% ownership in more sectors. Opening the Qatar-France Business and Investment Forum yesterday, Ministry of Commerce and Industry’s Assistant Undersecretary for Commerce Affairs, Yahya bin Saeed Al Nuaimi said the country is working towards the issuance of a new investment law that will represent an important step in the journey to attract foreign investors. The Forum, which was organized by the French Embassy in Doha, in partnership with the Ministry of Commerce and Industry, the Qatar Businessmen Association and Qatar Financial Centre (QFC), kicked off yesterday. The forum aims at enhancing economic, trade and investment cooperation between Qatar and France and building communication channels between representatives of the Qatari and French private sectors to establish joint investment projects that serve the interests of both countries. (Peninsula Qatar) QCB’s Governor: Blockade was like a real stress test for the economy – Qatar Central Bank’s (QCB) Governor, HE Sheikh Abdulla bin Saoud Al Thani has said the blockade imposed on Qatar was like a real stress test for the economy. The resilience of the Qatari economy and the strong confidence of the investors were realized during the blockade. Speaking to The Euromoney, ahead of The Euromoney Qatar Conference in December, the QCB Governor said 10 years since the financial crisis, the global economy appeared to have moved out of the danger zone, even though downside risk still exists. (Peninsula Qatar) QNB Group: Qatar’s foreign exchange reserves rose 1.7% MoM to $46.5bn in September – Qatar’s foreign exchange reserves gained 1.7% MoM to reach $46.5bn in September, QNB Group noted in its latest ‘Qatar Monthly Monitor’. The Qatar Central Bank’s foreign exchange reserves at end-September equated to seven months of import cover, QNB Group stated. According to QNB Group, Qatari banks’ asset growth was 5% YoY in October. Bank deposit growth was 1.5% YoY, while credit growth was 2.7% in October. Private sector deposits grew 1.2% MoM in October, while the public sector and non-resident deposits declined 4.5% and 1.7%, respectively. Inter-bank rates went slightly up in September following global monetary tightening, QNB Group noted. Qatar Inter-bank Offered Rates (QIBOR) and London Inter-bank Offered Rate (LIBOR) three- month interest rates converged further, it stated. Qatari Sovereign five-year credit default swap (CDS) spreads remained stable at around 75 bps. Qatar’s fiscal account surplus widened to 3.5% of GDP in the second quarter (2Q2018) due to higher oil prices. In 2Q2018, the country’s current account surplus ‘widened’, while net capital and financial flows were ‘positive’. Exports grew 30.2% YoY in September as a result of higher oil prices, while imports grew 37.0%, QNB Group stated. (Gulf-Times.com) IEA: Global LNG trade projected to grow double in size by 2030 – Natural gas is set to become the second-largest fuel in the global energy mix, overtaking coal in 2030. Industrial consumers are expected to make the largest contribution to a 45% increase in worldwide gas use. Trade in liquefied natural gas (LNG) is expected to more than double in response to rising demand from developing economies, led by China. The ‘World Energy Outlook 2018’ released by International Energy Agency (IEA) noted the movement towards a more interconnected global gas market, as a result of growing trade in LNG, will intensify competition among suppliers while changing the way that countries need to think about managing potential shortfalls in supply. In the new policies scenario, rising incomes and an extra 1.7bn people, mostly added to urban areas in developing economies, will push up global energy demand by more than a quarter to 2040. The increase would be around twice as large if it were not for continued improvements in energy efficiency, a powerful policy tool to address energy security and sustainability concerns. All the growth is expected to come from developing economies, led by India. (Peninsula Qatar) QTerminals gets approval for Phase II expansion of Hamad Port – QTerminals announced that it has received approval to design, develop and operate Phase II (Container Terminal 2) of Hamad Port. The announcement comes as a major boost for the expansion of Hamad Port, which has become Qatar’s gateway to the world trade in a short span of time. QTerminals is a terminal operating company jointly established by Qatar Ports Management Company (Mwani) and Qatar Navigation (Milaha). The company provides container, general cargo, RORO (roll-on rolloff), livestock and offshore supply services in Phase 1 of Hamad Port. (Peninsula Qatar) Qatar Airways expands operations in Iran with new routes, more flights – Qatar Airways announced that it will expand its operations in Iran with the launch of a new twice-weekly direct service to Isfahan International Airport from February 4, 2019, as well as introducing increased services to Shiraz and Tehran, from early January 2019. (Gulf-Times.com)
- 3. Page 3 of 7 Qatar Stock Exchange Top Gainers Top Decliners Source: Qatar Stock Exchange (QSE) Source: Qatar Stock Exchange (QSE) Most Active Shares by Value (QR Million) Most Active Shares by Volume (Million) Source: Qatar Stock Exchange (QSE) Source: Qatar Stock Exchange (QSE) Investor Trading Percentage to Total Value Traded Net Traded Value by Nationality (QR Million) Source: Qatar Stock Exchange (QSE) Source: Qatar Stock Exchange (QSE) 6.4% 6.3% 5.5% 5.5% 4.9% 0.0% 2.2% 4.4% 6.6% Doha Insurance Group Ezdan Holding Group Salam International Inv. Ltd. Doha Bank Ooredoo -2.5% -2.2% -2.0% -1.8% -1.8% -3.0% -2.0% -1.0% 0.0% AlijarahHolding BarwaReal Estate Company QatarElectricity& WaterCo. The Group Islamic Insurance Co. Mesaieed Petrochemical HoldingCo. 491.7 375.3 327.6 200.8 92.4 0.0 170.0 340.0 510.0 Barwa Real Estate Company Doha Bank QNB Group Masraf Al Rayan Qatar Islamic Bank 17.7 12.7 5.0 4.7 3.4 0.0 7.0 14.0 21.0 Doha Bank Barwa Real Estate Company Masraf Al Rayan Qatar First Bank Mazaya Qatar Real Estate Dev. 0% 20% 40% 60% 80% 100% Buy Sell 14.62% 24.81% 10.15% 14.41% 5.00% 4.80% 70.23% 55.98% Qatari Individuals Qatari Institutions Non-Qatari Individuals Non-Qatari Institutions 517 1,571 819 1,269 (302) 302 (500) - 500 1,000 1,500 2,000 Qatari Non-Qatari Net Investment Total Sold Total Bought
- 4. Page 4 of 7 TECHNICAL ANALYSIS OF THE QSE INDEX Source: Bloomberg The General Index closed slightly up by 0.35% from last week and closed at 10,364.54. The index has been creating a rising-wedge price formation, which is a bearish reversal formation (if breached downwards). We keep our expected weekly support level to 9,600 points the resistance at the 11,000 level. DEFINITIONS OF KEY TERMS USED IN TECHNICAL ANALYSIS RSI (Relative Strength Index) indicator – RSI is a momentum oscillator that measures the speed and change of price movements. The RSI oscillates between 0 to 100. The index is deemed to be overbought once the RSI approaches the 70 level, indicating that a correction is likely. On the other hand, if the RSI approaches 30, it is an indication that the index may be getting oversold and therefore likely to bounce back. MACD (Moving Average Convergence Divergence) indicator – The indicator consists of the MACD line and a signal line. The divergence or the convergence of the MACD line with the signal line indicates the strength in the momentum during the uptrend or downtrend, as the case may be. When the MACD crosses the signal line from below and trades above it, it gives a positive indication. The reverse is the situation for a bearish trend. Candlestick chart – A candlestick chart is a price chart that displays the high, low, open, and close for a security. The ‘body’ of the chart is portion between the open and close price, while the high and low intraday movements form the ‘shadow’. The candlestick may represent any time frame. We use a one-day candlestick chart (every candlestick represents one trading day) in our analysis. Doji candlestick pattern – A Doji candlestick is formed when a security's open and close are practically equal. The pattern indicates indecisiveness, and based on preceding price actions and future confirmation, may indicate a bullish or bearish trend reversal. Shooting Star/Inverted Hammer candlestick patterns – These candlestick patterns have a small real body (open price and close price are near to each other), and a long upper shadow (large intraday movement on the upside). The Shooting Star is a bearish reversal pattern that forms after a rally. The Inverted Hammer looks exactly like a Shooting Star, but forms after a downtrend. Inverted Hammers represent a potential bullish trend reversal.
- 5. Page 5 of 7 Source: Bloomberg Company Name Price November 29 % Change WTD % Change YTD Market Cap. QR Million TTM P/E P/B Div. Yield Qatar National Bank 199.50 0.76 58.32 184,267 14.3 2.8 3.0 Qatar Islamic Bank 151.90 (0.06) 56.60 35,893 14.7 2.4 3.3 Commercial Bank of Qatar 42.20 2.30 46.02 17,079 12.5 1.1 2.4 Doha Bank 21.41 5.47 (24.88) 6,638 11.5 0.7 14.0 Al Ahli Bank 30.00 0.00 (19.21) 6,311 9.5 1.2 3.2 Qatar International Islamic Bank 63.60 (0.58) 16.48 9,627 11.1 1.7 6.3 Masraf Al Rayan 40.09 0.88 6.20 30,068 14.3 2.3 5.0 Al Khalij Commercial Bank 11.13 0.72 (21.62) 4,007 7.9 0.7 6.7 Qatar First Bank 4.29 0.94 (34.30) 858 N/A 0.8 N/A National Leasing 8.56 (2.51) (20.07) 424 15.1 0.4 5.8 Dlala Holding 10.30 1.98 (29.93) 293 N/A 1.4 N/A Qatar & Oman Investment 5.95 0.34 (24.68) 187 45.0 0.7 8.4 Islamic Holding Group 22.73 0.09 (39.39) 129 N/A 0.9 N/A Banking and Financial Services 295,780 Zad Holding 100.00 1.01 35.80 1,439 12.2 1.6 5.9 Qatar German Co. for Medical Devices 4.45 1.14 (31.11) 51 N/A 1.1 N/A Salam International Investment 4.57 5.54 (33.67) 522 N/A 0.4 N/A Medicare Group 63.50 0.47 (9.09) 1,787 21.1 1.9 2.8 Qatar Cinema & Film Distribution 21.56 (0.96) (13.76) 135 20.2 1.0 4.6 Qatar Fuel 166.03 (0.76) 62.68 16,508 14.4 2.3 4.8 Widam Food Co. 67.97 (0.70) 8.75 1,223 11.4 3.8 6.3 Mannai Corp. 57.98 (0.02) (2.55) 2,645 5.9 1.0 6.9 Al Meera Consumer Goods 149.00 0.68 2.83 2,980 16.7 2.2 5.7 Consumer Goods and Services 27,291 Qatar Industrial Manufacturing 43.50 0.69 (0.46) 2,067 9.7 1.3 6.9 Qatar National Cement 57.00 (0.02) (9.38) 3,725 12.3 1.2 7.9 Industries Qatar 135.50 (0.37) 39.69 81,978 17.1 2.3 3.7 Qatari Investors Group 29.07 0.97 (20.57) 3,614 15.3 1.3 2.6 Qatar Electricity and Water 180.00 (1.96) 1.12 19,800 13.5 1.9 4.3 Aamal 9.24 2.44 6.45 5,821 12.1 0.7 6.5 Gulf International Services 18.36 0.60 3.73 3,412 33.4 0.9 N/A Mesaieed Petrochemical Holding 16.11 (1.83) 27.96 20,239 15.5 1.4 4.3 Invesment Holding Group 5.30 (0.93) (13.11) 440 10.6 0.5 4.7 Industrials 141,096 Qatar Insurance 35.83 (0.83) (20.78) 11,426 23.1 1.5 3.6 Doha Insurance 13.38 6.36 (4.43) 669 15.6 0.6 5.6 Qatar General Insurance & Reinsurance 45.39 3.04 (7.37) 3,972 11.6 0.6 4.9 Al Khaleej Takaful Insurance 8.28 0.98 (37.46) 211 29.1 0.4 6.0 Qatar Islamic Insurance 53.45 (1.84) (2.77) 802 11.6 2.3 6.5 Insurance 17,080 United Development 14.10 0.00 (1.95) 4,993 10.2 0.5 8.9 Barw a Real Estate 38.22 (2.20) 19.44 14,872 9.5 0.8 6.5 Ezdan Real Estate 12.73 6.26 5.38 33,766 44.2 1.1 N/A Mazaya Qatar Real Estate Development 7.76 2.51 (13.78) 898 27.6 0.6 N/A Real Estate 54,530 Ooredoo 78.99 4.90 (12.96) 25,302 16.9 1.2 4.4 Vodafone Qatar 8.28 0.98 3.24 7,000 10375.9 1.5 N/A Telecoms 32,302 Qatar Navigation (Milaha) 69.00 1.31 23.35 7,902 15.5 0.5 5.1 Gulf Warehousing 40.87 (0.32) (7.09) 2,395 10.3 1.4 4.2 Qatar Gas Transport (Nakilat) 18.10 1.12 12.42 10,028 11.2 1.5 5.5 Transportation 20,325 Qatar Exchange 588,405
- 6. Contacts Saugata Sarkar, CFA, CAIA Shahan Keushgerian Zaid al-Nafoosi , CMT, CFTe Head of Research Senior Research Analyst Senior Research Analyst Tel: (+974) 4476 6534 Tel: (+974) 4476 6509 Tel: (+974) 4476 6535 saugata.sarkar@qnbfs.com.qa shahan.keushgerian@qnbfs.com.qa zaid.alnafoosi@qnbfs.com.qa QNB Financial Services Co. W.L.L. Contact Center: (+974) 4476 6666 PO Box 24025 Doha, Qatar Disclaimer and Copyright Notice: This publication has been prepared by QNB Financial Services Co. W.L.L. (“QNBFS”) a wholly-owned subsidiary of Qatar National Bank (Q.P.S.C.). QNBFS is regulated by the Qatar Financial Markets Authority and the Qatar Exchange. Qatar National Bank (Q.P.S.C.) is regulated by the Qatar Central Bank. This publication expresses the views and opinions of QNBFS at a given time only. It is not an offer, promotion or recommendation to buy or sell securities or other investments, nor is it intended to constitute legal, tax, accounting, or financial advice. QNBFS accepts no liability whatsoever for any direct or indirect losses arising from use of this report. Any investment decision should depend on the individual circumstances of the investor and be based on specifically engaged investment advice. We therefore strongly advise potential investors to seek independent professional advice before making any investment decision. Although the information in this report has been obtained from sources that QNBFS believes to be reliable, we have not independently verified such information and it may not be accurate or complete. QNBFS does not make any representations or warranties as to the accuracy and completeness of the information it may contain, and declines any liability in that respect. For reports dealing with Technical Analysis, expressed opinions and/or recommendations may be different or contrary to the opinions/recommendations of QNBFS Fundamental Research as a result of depending solely on the historical technical data (price and volume). QNBFS reserves the right to amend the views and opinions expressed in this publication at any time. It may also express viewpoints or make investment decisions that differ significantly from, or even contradict, the views and opinions included in this report. This report may not be reproduced in whole or in part without permission from QNBFS COPYRIGHT: No part of this document may be reproduced without the explicit written permission of QNBFS. Page 6 of 7
- 7. Contacts Saugata Sarkar, CFA, CAIA Shahan Keushgerian Zaid al-Nafoosi , CMT, CFTe Head of Research Senior Research Analyst Senior Research Analyst Tel: (+974) 4476 6534 Tel: (+974) 4476 6509 Tel: (+974) 4476 6535 saugata.sarkar@qnbfs.com.qa shahan.keushgerian@qnbfs.com.qa zaid.alnafoosi@qnbfs.com.qa QNB Financial Services Co. W.L.L. Contact Center: (+974) 4476 6666 PO Box 24025 Doha, Qatar Disclaimer and Copyright Notice: This publication has been prepared by QNB Financial Services Co. W.L.L. (“QNBFS”) a wholly-owned subsidiary of Qatar National Bank (Q.P.S.C.). QNBFS is regulated by the Qatar Financial Markets Authority and the Qatar Exchange. Qatar National Bank (Q.P.S.C.) is regulated by the Qatar Central Bank. This publication expresses the views and opinions of QNBFS at a given time only. It is not an offer, promotion or recommendation to buy or sell securities or other investments, nor is it intended to constitute legal, tax, accounting, or financial advice. QNBFS accepts no liability whatsoever for any direct or indirect losses arising from use of this report. Any investment decision should depend on the individual circumstances of the investor and be based on specifically engaged investment advice. We therefore strongly advise potential investors to seek independent professional advice before making any investment decision. Although the information in this report has been obtained from sources that QNBFS believes to be reliable, we have not independently verified such information and it may not be accurate or complete. QNBFS does not make any representations or warranties as to the accuracy and completeness of the information it may contain, and declines any liability in that respect. For reports dealing with Technical Analysis, expressed opinions and/or recommendations may be different or contrary to the opinions/recommendations of QNBFS Fundamental Research as a result of depending solely on the historical technical data (price and volume). QNBFS reserves the right to amend the views and opinions expressed in this publication at any time. It may also express viewpoints or make investment decisions that differ significantly from, or even contradict, the views and opinions included in this report. This report may not be reproduced in whole or in part without permission from QNBFS COPYRIGHT: No part of this document may be reproduced without the explicit written permission of QNBFS. Page 7 of 7