QNBFS Weekly Market Report March 23, 2017
•
0 likes•240 views

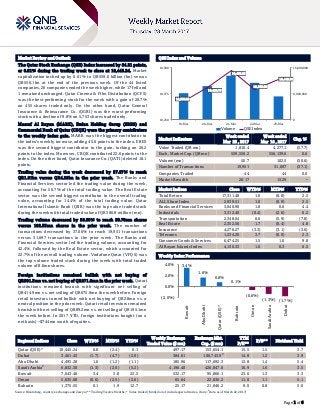
The Qatar Stock Exchange (QSE) Index increased by 84.21 points, or 0.81% during the trading week to close at 10,445.24.

Recommended
Recommended
More Related Content
Viewers also liked
More from QNB Group
More from QNB Group (20)
Recently uploaded
Recently uploaded (20)
QNBFS Weekly Market Report March 23, 2017
- 1. ` Page 1 of 6 Market Review and Outlook QSE Index and Volume The Qatar Stock Exchange (QSE) Index increased by 84.21 points, or 0.81% during the trading week to close at 10,445.24. Market capitalization inched up by 0.61% to QR559.6 billion (bn) versus QR556.1bn at the end of the previous week. Of the 44 listed companies, 26 companies ended the week higher, while 17 fell and 1 remained unchanged. Qatar Cinema & Film Distribution (QCFS) was the best performing stock for the week with a gain of 20.7% on 455 shares traded only. On the other hand, Qatar General Insurance & Reinsurance Co. (QGRI) was the worst performing stock with a decline of 9.8% on 5,753 shares traded only. Masraf Al Rayan (MARK), Ezdan Holding Group (ERES) and Commercial Bank of Qatar (CBQK) were the primary contributors to the weekly index gain. MARK was the biggest contributor to the index’s weekly increase, adding 45.6 points to the index. ERES was the second biggest contributor to the gain, tacking on 26.2 points to the index. Moreover, CBQK contributed 22.6 points to the index. On the other hand, Qatar Insurance Co. (QATI) deleted 18.1 points. Trading value during the week decreased by 57.67% to reach QR1.81bn versus QR4.28bn in the prior week. The Banks and Financial Services sector led the trading value during the week, accounting for 50.7% of the total trading value. The Real Estate sector was the second biggest contributor to the overall trading value, accounting for 14.4% of the total trading value. Qatar International Islamic Bank (QIIK) was the top value traded stock during the week with total traded value of QR386.8 million (mn). Trading volume decreased by 50.55% to reach 50.70mn shares versus 102.53mn shares in the prior week. The number of transactions decreased by 37.06% to reach 19,951 transactions versus 31,697 transactions in the prior week. The Banks and Financial Services sector led the trading volume, accounting for 42.4%, followed by the Real Estate sector, which accounted for 22.7% of the overall trading volume. Vodafone Qatar (VFQS) was the top volume traded stock during the week with total traded volume of 8.6mn shares. Foreign institutions remained bullish with net buying of QR501.3mn vs. net buying of QR871.0mn in the prior week. Qatari institutions remained bearish with significant net selling of QR414.9mn vs. net selling of QR675.9mn the week before. Foreign retail investors turned bullish with net buying of QR2.8mn vs. a neutral position in the prior week. Qatari retail investors remained bearish with net selling of QR89.2mn vs. net selling of QR195.1mn the week before. In 2017 YTD, foreign institutions bought (on a net basis) ~$744mn worth of equities. Market Indicators Week ended Mar 23 , 2017 Week ended Mar 16 , 2017 Chg. % Value Traded (QR mn) 1,810.4 4,277.1 (57.7) Exch. Market Cap. (QR mn) 559,556.2 556,139.6 0.6 Volume (mn) 50.7 102.5 (50.6) Number of Transactions 19,951 31,697 (37.1) Companies Traded 44 44 0.0 Market Breadth 26:17 15:29 – Market Indices Close WTD% MTD% YTD% Total Return 17,311.48 1.0 (0.8) 2.5 ALL Share Index 2,939.51 1.0 (0.9) 2.5 Banks and Financial Services 3,040.90 1.8 0.6 4.4 Industrials 3,312.40 (0.4) (2.6) 0.2 Transportation 2,348.04 0.6 (5.9) (7.8) Real Estate 2,352.56 1.7 (0.4) 4.8 Insurance 4,276.27 (3.3) (3.1) (3.6) Telecoms 1,234.20 3.7 (0.9) 2.3 Consumer Goods & Services 6,474.25 1.5 1.0 9.8 Al Rayan Islamic Index 4,136.33 1.0 0.3 6.5 Market Indices Weekly Index Performance Regional Indices Close WTD% MTD% YTD% Weekly Exchange Traded Value ($ mn) Exchange Mkt. Cap. ($ mn) TTM P/E** P/B** Dividend Yield Qatar (QSE)* 10,445.24 0.8 (2.4) 0.1 497.17 153,654.1 15.5 1.5 3.7 Dubai 3,461.43 (1.7) (4.7) (2.0) 384.61 106,743.9# 14.8 1.2 3.9 Abu Dhabi 4,495.28 1.6 (1.2) (1.1) 185.96 117,692.3 12.8 1.4 5.4 Saudi Arabia# 6,832.30 (1.3) (2.0) (5.2) 4,196.40 426,847.6 16.9 1.6 3.5 Kuwait 7,043.46 3.4 3.8 22.5 532.17 95,866.1 23.6 1.3 3.3 Oman 5,635.08 (0.6) (2.5) (2.6) 65.64 22,636.2 11.0 1.1 5.1 Bahrain 1,375.55 0.1 1.9 12.7 25.17 21,846.2 9.0 0.8 5.0 Source: Bloomberg, country exchanges and Zawya (** Trailing Twelve Months; * Value traded ($ mn) do not include special trades, if any; # Data as of March 22, 2017) 10,338.55 10,406.79 10,485.53 10,395.98 10,445.24 0 8,000,000 16,000,000 10,250 10,375 10,500 19-Mar 20-Mar 21-Mar 22-Mar 23-Mar Volume QSE Index 3.4% 1.6% 0.8% 0.1% (0.6%) (1.3%) (1.7%) (2.0%) 0.0% 2.0% 4.0% Kuwait AbuDhabi Qatar(QSE)* Bahrain Oman SaudiArabia Dubai
- 2. Page 2 of 6 News Economic, Market & Corporate News QCB increased interest rates – Qatar Money Rate Lending (QMRL) rate rose from 4.75% to 5.00% and Qatar Money Rate Deposit (QMRD) rate rose from 1.00% to 1.25%. According to QCB statement, the cash reserve ratio (CRR) was also reduced from 4.75% to 4.50% starting from April 2017. (Qatar Tribune) Qatar Rail awards QR278mn contract to L&T's UAE unit – L&T Electrical & Automation FZE in Jabel Ali, the competency center for Larsen & Toubro's electrical and automation business in the UAE, has won a QR278mn contract from Qatar Rail Company for Phase 1 of Doha Metro. The scope of the order encompasses supply, installation, testing, integration, commissioning and five years' maintenance of a network-wide Building Automation and Control Systems (BACS) for 37 stations, a press release said. (Qatar Tribune) CI affirms QNB Group ratings on par with Qatar’s sovereign and a stable outlook – Capital Intelligence (CI), a global credit rating agency, affirmed QNB Group long and short-term foreign currency ratings (FCRs) at ‘AA-’ and ‘A1+’ respectively, at the same level as the sovereign ratings for Qatar. The bank’s support rating of ‘1’ (affirmed) reflects the ownership by the Qatar Investment Authority and its role as the financial arm of the government. The outlook on the long-term FCR is restored to ‘stable’ from ‘negative’. Asset quality and capitalization of QNB Group, which has already achieved a high degree of diversification of its assets, funding sources and profits with its presence in more than 30 countries - are expected to remain good with capital adequacy ratio to be maintained at around 16% through additional Tier 1 or Tier 2 capital, if necessary, it said. (Gulf-Times.com) DHBK to disclose its 1Q2017 financial statements on April 19 – Doha Bank (DHBK) announced to disclose its 1Q2017 financial statements results on April 19, 2017. (QSE) CBQK announces the agenda for its AGM & EGM – Commercial Bank of Qatar (CBQK) announced the agenda of the Ordinary and Extraordinary General Meetings (AGM & EGM) that will be held on April 4, 2017. In case the quorum of the above meeting is not met, the alternate date will be April 11, 2017. One of the items of the agenda is to approve the increase in the company’s capital by 5% from QR3,854,527,390 to QR4,047,253,760 by issuing bonus shares to the shareholders on the basis of one new share for every twenty shares held, and authorize the board of directors to dispose of fractional shares. (QSE) CBQK considers international bond issue – Commercial Bank of Qatar (CBQK) is in talks with banks about a potential international bond issue that will most likely be denominated in US dollars, sources said. If the deal goes ahead, CBQK would join a growing number of banks from the region tapping the international debt markets this year with the aim of improving capital reserves and boosting capital ratios to counter the impact of lower international oil prices. CBQK is looking at a benchmark-sized transaction, which conventionally means upwards of $500mn, the sources said. (Zawya) BMI: Qatar’s commercial banks to further gain from robust credit demand – BMI Research has said commercial banks in Qatar will continue to benefit from robust demand for credit over the coming years. The Fitch Group company said, “In particular, public sector credit demand will remain strong, as the government looks to finance large-scale investments into infrastructure projects linked to the 2022 FIFA World Cup and the National Vision 2030 diversification program.” Illustrating this trend, it said net claims on the public sector increased by 43.8% over the course of 2016. Moreover, global hydrocarbon prices are set to rise – BMI’s analysts forecast Brent crude to average $57 for a barrel and $60 over 2017 and 2018, respectively, compared with an average of $45.1 in 2016 – boosting consumer and business confidence in Qatar, and in turn fueling private credit demand. Overall, BMI forecasts Qatar’s annual asset growth at 12% and 12.5% in 2017 and 2018, respectively; the highest level in the GCC. (Gulf- Times.com) Qatar banks need to embrace digital transformation to drive cost-savings, efficiency – According to KPMG’s head (Digital Transformation) Farhan Syed, banks in Qatar need to consider digital transformation to ensure future growth, as the industry continues to feel the impact of advances in technology which are reshaping how organizations operate today. Syed said there were six forces driving digital transformation in the banking industry globally — mobile banking; using data and analytics for segmentation and marketing; using social platforms to encourage consumer dialogue; adopting cloud based systems to reduce cost and increase efficiency; automating processes and systems using robotics, and exploring digital currency and block-chain. (Gulf-Times.com) ERES to meet fixed income investors ahead of dollar Sukuk – Qatari real estate developer Ezdan Holding Group (ERES) will meet fixed income investors in Hong Kong ahead of a potential US dollar-denominated Sukuk issue. The company will hold meetings in Singapore on March 24, in Dubai and Abu Dhabi on March 26 and in London on March 27, 2017. A benchmark regulation senior unsecured Sukuk with a maturity ranging between five and seven years may follow. HSBC and Mashreqbank are the joint global coordinators, and Dubai Islamic Bank, Emirates NBD Capital, HSBC, Mashreq, Natixis and Standard Chartered are joint lead managers and book- runners. The Islamic bond would be part of a $2bn trust certificate issuance program. Ezdan Holding Group is rated BBB- by S&P and Ba1 by Moody's. (Peninsula Qatar) MCCS’ AGM approves 40% cash dividend – The ordinary general assembly meeting (AGM) of Mannai Corporation (MCCS) approved the board of directors’ recommendation to distribute a cash dividend of 40% (QR4.00 per share) to the shareholders. Meanwhile, MCCS’ investment in French IT services group GFI Informatique helped raise its 2016 net profit to QR535mn amid “subdued economic conditions,” company Chairman Sheikh Hamad bin Abdulla bin Khalifa al-Thani said in his report to the AGM. The report was presented on Sheikh Hamad’s behalf by Mannai Vice Chairman Sheikh Suhaim bin Abdulla bin Khalifa al-Thani. He added, encouragingly, the contribution from our investment in GFI Informatique in France in 2016 fully met expectations, boosting net profit and helping to compensate for the softer conditions in our Qatar and regional businesses. (Peninsula Qatar, Gulf-Times.com)
- 3. Page 3 of 6 Qatar Stock Exchange Top Gainers Top Decliners Source: Qatar Stock Exchange (QSE) Source: Qatar Stock Exchange (QSE) Most Active Shares by Value (QR Million) Most Active Shares by Volume (Million) Source: Qatar Stock Exchange (QSE) Source: Qatar Stock Exchange (QSE) Investor Trading Percentage to Total Value Traded Net Traded Value by Nationality (QR Million) Source: Qatar Stock Exchange (QSE) Source: Qatar Stock Exchange (QSE) 20.7% 6.9% 5.0% 4.4% 4.4% 0.0% 8.0% 16.0% 24.0% Qatar Cinema & Film Distribution Commercial Bank of Qatar Al Ahli Bank Masraf Al Rayan Mazaya Qatar -9.8% -4.8% -4.3% -3.8% -3.1% -12.0% -8.0% -4.0% 0.0% QatarGeneral Insurance & Reinsurance DohaInsurance Zad Holding QatarIslamic Insurance Al MeeraConsumer Goods 386.8 202.8 139.3 110.4 98.8 0.0 140.0 280.0 420.0 Qatar International Islamic Bank Masraf Al Rayan Barwa Real Estate QNB Group Industries Qatar 8.6 5.7 5.2 4.8 4.0 0.0 3.0 6.0 9.0 Vodafone Qatar Qatar International Islamic Bank Ezdan Real Estate Masraf Al Rayan Barwa Real Estate 0% 20% 40% 60% 80% 100% Buy Sell 31.05% 35.97% 13.21% 36.13% 7.90% 7.75%47.85% 20.16% Qatari Individuals Qatari Institutions Non-Qatari Individuals Non-Qatari Institutions 801 1,009 1,305 505 (504) 504 (1,000) (500) - 500 1,000 1,500 Qatari Non-Qatari Net Investment Total Sold Total Bought
- 4. Page 4 of 6 TECHNICAL ANALYSIS OF THE QSE INDEX Source: Bloomberg The Index managed to gain 84.21 points, pushing the Index to 10,445.24 and gaining 0.81% compared to last week’s closing. A bullish engulfing candlestick has been created, which may trickledown, in a positive way, in the coming week. Support level remains at 10,300, and resistance level at the 11,500 level. DEFINITIONS OF KEY TERMS USED IN TECHNICAL ANALYSIS RSI (Relative Strength Index) indicator – RSI is a momentum oscillator that measures the speed and change of price movements. The RSI oscillates between 0 to 100. The index is deemed to be overbought once the RSI approaches the 70 level, indicating that a correction is likely. On the other hand, if the RSI approaches 30, it is an indication that the index may be getting oversold and therefore likely to bounce back. MACD (Moving Average Convergence Divergence) indicator – The indicator consists of the MACD line and a signal line. The divergence or the convergence of the MACD line with the signal line indicates the strength in the momentum during the uptrend or downtrend, as the case may be. When the MACD crosses the signal line from below and trades above it, it gives a positive indication. The reverse is the situation for a bearish trend. Candlestick chart – A candlestick chart is a price chart that displays the high, low, open, and close for a security. The ‘body’ of the chart is portion between the open and close price, while the high and low intraday movements form the ‘shadow’. The candlestick may represent any time frame. We use a one-day candlestick chart (every candlestick represents one trading day) in our analysis. Doji candlestick pattern – A Doji candlestick is formed when a security's open and close are practically equal. The pattern indicates indecisiveness, and based on preceding price actions and future confirmation, may indicate a bullish or bearish trend reversal. Shooting Star/Inverted Hammer candlestick patterns – These candlestick patterns have a small real body (open price and close price are near to each other), and a long upper shadow (large intraday movement on the upside). The Shooting Star is a bearish reversal pattern that forms after a rally. The Inverted Hammer looks exactly like a Shooting Star, but forms after a downtrend. Inverted Hammers represent a potential bullish trend reversal.
- 5. Page 5 of 6 Source: Bloomberg Company Name Price March 23 % Change WTD % Change YTD Market Cap. QR Million TTM P/E P/B Div. Yield Qatar National Bank 147.00 0.82 (0.74) 135,776 11.2 2.6 2.2 Qatar Islamic Bank 101.90 (0.10) (1.92) 24,078 11.8 1.7 4.7 Commercial Bank of Qatar 34.00 6.92 4.62 13,105 41.3 0.7 8.5 Doha Bank 31.45 (0.16) (6.68) 8,126 10.1 0.9 9.2 Al Ahli Bank 35.00 4.95 (5.77) 7,012 11.1 1.6 2.7 Qatar International Islamic Bank 68.00 (1.45) 8.28 10,293 13.1 1.5 5.9 Masraf Al Rayan 43.70 4.42 16.22 32,775 15.9 2.6 4.0 Al Khalij Commercial Bank 14.60 0.69 (14.12) 5,256 12.3 0.7 5.1 Qatar First Bank 8.55 0.12 (16.99) 1,710 N/A 1.0 N/A National Leasing 18.08 3.14 18.02 895 177.5 0.9 2.8 Dlala Holding 22.41 0.49 4.28 637 163.1 2.5 N/A Qatar & Oman Investment 9.77 (0.20) (1.81) 308 23.0 1.0 5.1 Islamic Holding Group 64.00 (0.16) 4.92 362 87.4 2.5 1.6 Banking and Financial Services 240,333 Zad Holding 85.20 (4.27) (4.48) 1,115 11.0 1.3 4.7 Qatar German Co. for Medical Devices 9.60 0.31 (4.95) 111 N/A 1.1 N/A Salam International Investment 10.50 0.38 (4.98) 1,200 10.5 0.7 7.6 Medicare Group 102.10 0.59 62.32 2,874 44.1 2.9 1.8 Qatar Cinema & Film Distribution 29.45 20.70 7.29 185 43.3 1.4 3.4 Qatar Fuel 137.00 1.48 2.70 13,621 15.4 1.9 4.7 Widam Food Co. 62.40 0.32 (8.24) 1,123 N/A 3.7 5.6 Mannai Corp. 81.20 (1.58) 1.50 3,704 6.9 1.5 6.2 Al Meera Consumer Goods 167.70 (3.06) (4.44) 3,354 16.8 2.4 5.4 Consumer Goods and Services 27,287 Qatar Industrial Manufacturing 44.50 2.30 0.00 2,115 10.9 1.4 6.7 Qatar National Cement 80.00 1.52 2.33 5,228 11.0 1.7 4.6 Industries Qatar 111.00 (1.33) (5.53) 67,155 22.7 2.0 3.6 Qatari Investors Group 62.70 0.80 7.18 7,795 28.2 3.1 1.6 Qatar Electricity and Water 218.90 (0.36) (3.57) 24,079 15.6 2.9 3.4 Aamal 14.40 (0.69) 5.65 9,072 19.6 1.2 N/A Gulf International Services 27.65 (0.18) (11.09) 5,139 77.8 1.4 3.6 Mesaieed Petrochemical Holding 14.73 0.89 (6.77) 18,506 18.6 1.3 4.1 Industrials 139,088 Qatar Insurance 70.50 (2.76) (4.39) 19,550 17.6 2.4 1.9 Doha Insurance 16.90 (4.79) (7.14) 845 11.7 0.8 3.6 Qatar General Insurance & Reinsurance 38.60 (9.81) (17.87) 3,378 15.4 0.5 3.8 Al Khaleej Takaful Insurance 19.00 1.60 (9.95) 485 37.0 0.9 5.3 Qatar Islamic Insurance 68.30 (3.80) 34.98 1,025 16.1 3.1 5.9 Insurance 25,283 United Development 19.58 0.93 (5.18) 6,933 11.1 0.6 6.4 Barw a Real Estate 34.50 1.17 3.76 13,425 8.4 0.7 7.2 Ezdan Real Estate 15.69 1.95 3.84 41,618 22.9 1.4 3.2 Mazaya Qatar Real Estate Development 13.78 4.39 (4.24) 1,519 20.4 1.0 N/A Real Estate 63,495 Ooredoo 102.00 0.99 0.20 32,673 14.9 1.5 3.4 Vodafone Qatar 8.98 (0.11) (4.16) 7,592 N/A 1.6 N/A Telecoms 40,264 Qatar Navigation (Milaha) 77.00 0.79 (19.46) 8,818 12.3 0.6 4.5 Gulf Warehousing 52.50 2.54 (6.25) 3,077 14.8 2.0 3.0 Qatar Gas Transport (Nakilat) 21.50 0.00 (6.89) 11,912 12.5 2.3 4.7 Transportation 23,807 Qatar Exchange 559,556
- 6. Contacts Saugata Sarkar Shahan Keushgerian Zaid al-Nafoosi , CMT, CFTe Head of Research Senior Research Analyst Senior Research Analyst Tel: (+974) 4476 6534 Tel: (+974) 4476 6509 Tel: (+974) 4476 6535 saugata.sarkar@qnbfs.com.qa shahan.keushgerian@qnbfs.com.qa zaid.alnafoosi@qnbfs.com.qa Mohamed Abo Daff QNB Financial Services Co. W.L.L. Senior Research Analyst Contact Center: (+974) 4476 6666 Tel: (+974) 4476 6589 PO Box 24025 mohd.abodaff@qnbfs.com.qa Doha, Qatar Disclaimer and Copyright Notice: This publication has been prepared by QNB Financial Services Co. W.L.L. (“QNBFS”) a wholly-owned subsidiary of Qatar National Bank (Q.P.S.C.). QNBFS is regulated by the Qatar Financial Markets Authority and the Qatar Exchange. Qatar National Bank (Q.P.S.C.) is regulated by the Qatar Central Bank. This publication expresses the views and opinions of QNBFS at a given time only. It is not an offer, promotion or recommendation to buy or sell securities or other investments, nor is it intended to constitute legal, tax, accounting, or financial advice. QNBFS accepts no liability whatsoever for any direct or indirect losses arising from use of this report. Any investment decision should depend on the individual circumstances of the investor and be based on specifically engaged investment advice. We therefore strongly advise potential investors to seek independent professional advice before making any investment decision. Although the information in this report has been obtained from sources that QNBFS believes to be reliable, we have not independently verified such information and it may not be accurate or complete. QNBFS does not make any representations or warranties as to the accuracy and completeness of the information it may contain, and declines any liability in that respect. For reports dealing with Technical Analysis, expressed opinions and/or recommendations may be different or contrary to the opinions/recommendations of QNBFS Fundamental Research as a result of depending solely on the historical technical data (price and volume). QNBFS reserves the right to amend the views and opinions expressed in this publication at any time. It may also express viewpoints or make investment decisions that differ significantly from, or even contradict, the views and opinions included in this report. This report may not be reproduced in whole or in part without permission from QNBFS COPYRIGHT: No part of this document may be reproduced without the explicit written permission of QNBFS. Page 6 of 6