QNBFS Daily Market Report May 15, 2019
•
0 likes•101 views

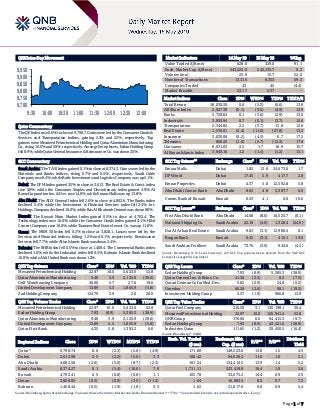
The QE Index rose 0.6% to close at 9,798.7. Gains were led by the Consumer Goods & Services and Transportation indices, gaining 2.5% and 2.2%, respectively.

Recommended
Recommended
More Related Content
More from QNB Group
More from QNB Group (20)
Recently uploaded
Recently uploaded (20)
QNBFS Daily Market Report May 15, 2019
- 1. Page 1 of 7 QSE Intra-Day Movement Qatar Commentary The QE Index rose 0.6% to close at 9,798.7. Gains were led by the Consumer Goods & Services and Transportation indices, gaining 2.5% and 2.2%, respectively. Top gainers were Mesaieed Petrochemical Holding and Qatar Aluminium Manufacturing Co., rising 10.0% and 5.9%, respectively. Among the top losers, Ezdan Holding Group fell 8.9%, while Qatar General Insurance & Reinsurance Co. was down 3.5%. GCC Commentary Saudi Arabia: The TASI Index gained 0.1% to close at 8,374.3. Gains were led by the Materials and Banks indices, rising 0.7% and 0.5%, respectively. Saudi Cable Company rose 8.4%, while Batic Investments and Logistics Company was up 5.1%. Dubai: The DFM Index gained 3.5% to close at 2,613. The Real Estate & Const. index rose 5.8%, while the Consumer Staples and Discretionary index gained 4.9%. Al Ramz Corporation Inv. & Dev. rose 14.8%, while Emaar Malls was up 13.8%. Abu Dhabi: The ADX General Index fell 2.6% to close at 4,802.6. The Banks index declined 5.4%, while the Investment & Financial Services index fell 2.4%. Int. Holdings Company declined 10.0%, while Ras Al Khaimah Cement was down 8.9%. Kuwait: The Kuwait Main Market Index gained 0.5% to close at 4,792.4. The Technology index rose 10.0%, while the Consumer Goods index gained 4.1%. Hilal Cement Company rose 16.8%, while Taameer Real Estate Invest Co. was up 11.8%. Oman: The MSM 30 Index fell 0.3% to close at 3,828.1. Losses were led by the Services and Financial indices, falling 1.2% and 0.1%, respectively. Renaissance Services fell 7.7%, while Alizz Islamic Bank was down 2.4%. Bahrain: The BHB Index fell 0.5% to close at 1,408.4. The Commercial Banks index declined 1.0%, while the Industrial index fell 0.5%. Bahrain Islamic Bank declined 10.0%, while Ahli United Bank was down 1.2%. QSE Top Gainers Close* 1D% Vol. ‘000 YTD% Mesaieed Petrochemical Holding 22.97 10.0 5,623.0 52.8 Qatar Aluminium Manufacturing 9.40 5.9 2,125.9 (29.6) Gulf Warehousing Company 46.00 5.7 27.6 19.6 United Development Company 13.89 5.5 1,805.9 (5.8) Zad Holding Company 124.79 3.9 2.0 20.0 QSE Top Volume Trades Close* 1D% Vol. ‘000 YTD% Mesaieed Petrochemical Holding 22.97 10.0 5,623.0 52.8 Ezdan Holding Group 7.93 (8.9) 5,385.3 (38.9) Qatar Aluminium Manufacturing 9.40 5.9 2,125.9 (29.6) United Development Company 13.89 5.5 1,805.9 (5.8) Qatar First Bank 4.35 2.8 1,392.2 6.6 Market Indicators 14 May 19 13 May 19 %Chg. Value Traded (QR mn) 628.6 329.0 91.1 Exch. Market Cap. (QR mn) 543,224.0 542,135.7 0.2 Volume (mn) 23.9 15.7 52.0 Number of Transactions 13,310 8,353 59.3 Companies Traded 43 45 (4.4) Market Breadth 23:17 5:37 – Market Indices Close 1D% WTD% YTD% TTM P/E Total Return 18,030.50 0.6 (2.3) (0.6) 13.8 All Share Index 2,927.39 (0.1) (3.6) (4.9) 13.9 Banks 3,720.04 0.1 (3.6) (2.9) 13.0 Industrials 3,095.94 0.7 (0.1) (3.7) 15.6 Transportation 2,344.82 2.2 (3.7) 13.8 12.6 Real Estate 1,578.91 (4.4) (11.0) (27.8) 13.2 Insurance 3,030.06 (0.2) (4.5) 0.7 17.5 Telecoms 866.25 (1.0) (5.7) (12.3) 17.8 Consumer 8,031.63 2.5 1.7 18.9 15.7 Al Rayan Islamic Index 3,840.16 1.2 (1.4) (1.2) 13.1 GCC Top Gainers## Exchange Close# 1D% Vol. ‘000 YTD% Emaar Malls Dubai 1.82 13.8 34,673.6 1.7 DP World Dubai 17.45 5.9 417.7 2.0 Emaar Properties Dubai 4.37 5.0 12,592.8 5.8 Abu Dhabi Comm. Bank Abu Dhabi 8.65 4.8 5,387.7 6.0 Comm. Bank of Kuwait Kuwait 0.53 4.1 0.0 16.6 GCC Top Losers## Exchange Close# 1D% Vol. ‘000 YTD% First Abu Dhabi Bank Abu Dhabi 14.08 (8.6) 16,525.7 (0.1) National Shipping Co. Saudi Arabia 25.10 (4.0) 1,328.4 (24.9) Dar Al Arkan Real Estate Saudi Arabia 9.03 (3.1) 12,900.5 0.1 Burgan Bank Kuwait 0.32 (3.1) 415.1 19.0 Saudi Arabian Fertilizer Saudi Arabia 73.70 (3.0) 944.0 (4.4) Source: Bloomberg (# in Local Currency) (## GCC Top gainers/losers derived from the S&P GCC Composite Large Mid Cap Index) QSE Top Losers Close* 1D% Vol. ‘000 YTD% Ezdan Holding Group 7.93 (8.9) 5,385.3 (38.9) Qatar General Ins. & Reins. Co. 41.50 (3.5) 0.2 (7.5) Qatari German Co for Med. Dev. 5.65 (2.9) 24.8 (0.2) Ooredoo 60.50 (2.6) 98.1 (19.3) Investment Holding Group 5.57 (1.9) 906.8 13.9 QSE Top Value Trades Close* 1D% Val. ‘000 YTD% Qatar Fuel Company 216.50 3.1 136,198.1 30.4 Mesaieed Petrochemical Holding 22.97 10.0 126,941.4 52.8 QNB Group 176.00 0.0 94,415.3 (9.7) Ezdan Holding Group 7.93 (8.9) 43,421.6 (38.9) Industries Qatar 111.65 (1.2) 29,450.5 (16.4) Source: Bloomberg (* in QR) Regional Indices Close 1D% WTD% MTD% YTD% Exch. Val. Traded ($ mn) Exchange Mkt. Cap. ($ mn) P/E** P/B** Dividend Yield Qatar* 9,798.74 0.6 (2.3) (5.6) (4.9) 171.80 149,223.6 13.8 1.5 4.5 Dubai 2,612.98 3.5 (2.2) (5.6) 3.3 108.42 94,626.2 11.0 1.0 5.1 Abu Dhabi 4,802.58 (2.6) (5.0) (8.7) (2.3) 101.54 134,410.5 13.9 1.4 5.2 Saudi Arabia 8,374.27 0.1 (5.4) (10.0) 7.0 1,711.11 523,419.9 19.4 1.9 3.6 Kuwait 4,792.41 0.5 (0.8) (0.8) 1.1 105.78 33,075.2 14.4 0.9 3.9 Oman 3,828.05 (0.3) (0.9) (3.0) (11.5) 1.64 16,803.5 8.0 0.7 7.2 Bahrain 1,408.44 (0.5) (1.9) (1.8) 5.3 1.62 21,817.0 9.8 0.9 5.4 Source: Bloomberg, Qatar Stock Exchange, Tadawul, Muscat Securities Market and Dubai Financial Market (** TTM; * Value traded ($ mn) do not include special trades, if any) 9,700 9,750 9,800 9,850 9,900 9,950 9:30 10:00 10:30 11:00 11:30 12:00 12:30 13:00
- 2. Page 2 of 7 Qatar Market Commentary The QE Index rose 0.6% to close at 9,798.7. The Consumer Goods & Services and Transportation indices led the gains. The index rose on the back of buying support from Qatari and GCC shareholders despite selling pressure from non-Qatari shareholders. Mesaieed Petrochemical Holding Company and Qatar Aluminium Manufacturing Company were the top gainers, rising 10.0% and 5.9%, respectively. Among the top losers, Ezdan Holding Group fell 8.9%, while Qatar General Insurance & Reinsurance Company was down 3.5%. Volume of shares traded on Tuesday rose by 52.0% to 23.9mn from 15.7mn on Monday. Further, as compared to the 30-day moving average of 12.7mn, volume for the day was 88.1% higher. Mesaieed Petrochemical Holding Company and Ezdan Holding Group were the most active stocks, contributing 23.5% and 22.5% to the total volume, respectively. Source: Qatar Stock Exchange (* as a % of traded value) Earnings Releases and Global Economic Data Earnings Releases Company Market Currency Revenue (mn) 1Q2019 % Change YoY Operating Profit (mn) 1Q2019 % Change YoY Net Profit (mn) 1Q2019 % Change YoY Arabian Scandinavian Insurance Co. Dubai AED 41.1 -22.7% – – 14.7 -2.2% Dubai National Ins. & Reinsurance Dubai AED 93.8 -5.1% – – 26.0 7.7% Gulf navigation Holding Dubai AED 45.0 19.5% -4.5 N/A -11.0 N/A National Cement Company Dubai AED 54.3 10.1% -7.6 N/A 38.1 122.4% Takaful Emarat Insurance Company Dubai AED 223.4 3.9% – – 0.3 -84.2% Orient Insurance Dubai AED 1,308.7 9.2% – – 162.1 7.2% DXB Entertainment Dubai AED 142.4 -17.8% – – -215.7 N/A Dubai Refreshment Dubai AED 139.5 3.3% 8.5 N/A 12.2 203.2% Abu Dhabi Ship Building# Abu Dhabi AED 73,620.0 -48.1% – – 92.0 -99.3% Al Khaleej Investment Abu Dhabi AED 6.2 -6.2% – – -1.9 N/A Fujairah Building Industries Abu Dhabi AED 60.2 -10.2% 12.6 -0.2% 13.4 2.7% Al Dhafra Insurance Company Abu Dhabi AED 86.6 -12.3% – – 21.6 33.1% Fujatrah Cement Industries Abu Dhabi AED 156.7 -4.0% – – 1.1 -85.4% Gulf Cement Company Abu Dhabi AED 130.1 -3.9% – – 1.5 N/A Methaq Takaful Insurance Co. Abu Dhabi AED 96.6 -18.3% – – 5.9 36.8% Umm Al Qaiwain General Inv. Co. Abu Dhabi AED 18.7 29.0% – – 17.6 29.0% Al Mazaya Holding Co. Kuwait KD 4.3 -22.7% 2.1 -5.0% 1.0 -24.9% Arig Bahrain USD 173.1 2.4% – – 1.8 260.0% GFH Financial Group Bahrain USD 70.1 6.5% – – 21.4 -41.4% Bahrain National Holding Company Bahrain BHD 9.5 3.7% – – 1.4 120.0% Bahrain Flour Mills Company Bahrain BHD 1.8 -4.3% 0.1 -53.5% 1.0 27.5% SICO Bahrain Bahrain BHD 4.5 39.7% – – 1.9 30.7% Delmon Poultry Company Bahrain BHD 3,926.8 10.1% -113.5 N/A 29.7 -91.5% Bahrain Duty Free Shop Complex Bahrain BHD 9.3 8.6% 1.6 6.9% 2.6 -6.5% Source: Company data, DFM, ADX, MSM, TASI, BHB. (Values in '000) Global Economic Data Date Market Source Indicator Period Actual Consensus Previous 05/14 UK UK Office for National Statist Jobless Claims Change April 24.7k – 22.6k 05/14 EU Eurostat Industrial Production SA MoM March -0.3% -0.3% -0.1% 05/14 EU Eurostat Industrial Production WDA YoY March -0.6% -0.8% 0.0% 05/14 Germany German Federal Statistical Office CPI MoM April 1.0% 1.0% 1.0% 05/14 Germany German Federal Statistical Office CPI YoY April 2.0% 2.0% 2.0% 05/14 Germany German Federal Statistical Office CPI EU Harmonized MoM April 1.0% 1.0% 1.0% 05/14 Germany German Federal Statistical Office CPI EU Harmonized YoY April 2.1% 2.1% 2.1% Source: Bloomberg (s.a. = seasonally adjusted; n.s.a. = non-seasonally adjusted; w.d.a. = working day adjusted) Overall Activity Buy %* Sell %* Net (QR) Qatari Individuals 29.55% 31.31% (11,075,820.31) Qatari Institutions 22.86% 18.31% 28,619,400.77 Qatari 52.41% 49.62% 17,543,580.46 GCC Individuals 0.76% 0.75% 48,476.21 GCC Institutions 2.43% 2.32% 717,050.66 GCC 3.19% 3.07% 765,526.87 Non-Qatari Individuals 9.54% 8.93% 3,860,511.89 Non-Qatari Institutions 34.85% 38.38% (22,169,619.22) Non-Qatari 44.39% 47.31% (18,309,107.33)
- 3. Page 3 of 7 Stock Split Dates for Listed Qatari Companies Source: QSE News Qatar QCSD amended the foreign ownership percentage of QIIK to 49% – Qatar Central Securities Depository (QCSD) announced that it had modified the foreigners’ ownership limit of Qatar International Islamic Bank (QIIK) to be 49% of the capital, which is equal to 74,170,687 shares. (QSE) Nebras Power’s operating profit jumps 8% to QR412mn in 2018 – Nebras Power financial results were announced during the fifth Annual General Assembly meeting. The company posted an operating profit of QR412mn, up 8% from 2017. Annual net profit of QR366mn for the year 2018, an increase of 10% compared to 2017, on the back of better operating performance of the asset portfolio, lower fixed costs and improved results from financial management. The group’s total assets stood at QR6.82bn in 2018, up 12% compared to 2017. The group’s net assets reached QR4.53bn, up 9% from 2017. (Qatar Tribune) QFC: Qatar’s non-hydrocarbon private sector foresees strengthened business volumes in second quarter – Qatar’s non-hydrocarbon private sector businesses foresee strengthened new business volumes in the second quarter of this year, indicating the growing optimism in the future, according to the Qatar Financial Centre (QFC). The overall sentiment regarding future output was the third-strongest since the Purchasing Managers’ Index (PMI) survey began in April 2017, with more than three-quarters of respondents expecting growth at their business units over the next 12 months. “As a consequence, while the level of the headline PMI figure ebbed slightly from March’s reading, sustained growth in such new work orders supported firms’ robust expectations for future total business activity,” QFC stated. The headline PMI for Qatar eased slightly to 48.9 in April, from 50.1 in March. Although the most recent reading continues to register above its average over the final quarter of 2018 (48.6), it is just below the trend observed over the first quarter of 2019 (49.7). The MoM dip in the PMI mainly reflects the slower growth rate of new orders and declines in the output as well as employment indicators. QFC Authority’s Managing Director (Business Development), Sheikha Alanoud bint Hamad Al-Thani said, “The headline PMI edged lower in April but remains indicative of overall growth in the Qatari economy, and at a faster rate than the mediocre performance seen at the end of 2018.” (Gulf- Time.com) Inflation in Qatar rises 0.51% MoM in April – Substantially higher expenses towards transportation and restaurants, as well as costlier clothing and communication led Qatar's cost of living, based on Consumer Price Index (CPI), rise 0.51% MoM this April, according to the official statistics. The CPI inflation was, however, down 0.39% on a yearly basis, despite increased expenses towards transportation, education and tobacco, according to the Planning and Statistics Authority. Highlighting that the headline inflation remains subdued; the International Monetary Fund (IMF), after its officials concluded their visit to Qatar, stated the proposed restructuring in the fiscal space, including taxation, may slightly lift price levels in the future. Transport, which has 14.59% weightage, saw its group index rise 3.22% and 1.68% on monthly and yearly basis, respectively this April. The sector has the direct linkage to the dismantling of administered prices in petrol and diesel, which
- 4. Page 4 of 7 have witnessed sustained increase in the recent past as part of lessening the subsidies. (Gulf-Time.com) Real estate transactions in between May 5-9 stood at QR274,579,315 – The trading volume of registered real estates between May 5 to May 9 at the Ministry of Justice’s real estate registration department stood at QR274,579,315. The weekly report stated that the trading included empty lands, residential units and residential buildings. (Gulf-Time.com) Qatargas achieves milestone with 10,000th ship loading by RLTO – Qatargas announced that Qatargas Ras Laffan Terminal Operations (RLTO) has safely loaded the 10,000th cargo shipment of non-LNG product in the Ras Laffan Industrial City (RLIC). Since starting operations in 2006, the dedicated teams at Qatargas have efficiently and reliably loaded more than 4bn barrels of product to customers all over the world. With demand continuing to grow for the vast array of products produced in RLIC, RLTO is entrusted with handling approximately 1mn barrels of oil equivalent of product every single day. (Gulf- Time.com) Qatar to capitalize on growing global demand for clean energy – Qatar is set to capitalize on an increasing global appetite for a cleaner burning fuel as it presses ahead with plans to increase its LNG output from the current 77mn tons (MT) a year to 110 MT by 2024. According to the latest World LNG Report by the International Gas Union, global LNG trade increased sharply again in 2018, rising by 28.2 MT to reach 316.5 MT. This marks the fifth consecutive year of incremental growth and the third- largest annual increase ever, behind only 2010 and 2017. This year’s global LNG supply, on the other hand, is estimated to increase by 33 MT to a record 358 MT per annum, according to a new report from the Bloomberg New Energy Finance (BNEF). Reports stated the global LNG trade will maintain this upward trajectory for years together, leaving enough room for a swift absorption of Qatar’s increased output. Qatar currently accounts for more than 25% of the global LNG supply and for over a decade has been the world’s leading supplier of LNG. (Qatar Tribune) Shift towards ‘circular economy’ to boost growth, says Al- Attiyah – As the world transitions towards a sustainable future, the use of finite resources is in question, and the current model of ‘take-make-waste’ could be replaced by a circular model, according to the Al-Attiyah Foundation. Circular economy, the Qatar-based non-profit think tank stated is one that aims to decouple economic activity from the consumption of finite resources, whilst taking waste out of the system. In its latest research report, the Al-Attiyah Foundation explores what a circular economy is, how the world is already taking steps in this direction, and how adopting such an approach is aligned with the Qatar National Vision 2030. HE Abdullah bin Hamad Al-Attiyah said, “Moving away from a linear economy model towards a circular economy would reduce pressure on the environment, improve the security of raw materials and ultimately boost economic growth.” The concept of a ‘circular economy’ is not the latest buzzword for sustainability; it applies thinking that has been around for centuries focused on a methodology for reducing consumption of non-renewable resources. (Gulf-Time.com) Doha Metro to boost real estate sector – Doha Metro project will further boost the country’s real estate sector. The areas closer to the metro stations are likely to benefit the most from the project as they are expected to attract new real estate projects. ValuStrat’s General Manager, Pawel Banach said, “One of the significant impacts of rail transit projects is the impact on the real estate market. Numerous accounts of recent experiences with the impact of rail transit on property values have surfaced within the past two decades regionally and internationally. Proximity to the metro system in Qatar may potentially become a trigger for real estate activity and development.” The partial operations of Doha Metro Red Line were launched last Wednesday with trains running between Al Qassar in the north to Al Wakrah in the south. The full opening of the network is expected by 2020. Past experiences in other countries have showed that properties located near metro stations have commanded premium compared to properties far from stations. (Peninsula Qatar) International BNEF: Global LNG demand to expand by one-third over 2019-23 – Global LNG imports are expected to grow almost one-third by 2023, rising to 426mn metric tons per year from 324MMtpa now, according to BNEF. Europe will surpass Asia in LNG demand growth in 2019, in anticipation of higher demand from households if weather stays close to 30-year average and more gas is burned to produce power. Asia will return as the growth engine over 2020-23, despite declining LNG imports by traditional buyers Japan and South Korea. China will lead the growth over 2020-21 as environmental efforts intensify in inner provinces. However, higher pipeline gas imports from Kazakhstan and the start of Russian pipeline gas flows will reduce its LNG appetite. South Asia and Southeast Asia will dominate demand growth over 2022-23 as more gas is consumed by the power and industrial sectors, while local gas production drops. (Bloomberg) MBA: US mortgage delinquencies rose in first quarter from 18- year low at year-end – The number of US homeowners who fell behind on their mortgage payments climbed in the first quarter from an 18-year low at the end of 2018, while the share of mortgages at the start of foreclosure actions slipped, the Mortgage Bankers Association (MBA) stated. The delinquency rate for mortgages on one-to-four-unit homes rose to 4.42% in the first three months of 2019, up from 4.06% at the end of the fourth quarter which was the lowest level since the first quarter of 2000, MBA stated. The percentage of loans on which foreclosure actions began fell to 0.23%, from 0.25% in the fourth quarter of 2018. It was 5 basis points lower than a year earlier. (Reuters) Trump calls trade war with China 'little squabble,' says talks ongoing – The US President, Donald Trump called the trade war with China ‘a little squabble’ and insisted talks between the world’s two largest economies had not collapsed, as investors remained on guard for a further escalation of tit-for-tat tariffs. Trump, who has railed against what he describes as China’s unfair trade practices and threatened to impose punitive levies on all its imports, softened his tone in a series of remarks expressing optimism about reaching a trade deal with Beijing. (Reuters)
- 5. Page 5 of 7 Joblessness rate in the UK hits 45-year low – British unemployment has fallen to a 45-year low, official data showed, with the economy holding up despite prolonged Brexit uncertainty. The unemployment rate eased to 3.8% in the three months to March - the lowest level since the final quarter of 1974, the Office for National Statistics (ONS) stated. That compared with a 44-year low of 3.9% in the quarter to February. ONS added that the UK employment rate was estimated at 76.1%, which was the joint-highest figure on record. However the strong jobs figures were not necessarily translating into higher productivity. (Qatar Tribune) China’s April industrial output cools, retail sales growth falls to 16-year low as trade risks rise – China reported surprisingly weaker growth in industrial output and retail sales for April, reinforcing expectations that Beijing needs to roll out more stimulus measures as the trade war with the US escalates. Investment also stumbled unexpectedly, suggesting China’s economy is still struggling for better footing even as a sharp hike in US tariffs ratcheted up pressure on its exporters. Growth in industrial output slowed more than expected to 5.4% in April from a year earlier, pulling back from a surprising strong four- and-a-half year high of 8.5% in March, which some analysts had suspected was boosted by seasonal and temporary factors. Analysts polled by Reuters had forecasted output would grow 6.5% for the month. China’s exports unexpectedly shrank in April in the face of US tariffs and weaker global demand, while factory surveys suggest new export orders remain sluggish. Retail sales were also worse than expected, with the headline number rising 7.2%, the slowest pace since May 2003, data from the National Bureau of Statistics showed. (Reuters) China's April property investment resilient, but sales growth moderates – Property investment in China was resilient in April as developers rushed to boost their land inventories in the wake of looser credit and purchasing rules, but demand for new homes remained weak in a reflection of the broader slowdown in the economy. Real estate investment is a key driver of growth in the world’s second-largest economy and solidity in the sector could cushion the impact of a vigorous multi-year government crackdown on debt and a sudden flare-up in trade tensions with the US. However, some analysts said bubble risks are rising as home prices continue to climb. The data was one of the few bright spots in a raft of other official economic indicators released, which added to signs that the economy lost momentum at the start of the second quarter. That has heightened fears about the outlook as trade tensions with the US unexpectedly escalated last week. (Reuters) Regional OPEC sees more 2019 demand for its oil as it keeps cutting output – OPEC stated that the world demand for its oil will be higher than expected this year as supply growth from rivals including US shale producers slows, pointing to a tighter market if the exporter group refrains from raising output. However, the OPEC, in a monthly report, stated its output fell in April. Supply losses in OPEC members Iran and Venezuela, both under US sanctions, have deepened the impact of an OPEC-led production-limiting deal. The so-called OPEC+ group of producers meets next month to review whether to maintain the pact beyond June. Vienna-based OPEC trimmed its estimate of oil supply growth from outside the group in 2019 and said the rapid rise in production of US tight oil, another term for shale, is moderating. “Supply growth is likely to be slower than last year amid the expected weaker global economic growth,” OPEC stated. “US tight oil production is increasingly faced with costly logistical constraints in terms of out-take capacity from land- locked production sites,” it stated. (Reuters) OPEC sees its rivals boosting investment in new oil supplies – OPEC sees its rivals boosting investment in new oil supplies. It sees non-OPEC nations spending at $390bn on new supplies this year. Estimated demand for OPEC’s crude in 2019 has been revised up, to 30.58mn bpd, which is ~1mn bpd less than the 2018 figure. OPEC is recently pumping ~0.5mn bpd less than this level of demand. OPEC crude output posted a miniscule monthly decline overall, dropping by 3k bpd in April, to 30.031mn bpd, even as Iran’s production continues to tumble, according to OPEC’s secondary sources. (Bloomberg) Saudi Aramco bets on oil supply to Europe and trading expansion – Saudi Aramco aims to boost its oil supply to Europe by 300,000 bpd within the next two years as it expands its trading operations there with an office opening this summer in London, according to a senior company executive. Saudi Aramco is expanding its downstream, or refining and marketing, footprint globally by signing new deals and boosting the capacity of its plants to secure new markets for its crude. The company’s trading arm has been focusing on a new processing arrangement in which it will supply European markets with both crude oil and products. Saudi Aramco is looking to finalize deals in the next two years through swapping mainly Saudi Arabian crude with oil products to supply customers in Europe and the Mediterranean, Saudi Aramco’s Senior Vice President for downstream, Abdulaziz Al- Judaimi said. “I am going to bet on Europe. We believe that Europe is a market that we are going to stay in for a long time,” he said. “The whole idea is we supply crude, and we offtake refined products to supply markets like Italy, the Balkans, as well as Cyprus. In Europe, having a virtual dedicated outlet and processing agreement is really the right winning strategy,” he added. (Reuters) Saudi Arabia's Sipchem and Sahara Petrochemical will seek deals in the US and Asia after merger – Saudi International Petrochemical Company (Sipchem) and Sahara Petrochemical plan to target acquisitions and joint ventures in the US and Asia when their merger is completed in order to expand market reach, top executives said. The new entity, Sahara International Petrochemical Company, will have combined assets worth more than $5.9bn, ranking second after the Kingdom’s biggest petrochemicals firm, Saudi Basic Industries (SABIC). “Combining Sipchem and Sahara will create an integrated petrochemical leader with an improved competitive position in Saudi Arabia and globally,” Sahara’s CEO, Saleh Bahamdan said, who will also be CEO of the new entity. “We are looking at opportunities in Asia and US markets for either acquisition or organic growth, JVs, and locally we are also exploring,” Sipchem’s CEO, Abdullah Al-Saadoon said, who will be the new company’s Chief Operating Officer. Growth opportunities will be evaluated and prioritized after the combined entity’s management and board are appointed.
- 6. Page 6 of 7 Shareholders of the two firms will hold separate meetings on May 16, 2019 to vote on the merger in the last step before completion. (Reuters) Arabian Centres institutional investors allocated 94% by sale of shares – Arabian Centres institutional investors have been allocated 94% of sale of shares. Retail offering saw 26,476 investors subscribe to 5.7mn shares at the IPO price of SR26 per share, representing 6% of the offered shares, Arabian Centres stated. Price for offering has been set at SR26, implying a market capitalization on admission of SR12.4bn. (Bloomberg) UAE's Finablr cuts IPO price in volatile markets – The UAE- based Finablr had to cut the price on its Initial Public Offering (IPO) as the payments and foreign exchange company has faced weak investor demand in jittery markets. Finablr has been priced at 175 pence per share, the bookrunner stated, significantly below an initially anticipated 210-260 pence range, giving the company an implied market value of about GBP1.23bn. Books were covered at full value of the deal worth 192.5mn shares, according to a message seen by Reuters from a bookrunner, which means the share offering will raise about GBP337mn. The deal size includes a revised base deal size of 175mn shares and 17.5mn of over-allotment option shares, the bookrunner stated. (Reuters) Kuwait becomes China of frontier markets as Argentina exits – Just as the US stock market dominates the developed-nations asset class and China occupies the biggest portion of emerging economies, now the frontier-market class has its own heavyweight, Kuwait. The Middle Eastern nation’s share of the MSCI Frontier Markets Index is set to rise more than 5 percentage points to 30.4% at the close of trading on May 28, 2019 according to the index provider. Argentina will leave the index the same day as it joins the emerging-market group, Executive Director of index research at MSCI, Pavlo Taranenko said. Kuwait’s reign may not last long. The country is due for its own promotion to the benchmark MSCI Emerging Markets Index at the company’s annual meeting in June. If it gets the upgrade, Kuwait will exit the frontier-market group in 2020, leaving current No. 2, Vietnam -- to dominate the asset class. “We are holding the consultation on a potential inclusion of Kuwait in our emerging-market indexes and that’s expected to run until this month-end, we would then analyze the results. Market reclassifications are typically announced in June,” he said. Kuwait’s weight will increase from 25.4% at the end of April, according to data compiled by Bloomberg. (Bloomberg) Al Salam Bank-Bahrain posts 2.7% YoY rise in net profit to BHD5.5mn in 1Q2019 – Al Salam Bank-Bahrain recorded net profit of BHD5.5mn in 1Q2019, an increase of 2.7% YoY. Finance Income rose 4.8% YoY to BHD12.6mn in 1Q2019. Total operating income fell 32.8% YoY to BHD11.3mn in 1Q2019. Total assets stood at BHD1.9bn at the end of March 31, 2019 as compared to BHD1.7bn at the end of December 31, 2018. Financing assets stood at BHD0.64bn (+13.7% QoQ), while customer current accounts stood at BHD0.4bn (+46.3% QoQ) at the end of March 31, 2019. EPS came in at 2.6 fils in 1Q2019 as compared to 2.5 fils in 1Q2018. (Bahrain Bourse)
- 7. Contacts Saugata Sarkar, CFA, CAIA Shahan Keushgerian Zaid al-Nafoosi, CMT, CFTe Head of Research Senior Research Analyst Senior Research Analyst Tel: (+974) 4476 6534 Tel: (+974) 4476 6509 Tel: (+974) 4476 6535 saugata.sarkar@qnbfs.com.qa shahan.keushgerian@qnbfs.com.qa zaid.alnafoosi@qnbfs.com.qa Mehmet Aksoy, PhD QNB Financial Services Co. W.L.L. Senior Research Analyst Contact Center: (+974) 4476 6666 Tel: (+974) 4476 6589 PO Box 24025 mehmet.aksoy@qnbfs.com.qa Doha, Qatar Disclaimer and Copyright Notice: This publication has been prepared by QNB Financial Services Co. W.L.L. (“QNB FS”) a wholly-owned subsidiary of Qatar National Bank (Q.P.S.C.). QNB FS is regulated by the Qatar Financial Markets Authority and the Qatar Exchange. Qatar National Bank (Q.P.S.C.) is regulated by the Qatar Central Bank. This publication expresses the views and opinions of QNB FS at a given time only. It is not an offer, promotion or recommendation to buy or sell securities or other investments, nor is it intended to constitute legal, tax, accounting, or financial advice. QNB FS accepts no liability whatsoever for any direct or indirect losses arising from use of this report. Any investment decision should depend on the individual circumstances of the investor and be based on specifically engaged investment advice. We therefore strongly advise potential investors to seek independent professional advice before making any investment decision. Although the information in this report has been obtained from sources that QNB FS believes to be reliable, we have not independently verified such information and it may not be accurate or complete. QNB FS does not make any representations or warranties as to the accuracy and completeness of the information it may contain, and declines any liability in that respect. For reports dealing with Technical Analysis, expressed opinions and/or recommendations may be different or contrary to the opinions/recommendations of QNB FS Fundamental Research as a result of depending solely on the historical technical data (price and volume). QNB FS reserves the right to amend the views and opinions expressed in this publication at any time. It may also express viewpoints or make investment decisions that differ significantly from, or even contradict, the views and opinions included in this report. This report may not be reproduced in whole or in part without permission from QNB FS. COPYRIGHT: No part of this document may be reproduced without the explicit written permission of QNB FS. Page 7 of 7 Rebased Performance Daily Index Performance Source: Bloomberg Source: Bloomberg Source: Bloomberg (#Market was closed on May 14, 2019) Source: Bloomberg (*$ adjusted returns) 60.0 80.0 100.0 120.0 Apr-15 Apr-16 Apr-17 Apr-18 Apr-19 QSE Index S&P Pan Arab S&P GCC 0.1% 0.6% 0.5% (0.5%) (0.3%) (2.6%) 3.5% (4.0%) (2.0%) 0.0% 2.0% 4.0% SaudiArabia Qatar Kuwait Bahrain Oman AbuDhabi Dubai Asset/Currency Performance Close ($) 1D% WTD% YTD% Global Indices Performance Close 1D%* WTD%* YTD%* Gold/Ounce 1,296.90 (0.2) 0.8 1.1 MSCI World Index 2,098.76 0.6 (1.3) 11.4 Silver/Ounce 14.79 0.2 0.1 (4.5) DJ Industrial 25,532.05 0.8 (1.6) 9.5 Crude Oil (Brent)/Barrel (FM Future) 71.24 1.4 0.9 32.4 S&P 500 2,834.41 0.8 (1.6) 13.1 Crude Oil (WTI)/Barrel (FM Future) 61.78 1.2 0.2 36.0 NASDAQ 100 7,734.49 1.1 (2.3) 16.6 Natural Gas (Henry Hub)/MMBtu# 2.71 0.0 6.7 (15.0) STOXX 600 376.34 0.8 (0.5) 9.1 LPG Propane (Arab Gulf)/Ton 62.25 (1.0) 0.0 (2.7) DAX 11,991.62 0.7 (0.8) 11.3 LPG Butane (Arab Gulf)/Ton 58.75 (1.1) (0.8) (15.5) FTSE 100 7,241.60 0.8 (0.3) 9.1 Euro 1.12 (0.2) (0.3) (2.3) CAC 40 5,341.35 1.3 0.0 10.5 Yen 109.61 0.3 (0.3) (0.1) Nikkei 21,067.23 (1.1) (1.3) 6.0 GBP 1.29 (0.4) (0.7) 1.2 MSCI EM 1,014.48 (0.2) (1.8) 5.0 CHF 0.99 (0.2) 0.3 (2.7) SHANGHAI SE Composite 2,883.61 (0.7) (2.6) 15.7 AUD# 0.69 0.0 (0.8) (1.5) HANG SENG 28,122.02 (1.5) (1.5) 8.6 USD Index 97.53 0.2 0.2 1.4 BSE SENSEX 37,318.53 1.0 (0.8) 2.5 RUB 64.95 (0.7) (0.2) (6.8) Bovespa 92,092.44 0.5 (2.7) 2.0 BRL 0.25 0.5 (0.4) (2.3) RTS 1,241.51 2.8 2.3 16.2 102.9 96.0 85.0