QNBFS Daily Market Report August 2, 2018
•
0 gefällt mir•18 views

The QSE Index rose 1.5% to close at 9,976.5.

Empfohlen
Empfohlen
Weitere ähnliche Inhalte
Mehr von QNB Group
Mehr von QNB Group (20)
Kürzlich hochgeladen
Kürzlich hochgeladen (20)
QNBFS Daily Market Report August 2, 2018
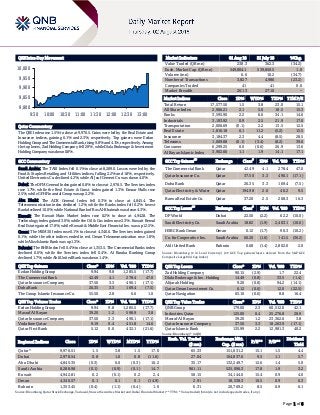
- 1. Page 1 of 6 QSE Intra-Day Movement Qatar Commentary The QSE Index rose 1.5% to close at 9,976.5. Gains were led by the Real Estate and Insurance indices, gaining 6.1% and 2.3%, respectively. Top gainers were Ezdan Holding Group and The Commercial Bank, rising 9.8% and 4.1%, respectively. Among the top losers, Zad Holding Company fell 2.9%, while Dlala Brokerage & Investment Holding Company was down 0.8%. GCC Commentary Saudi Arabia: The TASI Index fell 0.1% to close at 8,289.0. Losses were led by the Food & Staples Retailing and Utilities indices, falling 2.2% and 1.8%, respectively. United Electronics Co. declined 4.2%, while Al Jouf Cement Co. was down 4.0%. Dubai: The DFM General Index gained 0.8% to close at 2,978.5. The Services index rose 1.7%, while the Real Estate & Const. index gained 1.3%. Emaar Malls rose 2.5%, while GFH Financial Group was up 2.2%. Abu Dhabi: The ADX General Index fell 0.3% to close at 4,845.4. The Telecommunication index declined 1.2%, while the Banks index fell 0.2%. Invest Bank declined 10.0%, while National Bank of Ras Al-Khaimah was down 4.3%. Kuwait: The Kuwait Main Market Index rose 0.2% to close at 4,942.8. The Technology index gained 3.0%, while the Oil & Gas index rose 2.3%. Kuwait Remal Real Estate gained 17.8%, while Kuwait & Middle East Financial Inv. was up 12.5%. Oman: The MSM 30 Index rose 0.1% to close at 4,340.6. The Services index gained 0.1%, while the other indices ended in red. Oman Telecommunication rose 1.8%, while Alizz Islamic Bank was up 1.3%. Bahrain: The BHB Index fell 0.4% to close at 1,353.5. The Commercial Banks index declined 0.6%, while the Services index fell 0.4%. Al Baraka Banking Group declined 1.7%, while Ahli United Bank was down 1.4%. QSE Top Gainers Close* 1D% Vol. ‘000 YTD% Ezdan Holding Group 9.94 9.8 1,285.5 (17.7) The Commercial Bank 42.49 4.1 278.4 47.0 Qatar Insurance Company 37.50 3.3 490.1 (17.1) Doha Bank 26.35 3.3 169.4 (7.5) The Group Islamic Insurance Co. 55.50 2.8 6.6 1.0 QSE Top Volume Trades Close* 1D% Vol. ‘000 YTD% Ezdan Holding Group 9.94 9.8 1,285.5 (17.7) Masraf Al Rayan 39.20 1.2 598.9 3.8 Qatar Insurance Company 37.50 3.3 490.1 (17.1) Vodafone Qatar 9.19 0.4 451.8 14.6 Qatar First Bank 5.12 0.0 432.1 (21.6) Market Indicators 01 Aug 18 31 July 18 %Chg. Value Traded (QR mn) 238.3 362.3 (34.2) Exch. Market Cap. (QR mn) 549,804.1 539,850.5 1.8 Volume (mn) 6.6 10.2 (34.7) Number of Transactions 3,827 4,986 (23.2) Companies Traded 41 41 0.0 Market Breadth 26:13 27:10 – Market Indices Close 1D% WTD% YTD% TTM P/E Total Return 17,577.50 1.5 3.8 23.0 15.1 All Share Index 2,906.21 2.1 5.0 18.5 15.3 Banks 3,595.90 2.2 6.6 34.1 14.6 Industrials 3,193.92 0.9 2.5 21.9 17.0 Transportation 2,006.69 (0.1) 2.2 13.5 12.5 Real Estate 1,816.18 6.1 11.2 (5.2) 15.5 Insurance 3,184.37 2.3 4.4 (8.5) 28.5 Telecoms 1,009.08 (0.1) (3.4) (8.2) 39.6 Consumer 6,299.25 0.0 (0.6) 26.9 13.6 Al Rayan Islamic Index 3,902.66 1.1 1.9 14.1 17.1 GCC Top Gainers ## Exchange Close # 1D% Vol. ‘000 YTD% The Commercial Bank Qatar 42.49 4.1 278.4 47.0 Qatar Insurance Co. Qatar 37.50 3.3 490.1 (17.1) Doha Bank Qatar 26.35 3.3 169.4 (7.5) Qatar Electricity & Water Qatar 194.98 2.6 46.2 9.5 Barwa Real Estate Co. Qatar 37.20 2.5 208.3 16.3 GCC Top Losers ## Exchange Close # 1D% Vol. ‘000 YTD% DP World Dubai 22.50 (2.2) 62.2 (10.0) Saudi Electricity Co. Saudi Arabia 18.82 (1.9) 2,403.1 (10.6) HSBC Bank Oman Oman 0.12 (1.7) 90.3 (10.2) Co. for Cooperative Ins. Saudi Arabia 60.20 (1.6) 141.5 (36.2) Ahli United Bank Bahrain 0.68 (1.4) 2,802.0 2.0 Source: Bloomberg (# in Local Currency) (## GCC Top gainers/losers derived from the S&P GCC Composite Large Mid Cap Index) QSE Top Losers Close* 1D% Vol. ‘000 YTD% Zad Holding Company 90.15 (2.9) 1.7 22.4 Dlala Brokerage & Inv. Holding 14.49 (0.8) 33.5 (1.4) Alijarah Holding 9.20 (0.8) 94.2 (14.1) Qatar Oman Investment Co. 6.12 (0.6) 12.0 (22.5) Qatar Navigation 65.10 (0.6) 8.8 16.4 QSE Top Value Trades Close* 1D% Val. ‘000 YTD% QNB Group 179.00 2.3 60,512.0 42.1 Industries Qatar 125.00 0.4 25,276.8 28.9 Masraf Al Rayan 39.20 1.2 23,362.6 3.8 Qatar Insurance Company 37.50 3.3 18,263.9 (17.1) Qatar Islamic Bank 135.99 2.2 12,981.3 40.2 Source: Bloomberg (* in QR) Regional Indices Close 1D% WTD% MTD% YTD% Exch. Val. Traded ($ mn) Exchange Mkt. Cap. ($ mn) P/E** P/B** Dividend Yield Qatar* 9,976.51 1.5 3.8 1.5 17.0 65.33 151,031.2 15.1 1.5 4.4 Dubai 2,978.54 0.8 1.0 0.8 (11.6) 27.04 104,837.6 9.5 1.1 5.7 Abu Dhabi 4,845.35 (0.3) 0.0 (0.3) 10.2 35.17 132,249.7 12.6 1.4 5.0 Saudi Arabia 8,288.98 (0.1) (0.9) (0.1) 14.7 961.11 525,096.3 17.8 1.9 3.2 Kuwait 4,942.81 0.2 (0.1) 0.2 2.4 58.15 34,144.0 15.4 0.9 4.0 Oman 4,340.57 0.1 0.1 0.1 (14.9) 2.91 18,538.3 10.5 0.9 6.3 Bahrain 1,353.45 (0.4) (1.1) (0.4) 1.6 6.31 20,769.2 8.5 0.9 6.1 Source: Bloomberg, Qatar Stock Exchange, Tadawul, Muscat Securities Market and Dubai Financial Market (** TTM; * Value traded ($ mn) do not include special trades, if any) 9,800 9,850 9,900 9,950 10,000 9:30 10:00 10:30 11:00 11:30 12:00 12:30 13:00
- 2. Page 2 of 6 Qatar Market Commentary The QSE Index rose 1.5% to close at 9,976.5. The Real Estate and Insurance indices led the gains. The index rose on the back of buying support from non-Qatari shareholders despite selling pressure from Qatari and GCC shareholders. Ezdan Holding Group and The Commercial Bank were the top gainers, rising 9.8% and 4.1%, respectively. Among the top losers, Zad Holding Company fell 2.9%, while Dlala Brokerage & Investment Holding Company was down 0.8%. Volume of shares traded on Wednesday fell by 34.7% to 6.6mn from 10.2mn on Tuesday. Further, as compared to the 30-day moving average of 7.0mn, volume for the day was 5.7% lower. Ezdan Holding Group and Masraf Al Rayan were the most active stocks, contributing 19.4% and 9.0% to the total volume, respectively. Source: Qatar Stock Exchange (* as a % of traded value) Earnings Releases, Global Economic Data and Earnings Calendar Earnings Releases Company Market Currency Revenue (mn) 2Q2018 % Change YoY Operating Profit (mn) 2Q2018 % Change YoY Net Profit (mn) 2Q2018 % Change YoY Al-Rajhi Company for Cooperative Insurance Saudi Arabia SR 638.2 -6.2% – – 4.3 32.4% Bawan Co. Saudi Arabia SR – – 5.5 -68.1% 1.6 -82.0% Trade Union Cooperative Insurance Co. Saudi Arabia SR 220.8 -23.5% – – 2.0 -50.1% Arabian Shield Cooperative Insurance Co. Saudi Arabia SR 93.4 -43.5% – – 4.5 434.7% Al Sorayai Trading and Industrial Group Saudi Arabia SR – – 6.2 N/A 0.9 N/A Saudi Pharmaceutical Industries and Medical Appliances Corp. Saudi Arabia SR – – 36.5 -29.0% 35.5 -33.6% Advanced Petrochemical Company Saudi Arabia SR – – 246.6 28.4% 253.3 30.2% Arabian Cement Co. Saudi Arabia SR – – -52.2 N/A -50.9 N/A Saudi Advanced Industries Co. Saudi Arabia SR – – 14.3 100.4% 13.7 81.1% Abdullah Al Othaim Markets Co. Saudi Arabia SR – – 67.2 6.6% 74.1 4.1% Aramex Dubai AED 1,232.0 7.4% – – 122.0 25.8% Insurance House Abu Dhabi AED 46.2 -3.2% – – 2.8 1,185.6% Abu Dhabi National Insurance Company Abu Dhabi AED 593.6 18.9% – – 55.4 1.7% Finance House Abu Dhabi AED 66.8 8.7% – – -2.1 N/A Bahrain Commercial Facilities Company Bahrain BHD 9.1 7.8% – – 5.4 13.3% Bahrain Family Leisure Bahrain BHD – – – – -0.6 N/A Source: Company data, DFM, ADX, MSM, TASI, BHB. Global Economic Data Date Market Source Indicator Period Actual Consensus Previous 08/01 US Mortgage Bankers Association MBA Mortgage Applications 27-July -2.6% – -0.2% 08/01 EU Markit Markit Eurozone Manufacturing PMI July 55.1 55.1 55.1 08/01 Germany Markit Markit Germany Manufacturing PMI July 56.9 57.3 57.3 08/01 France Markit Markit France Manufacturing PMI July 53.3 53.1 53.1 Source: Bloomberg (s.a. = seasonally adjusted; n.s.a. = non-seasonally adjusted; w.d.a. = working day adjusted) Earnings Calendar Tickers Company Name Date of reporting 2Q2018 results No. of days remaining Status MCCS Mannai Corporation 2-Aug-18 0 Due GISS Gulf International Services 5-Aug-18 3 Due QCFS Qatar Cinema & Film Distribution Company 5-Aug-18 3 Due MPHC Mesaieed Petrochemical Holding Company 6-Aug-18 4 Due MCGS Medicare Group 6-Aug-18 4 Due IGRD Investment Holding Group 6-Aug-18 4 Due Overall Activity Buy %* Sell %* Net (QR) Qatari Individuals 28.41% 37.46% (21,569,457.16) Qatari Institutions 8.38% 21.45% (31,134,604.49) Qatari 36.79% 58.91% (52,704,061.65) GCC Individuals 0.36% 1.31% (2,262,992.59) GCC Institutions 1.95% 3.51% (3,714,257.40) GCC 2.31% 4.82% (5,977,249.99) Non-Qatari Individuals 7.83% 11.76% (9,369,810.69) Non-Qatari Institutions 53.06% 24.51% 68,051,122.33 Non-Qatari 60.89% 36.27% 58,681,311.64
- 3. Page 3 of 6 MERS Al Meera Consumer Goods Company 7-Aug-18 5 Due QGMD Qatari German Company for Medical Devices 8-Aug-18 6 Due IQCD Industries Qatar 8-Aug-18 6 Due ZHCD Zad Holding Company 9-Aug-18 7 Due MRDS Mazaya Qatar Real Estate Development 13-Aug-18 11 Due Source: QSE News Qatar Qatar’s index delivers highest return among emerging and developed world markets in 2018 – QSE Index broke pre- blockade levels and the market recorded significant increases in market capitalization and trading volumes. The QSE index has delivered 17.05% return since the beginning of the year until the close on August 1, 2018 trading session, making it the best performing market across emerging and developed markets globally. In 2018, the market has seen $1.45bn in foreign net inflows demonstrating confidence in the outlook for Qatar, particularly among foreign investors. The index closed at 9,976.51 on August 1, 2018 and broke the levels achieved on June 4, 2017 of 9,923.6 (pre-blockade levels) and the market capitalization has increased by 3.2% reaching QR549.8bn, compared to QR532.5bn on June 4, 2017. The average daily traded value on QSE has recorded significant increase since the beginning of the year and reached QR350mn during the first seven months of 2018, compared to QR328mn during the same period last year. (QSE) Qatar Islamic Insurance Company changes its name to ‘The Group Islamic Insurance Company’ – Qatar Islamic Insurance Company, one of the leading Takaful insurance companies in Qatar and the world has changed its name to ‘The Group Islamic Insurance Company’. According to a regulatory filing with the Qatar Stock Exchange, the Shari’ah-compliant insurance services provider announced that its Board of Directors have management received approval from Qatar Central Bank (QCB), the insurance market regulator, to change company name from Qatar Islamic Insurance Company to The Group Islamic Insurance Company and establish real estate company owned 100% for the group. In its meeting held recently, the Board of Directors approved to change the name of the company and the continuation of the necessary procedures and raise recommendation to the EGM to amend the Articles of Association of the company in accordance with the regulations and instructions regulating it. (Peninsula Qatar) QCB: Qatar’s foreign reserves rise 13% in June – Qatar’s foreign reserves rose 12.5% YoY in June, according to the data released by the Qatar Central Bank’s (QCB). Qatar’s overseas reserves grew to QR164.6bn last June, compared to QR146.3bn in the same month a year earlier, the QCB’s monthly monetary bulletin revealed. On a monthly basis, international reserves leveled up 0.91% to QR163.12bn during June, from QR146.3bn in May. The central bank attributed the rise in international reserves to the increase in bond and treasury bills to QR33.3bn in June, versus QR23.15bn for the same period of the previous year. Moreover, the gas-rich country’s international reserves included foreign-currency liquid assets of QR72.7bn, in addition to Qatar’s special drawing rights (SDRs) held with the International Monetary Fund (IMF), which amounted to QR1.4bn. (Zawya) QCB sells QR1.1bn of Treasury bills – Qatar Central Bank (QCB) sold QR1.1bn of Treasury bills at a monthly auction, with yields falling from the last month, Reuters reported. The bank sold QR600mn of three-month bills at a yield of 2.21%, QR300mn of six month bills at 2.53% and QR200mn of nine-month paper at 2.75%. Last month, QCB sold QR700mn of three-month bills at 2.38%, QR300mn of six month bills at 2.63% and QR200mn of nine-month debt at a yield of 2.83%. (Peninsula Business) QIA to invest $500mn in Indonesia tourism – Indonesia’s Coordinating Minister for Maritime Affairs, Luhut Binsar Pandjaitan, and Qatar Investment Authority’s (QIA) CEO, Sheikh HE Abdulla Bin Mohamed Bin Saud Al Thani signed a Memorandum of Understanding (MoU) that will see QIA investing up to $500mn to boost tourism in the south-east Asian country. Under the MoU, QIA will invest the money in a series of projects to develop tourism within Indonesia’s ‘Top 10 Tourism Priority Destinations’, a press statement issued by QIA stated. These ten destinations have been identified to make tourism as the largest contributor to Indonesian GDP by 2030. The Indonesian Coordinating Ministry for Maritime Affairs (CMMA) will work closely with QIA to explore and evaluate potential investment development opportunities in the ten destinations. The MoU also allows QIA to invite other co- investors to join the project alongside QIA. (Gulf-Times.com) Qatar’s population lowest in 11 months – Qatar’s population has fallen to its lowest levels since August last year, according to figures released by the Ministry of Development Planning & Statistics (MDPS). The population at the end of July was 2,450,285, around 5.3% lower than the June figure of 2,580,734, according to the MDPS data. The previous lowest population in the past one year was at the end of August 2017, when the country had some 2,446,328 people. The fall could be attributed to the fact that a large number of residents have travelled out of the country, as is the practice, owing to the annual summer vacation. (Gulf-Times.com) International Global factory growth slowing; China-US trade war biting – Factory growth stuttered across the world in July, heightening concerns about the global economic outlook as an intensifying trade conflict between the US and China sent shudders through trading partners. Global economic activity remains healthy, but it has already passed its peak, according to economists polled by Reuters last month. They expect protectionist policies on trade, which show no signs of abating, to tap the brakes. However, slowing growth, wilting confidence, and trade war fears are not likely to deter major central banks from moving away from their ultra-loose monetary policies put in place in the wake of the 2008 financial crisis. (Reuters)
- 4. Page 4 of 6 Fed leaves rates unchanged, stays on course for September hike – The US Federal Reserve kept interest rates unchanged but characterized the economy as strong, keeping the central bank on track to increase borrowing costs in September. The Fed stated economic growth has been rising strongly and the job market has continued to strengthen, while inflation has remained near the central bank’s 2% target since its last policy meeting in June, when it raised rates. The Fed’s decision left its benchmark overnight lending rate in a range of 1.75% to 2.00%. (Reuters) Trade tensions, labor shortages loom over US factories – US manufacturing activity slowed in July amid signs that a robust economy and import tariffs were putting pressure on the supply chain, which could hurt production in the long term. Other data showed private employers stepped up hiring in July, suggesting strength in the labor market and the overall economy at the start of the third quarter. The economy’s vibrancy was acknowledged by the Federal Reserve, which described activity as rising at a strong rate. The Institute for Supply Management (ISM) stated its index of national factory activity fell to a reading of 58.1 last month from 60.2 in June. A reading above 50 indicates expansion in manufacturing, which accounts for about 12% of the US economy. (Reuters) US construction spending posts biggest drop in more than a year – US construction spending recorded its biggest drop in more than a year in June as investment in both private and public projects fell, but spending for the prior months was revised sharply higher. The Commerce Department stated that construction spending fell 1.1%, the largest decline since April 2017. Data for May was revised up to show construction outlays rising 1.3% instead of the previously reported 0.4% gain. April’s outlays were also revised up to show them increasing 1.7% instead of 0.9%. Economists polled by Reuters had forecast that construction spending would advance 0.3% in June. Construction spending accelerated 6.1% on YoY basis. (Reuters) UK factories lose steam on eve of Bank of England rate decision – British factories lost momentum in July and manufacturers were their most downbeats in nearly two years, a survey showed, but the data was unlikely to deter the Bank of England from raising interest rates. The weak domestic demand highlighted in the IHS Markit/CIPS UK Manufacturing Purchasing Managers’ Index (PMI) added to other signs of a largely sluggish British economy facing an uncertain exit from the European Union in less than eight months’ time. The PMI slipped to its second-lowest level since late 2016 at 54.0, down from 54.3 in June and weaker than a median forecast of 54.2 in a Reuters poll of economists. (Reuters) UK house prices pick up a little speed in July – British house prices gained a bit of momentum in July after rising at their slowest annual rate in five years in June, according to mortgage lender Nationwide. House prices rose by an average 2.5% from July last year, faster than growth of 2.0% in June and above a forecast for 1.9% rise in a Reuters poll of economists. In monthly terms, prices rose by 0.6% in July from June, faster than the Reuters poll forecast of 0.2%. Nationwide stated the annual increase remained in the narrow 2-3% range of the past 12 months and the lender still expected prices to rise by only 1% in 2018. (Reuters) Eurozone’s factory growth subdued on trade fears, rising prices – Eurozone’s manufacturing growth remained subdued in July as worries about trade tensions, tariffs and rising prices kept optimism in check, a survey showed. IHS Markit’s July final manufacturing Purchasing Managers’ Index only nudged up to 55.1 from June’s 18-month low of 54.9, unchanged from an initial reading and still comfortably above the 50 level that separates growth from contraction. The output index made a similar small move, rising to 54.4 from June’s 54.2, which was its lowest reading since November 2016. (Reuters) German factory growth accelerates in July – Higher output and stronger new orders led to faster growth in Germany’s manufacturing sector in July, a survey showed. Markit’s Purchasing Managers’ Index (PMI) for manufacturing, which accounts for about a fifth of the economy, rose to 56.9 from 55.9 in June. July matched May’s reading and was well above the 50 line that separates growth from contraction. The figure was lower than a flash reading of 57.3, however. (Reuters) India central bank hikes key rate for second straight meet; neutral stance kept – Reserve Bank of India raised interest rates for the second straight meeting, but retained its neutral stance as it aimed to contain inflation while not choking growth. The RBI’s Monetary Policy Committee (MPC) raised the repo rate by 25 basis points to 6.50%. It is the first time since October 2013 that the rate has been increased at consecutive policy meetings. In June, the MPC also increased the key rate by 25 bps. The rate action was in line with a Reuters poll last week, which showed 37 of 63 economists expecting a rate increase. The bank’s decision to raise rates comes as global central banks, such as the US Federal Reserve, the Bank of England and the Indonesian central bank also adopt a tightening path. (Reuters) India’s factory growth eases in July on weaker demand – Growth in India’s manufacturing industry slowed last month, largely pressured by a modest weakening in demand and output, though overall conditions remained solid, a private survey showed. The Nikkei Manufacturing Purchasing Managers’ Index, compiled by IHS Markit, decreased to 52.3 in July from June’s 53.1, below a Reuters poll median of 53.0. Yet the index has now held above the 50-mark that separates growth from contraction for 12 straight months, indicating the economy was on a reasonably solid footing and could retain the title of fastest growing major economy in the coming quarters. (Reuters) Regional OPEC’s oil production climbs as Saudi Arabia pumps near record – The Organization of Petroleum Exporting Countries’ crude output increased in July as Saudi Arabia pumped near-record volumes to make good on a pledge to consumers that demand would be met. The kingdom’s oil production grew by 230,000 barrels per day (bpd) in July to 10.65mn bpd. This is just below of an all-time peak reached in 2016, according to Bloomberg. Higher crude output from the Saudi Arabia, along with Nigeria and Iraq, pushed up total production from OPEC by 300,000 bpd, offsetting losses from spiraling economic collapse in Venezuela, political clashes in Libya and the onset of US sanctions against Iran. (Bloomberg)
- 5. Page 5 of 6 Saudi Arabia’s IT & telecom sector logs 29% increase in online hiring – E-recruitment in the Kingdom of Saudi Arabia’s IT and Telecom sector recorded a substantial increase of 29% from June 2017, while overall hiring in the Kingdom has risen 10% in the same period, according to Monster Employment Index (MEI) report. The increase in demand for talent in the IT and Telecom sector follows Crown Prince Muhammad Bin Salman’s announcement of ‘Project Neom’ at The Future Investment Initiative in 2017. The $500bn ultra-high-tech future megacity is part of Saudi Arabia’s national strategy to drive a digital evolution in the country, a key enabler in achieving the milestones and objectives of Vision 2030. (GulfBase.com) CMA announces the approval of the capital increase of Taleem REIT Fund – Saudi Arabia’s Capital Market Authority (CMA) issued its resolution approving the Saudi Fransi Capital’s request to increase Taleem REIT Fund’s capital from SR285mn to SR510mn for the purpose of acquiring real estate assets. Such approval was granted upon the Saudi Fransi Capital’s request complied with the relevant disclosure requirements as per the Real Estate Investment Funds Regulations and Real Estate Investment Traded Funds Instructions. (Tadawul) Capital, reserves of UAE banks hit $90bn in 2Q2018 – The aggregate capital and reserves of banks operating in the UAE increased by 4.4%, reaching $90bn by the end of 2Q2018 compared to 1.5% increase at the end of 2Q2017. The total capital adequacy ratio showed an increase of 3.4% during 2Q2018, compared to a decrease of 0.5% during 2Q2017, according to Central Bank of the UAE (CBUAE). Banks continued to remain well above the 12.375% Capital Adequacy Ratio, which includes the 1.875% Capital Conservation Buffer requirement and 8.5% Tier 1 Ratio as prescribed by the CBUAE regulations in compliance to Basel III guidelines. (GulfBase.com) Dubai’s tourism growth slows in 1H2018 – The number of foreigners visiting Dubai grew by 0.5% in 1H2018, a substantially slower rate than the 10.6% growth recorded a year earlier, official date showed. Dubai, which has spent billions on building attractions including the world’s tallest tower, hosted 8.1mn international overnight tourists in 1H2018, the tourism department stated. It had previously reported 8.06mn tourists for 1H2017. (Reuters) Dubai housing rents stable for first time in two years – Residential rents across Dubai registered no change during 1Q2018, helping improve the annual rate of change to -3.1%, from -7.7% at the end of last year, according to Cluttons. This marks the first stable quarter for rents in the Emirate in over two years. While the rental market had shown signs of stabilizing, the growing volume of off-plan investment stock, destined to be made available for rent after handover, may pose challenges in the future, it stated. The ability of the rental market to absorb a high volume of new stock would likely be tested over the next three years, it added. (GulfBase.com) Abu Dhabi’s hotels report 6% rise in guest numbers – Number of hotel guests staying in Abu Dhabi in June rose by 6% compared to the same month last year, driven largely by growing number of visitors from Saudi Arabia and the US, according to Department of Culture and Tourism - Abu Dhabi. Completing a record-breaking first half of the year, June’s results reveal the department’s plans to exceed 2017’s numbers of guest arrivals, when close to 5mn people stayed in the Emirate, are on track. In total 339,592 visitors stayed in Abu Dhabi’s 162 hotels and hotel apartments during June, an increase of more than 19,000 over the previous year. For 1H2018, the figures showed Abu Dhabi upping the total number of hotel guests to the Emirate by 5% on the year, with 2,413,230 guests in total arriving. (GulfBase.com) Kuwait will not waver in executing economic reform – Kuwait will not waver in executing the economic and financial reform initiated three years ago through activation of economic reform document submitted by the Ministry of Finance, which has become the national program for economic and financial sustainability, according to a report. Sources said the relatively improved global oil prices in recent times has helped reduce the deficit in public budget to some extent but the positive headway does not mean that Kuwait will quit the economic reform program and demographic reform process or reinstate subsidies. (GulfBase.com) Kuwait says oil market approaching stability – Kuwait’s Oil Minister, Bakhit Al Rashidi said that the global oil market was approaching stability based on current production levels after the recent OPEC and non-OPEC agreement to boost output. “It is clear today based on the current level of production that we are approaching a very stable stage, whether for the consumers or the producers,” Al Rashidi said. Kuwait has raised its oil output under June’s agreement and is pumping 2.8mn bpd, he said, adding that the country’s production capacity is 3.1mn bpd. An upcoming joint OPEC and non-OPEC committee meeting in Algeria, set for September 22-23, will review producers’ oil supply levels after OPEC and others led by Russia agreed in June to raise output to cool the market, the minister said. (Gulf-Times.com) CBO issues Treasury bills worth OMR58mn – The Central Bank of Oman (CBO) raised OMR58mn by way of allotting treasury bills. The treasury bills are for a maturity period of 91 days, from August 1, 2018 until October 31, 2018. The average accepted price reached 99.481 for every OMR100, and the minimum accepted price arrived at 99.420 per OMR100. Whereas the average discount rate and the average yield reached 2.08364% and 2.09458%, respectively. The interest rate on the Repo operations with CBO is 2.582% for the period from July 31, 2018 to August 6, 2018, while the discount rate on the Treasury Bills Discounting Facility with CBO is 3.332%, for the same period. (GulfBase.com)
- 6. Contacts Saugata Sarkar, CFA, CAIA Shahan Keushgerian Zaid al-Nafoosi, CMT, CFTe Head of Research Senior Research Analyst Senior Research Analyst Tel: (+974) 4476 6534 Tel: (+974) 4476 6509 Tel: (+974) 4476 6535 saugata.sarkar@qnbfs.com.qa shahan.keushgerian@qnbfs.com.qa zaid.alnafoosi@qnbfs.com.qa QNB Financial Services Co. W.L.L. Contact Center: (+974) 4476 6666 PO Box 24025 Doha, Qatar Disclaimer and Copyright Notice: This publication has been prepared by QNB Financial Services Co. W.L.L. (“QNBFS”) a wholly-owned subsidiary of Qatar National Bank (Q.P.S.C.). QNBFS is regulated by the Qatar Financial Markets Authority and the Qatar Exchange. Qatar National Bank (Q.P.S.C.) is regulated by the Qatar Central Bank. This publication expresses the views and opinions of QNBFS at a given time only. It is not an offer, promotion or recommendation to buy or sell securities or other investments, nor is it intended to constitute legal, tax, accounting, or financial advice. QNBFS accepts no liability whatsoever for any direct or indirect losses arising from use of this report. Any investment decision should depend on the individual circumstances of the investor and be based on specifically engaged investment advice. We therefore strongly advise potential investors to seek independent professional advice before making any investment decision. Although the information in this report has been obtained from sources that QNBFS believes to be reliable, we have not independently verified such information and it may not be accurate or complete. QNBFS does not make any representations or warranties as to the accuracy and completeness of the information it may contain, and declines any liability in that respect. For reports dealing with Technical Analysis, expressed opinions and/or recommendations may be different or contrary to the opinions/recommendations of QNBFS Fundamental Research as a result of depending solely on the historical technical data (price and volume). QNBFS reserves the right to amend the views and opinions expressed in this publication at any time. It may also express viewpoints or make investment decisions that differ significantly from, or even contradict, the views and opinions included in this report. This report may not be reproduced in whole or in part without permission from QNBFS. COPYRIGHT: No part of this document may be reproduced without the explicit written permission of QNBFS. Page 6 of 6 Rebased Performance Daily Index Performance Source: Bloomberg Source: Bloomberg Source: Bloomberg ( # Market closed on August 01, 2018) Source: Bloomberg (*$ adjusted returns) 40.0 60.0 80.0 100.0 120.0 Jul-14 Jul-15 Jul-16 Jul-17 Jul-18 QSE Index S&P Pan Arab S&P GCC (0.1%) 1.5% 0.2% (0.4%) 0.1% (0.3%) 0.8% (0.6%) 0.0% 0.6% 1.2% 1.8% SaudiArabia Qatar Kuwait Bahrain Oman AbuDhabi Dubai Asset/Currency Performance Close ($) 1D% WTD% YTD% Global Indices Performance Close 1D%* WTD%* YTD%* Gold/Ounce 1,215.95 (0.7) (0.6) (6.7) MSCI World Index 2,149.36 (0.2) (0.3) 2.2 Silver/Ounce 15.38 (0.9) (0.7) (9.2) DJ Industrial 25,333.82 (0.3) (0.5) 2.5 Crude Oil (Brent)/Barrel (FM Future) 72.39 (2.5) (2.6) 8.3 S&P 500 2,813.36 (0.1) (0.2) 5.2 Crude Oil (WTI)/Barrel (FM Future) 67.66 (1.6) (1.5) 12.0 NASDAQ 100 7,707.29 0.5 (0.4) 11.6 Natural Gas (Henry Hub)/MMBtu# 2.82 0.0 1.3 (20.4) STOXX 600 389.84 (0.8) (0.5) (2.8) LPG Propane (Arab Gulf)/Ton 93.63 (2.0) (3.2) (5.4) DAX 12,737.05 (0.8) (0.9) (4.3) LPG Butane (Arab Gulf)/Ton 102.50 (3.3) (3.1) (5.5) FTSE 100 7,748.76 (1.3) (0.6) (3.4) Euro 1.17 (0.3) 0.0 (2.9) CAC 40 5,498.37 (0.5) (0.2) 0.4 Yen 111.73 (0.1) 0.6 (0.9) Nikkei 22,746.70 1.0 (0.6) 0.7 GBP 1.31 0.0 0.2 (2.9) MSCI EM 1,086.87 (0.1) (0.5) (6.2) CHF 1.01 (0.2) 0.2 (1.8) SHANGHAI SE Composite 2,824.53 (1.9) (1.9) (18.6) AUD 0.74 (0.3) 0.1 (5.2) HANG SENG 28,340.74 (0.9) (1.6) (5.7) USD Index 94.66 0.1 (0.0) 2.8 BSE SENSEX 37,521.62 (0.0) 0.9 3.0 RUB 63.04 0.8 0.4 9.4 Bovespa 79,301.65 0.1 (1.4) (8.5) BRL 0.27 0.2 (1.0) (11.7) RTS 1,160.09 (1.1) 0.7 0.5 89.4 86.3 82.2