QNBFS Daily Market Report April 18, 2019
•
0 likes•121 views

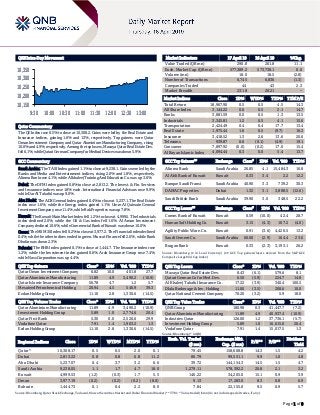
The QE Index rose 0.5% to close at 10,308.2. Gains were led by the Real Estate and Insurance indices, gaining 1.6% and 1.3%, respectively.

Recommended
Recommended
More Related Content
More from QNB Group
More from QNB Group (20)
Recently uploaded
Recently uploaded (20)
QNBFS Daily Market Report April 18, 2019
- 1. Page 1 of 9 QSE Intra-Day Movement Qatar Commentary The QE Index rose 0.5% to close at 10,308.2. Gains were led by the Real Estate and Insurance indices, gaining 1.6% and 1.3%, respectively. Top gainers were Qatar Oman Investment Company and Qatar Aluminium Manufacturing Company, rising 10.0% and 4.9%, respectively. Among the top losers, Mazaya Qatar Real Estate Dev. fell 6.1%, while Qatari German Company for Medical Devices was down 5.9%. GCC Commentary Saudi Arabia: The TASI Index gained 1.1% to close at 9,238.1. Gains were led by the Banks and Media and Entertainment indices, rising 2.0% and 1.8%, respectively. Alinma Bank rose 4.1%, while Alkhaleej Training And Education Co. was up 3.6%. Dubai: The DFM Index gained 0.8% to close at 2,813.2. The Invest. & Fin. Services and Insurance indices rose 1.8% each. International Financial Advisors rose 9.9%, while Dar Al Takaful was up 9.0%. Abu Dhabi: The ADX General Index gained 0.4% to close at 5,237.1. The Real Estate index rose 1.6%, while the Energy index gained 1.1%. Umm Al Qaiwain General Investment Company rose 11.4%, while Rak Properties was up 7.8%. Kuwait: The Kuwait Main Market Index fell 1.2% to close at 4,999.5. The Industrials index declined 2.0%, while the Oil & Gas index fell 1.6%. Al Aman Investment Company declined 10.6%, while Commercial Bank of Kuwait was down 10.0%. Oman: The MSM 30 Index fell 0.2% to close at 3,977.2. The Financial index declined 0.4%, while the other indices ended in green. Muscat Finance fell 2.6%, while Bank Dhofar was down 2.3%. Bahrain: The BHB Index gained 0.1% to close at 1,444.7. The Insurance index rose 1.2%, while the Investment index gained 0.6%. Arab Insurance Group rose 7.4%, while Nass Corporation was up 4.4%. QSE Top Gainers Close* 1D% Vol. ‘000 YTD% Qatar Oman Investment Company 6.82 10.0 401.8 27.7 Qatar Aluminium Manufacturing 11.89 4.9 3,490.2 (10.9) Qatar Islamic Insurance Company 56.78 4.7 1.2 5.7 Mesaieed Petrochemical Holding 20.94 4.5 546.9 39.3 Ezdan Holding Group 11.10 2.8 1,330.6 (14.5) QSE Top Volume Trades Close* 1D% Vol. ‘000 YTD% Qatar Aluminium Manufacturing 11.89 4.9 3,490.2 (10.9) Investment Holding Group 5.89 1.0 2,774.6 20.4 Qatar First Bank 5.30 0.0 2,520.6 29.9 Vodafone Qatar 7.91 1.4 1,903.2 1.3 Ezdan Holding Group 11.10 2.8 1,330.6 (14.5) Market Indicators 17 April 19 16 April 19 %Chg. Value Traded (QR mn) 290.8 261.8 11.1 Exch. Market Cap. (QR mn) 577,389.2 573,738.1 0.6 Volume (mn) 18.0 18.5 (2.8) Number of Transactions 6,745 6,836 (1.3) Companies Traded 44 43 2.3 Market Breadth 23:18 20:21 – Market Indices Close 1D% WTD% YTD% TTM P/E Total Return 18,967.90 0.5 0.5 4.5 14.3 All Share Index 3,144.22 0.6 0.5 2.1 14.7 Banks 3,881.59 0.0 0.5 1.3 13.5 Industrials 3,345.81 1.2 0.5 4.1 15.6 Transportation 2,424.49 0.4 0.4 17.7 13.4 Real Estate 1,975.44 1.6 0.5 (9.7) 16.3 Insurance 3,418.52 1.3 2.6 13.6 20.6 Telecoms 939.87 0.6 (0.1) (4.9) 19.1 Consumer 7,897.92 (0.0) (0.2) 17.0 15.4 Al Rayan Islamic Index 4,094.44 0.3 0.0 5.4 13.7 GCC Top Gainers## Exchange Close# 1D% Vol. ‘000 YTD% Alinma Bank Saudi Arabia 26.85 4.1 15,484.3 16.8 Al Ahli Bank of Kuwait Kuwait 0.33 3.4 2.2 12.2 Banque Saudi Fransi Saudi Arabia 40.90 3.3 739.2 30.3 DAMAC Properties Dubai 1.32 3.1 3,888.5 (12.6) Saudi British Bank Saudi Arabia 39.90 3.0 348.5 22.2 GCC Top Losers## Exchange Close# 1D% Vol. ‘000 YTD% Comm. Bank of Kuwait Kuwait 0.59 (10.0) 42.4 28.7 Human Soft Holding Co. Kuwait 3.15 (4.3) 107.2 (4.0) Agility Public Ware. Co. Kuwait 0.91 (3.6) 4,420.5 13.2 Saudi Cement Co. Saudi Arabia 60.00 (2.9) 164.4 23.6 Burgan Bank Kuwait 0.33 (2.3) 3,193.1 26.2 Source: Bloomberg (# in Local Currency) (## GCC Top gainers/losers derived from the S&P GCC Composite Large Mid Cap Index) QSE Top Losers Close* 1D% Vol. ‘000 YTD% Mazaya Qatar Real Estate Dev. 8.43 (6.1) 579.6 8.1 Qatari German Co for Med. Dev. 6.50 (5.9) 224.7 14.8 Al Khaleej Takaful Insurance Co. 17.22 (3.9) 340.4 100.5 Dlala Brokerage & Inv. Holding 11.00 (3.5) 208.6 10.0 Qatar National Cement Company 70.20 (3.2) 5.9 18.0 QSE Top Value Trades Close* 1D% Val. ‘000 YTD% QNB Group 180.98 0.3 41,447.7 (7.2) Qatar Aluminium Manufacturing 11.89 4.9 40,937.4 (10.9) Industries Qatar 126.00 1.2 37,736.1 (5.7) Investment Holding Group 5.89 1.0 16,615.0 20.4 Vodafone Qatar 7.91 1.4 15,017.5 1.3 Source: Bloomberg (* in QR) Regional Indices Close 1D% WTD% MTD% YTD% Exch. Val. Traded ($ mn) Exchange Mkt. Cap. ($ mn) P/E** P/B** Dividend Yield Qatar* 10,308.17 0.5 0.5 2.0 0.1 79.45 158,608.8 14.3 1.5 4.2 Dubai 2,813.22 0.8 0.8 6.8 11.2 86.79 99,551.1 9.9 1.0 4.8 Abu Dhabi 5,237.07 0.4 3.7 3.2 6.6 39.72 144,154.3 14.5 1.5 4.7 Saudi Arabia 9,238.05 1.1 1.7 4.7 18.0 1,279.11 578,392.2 20.8 2.1 3.2 Kuwait 4,999.53 (1.2) (0.3) 1.7 5.5 140.22 34,205.0 15.1 0.9 3.9 Oman 3,977.19 (0.2) (0.2) (0.2) (8.0) 9.13 17,283.0 8.3 0.8 6.9 Bahrain 1,444.73 0.1 0.4 2.2 8.0 7.84 22,155.0 9.5 0.9 5.7 Source: Bloomberg, Qatar Stock Exchange, Tadawul, Muscat Securities Market and Dubai Financial Market (** TTM; * Value traded ($ mn) do not include special trades, if any) 10,150 10,200 10,250 10,300 10,350 9:30 10:00 10:30 11:00 11:30 12:00 12:30 13:00
- 2. Page 2 of 9 Qatar Market Commentary The QE Index rose 0.5% to close at 10,308.2. The Real Estate and Insurance indices led the gains. The index rose on the back of buying support from GCC and non-Qatari shareholders despite selling pressure from Qatari shareholders. Qatar Oman Investment Company and Qatar Aluminium Manufacturing Company were the top gainers, rising 10.0% and 4.9%, respectively. Among the top losers, Mazaya Qatar Real Estate Development fell 6.1%, while Qatari German Company for Medical Devices was down 5.9%. Volume of shares traded on Wednesday fell by 2.8% to 18.0mn from 18.5mn on Tuesday. However, as compared to the 30-day moving average of 12.6mn, volume for the day was 42.7% higher. Qatar Aluminium Manufacturing Company and Investment Holding Group were the most active stocks, contributing 19.4% and 15.4% to the total volume, respectively. Source: Qatar Stock Exchange (* as a % of traded value) Earnings Releases, Global Economic Data and Earnings Calendar Earnings Releases Company Market Currency Revenue (mn) 1Q2019 % Change YoY Operating Profit (mn) 1Q2019 % Change YoY Net Profit (mn) 1Q2019 % Change YoY Filling & Packing Mat. MFG. Co. Saudi Arabia SR 36.7 2.5% -4.2 N/A -2.5 N/A Aldrees Petroleum and Transport Services Co. Saudi Arabia SR 1,299.8 1.1% 36.7 -9.2% 29.9 35.3% Mobile Telecomm. Co. Saudi Arabia Saudi Arabia SR 2,093.0 24.2% 382.0 167.1% 129.0 N/A Al Batinah Hotels# Oman OMR 320.4 26.1% – – -54.3 N/A Al Buraimi Hotel# Oman OMR 136.6 -6.7% 47.1 304.1% 43.9 293.8% Bahrain Family Leisure Company# Bahrain BHD 408.6 4.5% 49.8 17.6% 126.7 N/A Source: Company data, DFM, ADX, MSM, TASI, BHB. (# Values in ‘000) Global Economic Data Date Market Source Indicator Period Actual Consensus Previous 04/17 US Mortgage Bankers Association MBA Mortgage Applications 12-April -3.5% – -5.6% 04/17 UK UK Office for National Statistics CPIH YoY March 1.8% 1.9% 1.8% 04/17 UK UK Office for National Statistics CPI MoM March 0.2% 0.2% 0.5% 04/17 UK UK Office for National Statistics CPI YoY March 1.9% 2.0% 1.9% 04/17 UK UK Office for National Statistics CPI Core YoY March 1.8% 1.9% 1.8% 04/17 EU Eurostat CPI Core YoY March 0.8% 0.8% 0.8% 04/17 EU Eurostat CPI MoM March 1.0% 1.0% 0.3% 04/17 EU Eurostat CPI YoY March 1.4% 1.4% 1.4% 04/17 China National Bureau of Statistics Industrial Production YoY March 8.5% 5.9% -- 04/17 China National Bureau of Statistics Industrial Production YTD YoY March 6.5% 5.6% 5.3% 04/17 China National Bureau of Statistics GDP SA QoQ 1Q2019 1.4% 1.4% 1.5% 04/17 China National Bureau of Statistics GDP YTD YoY 1Q2019 6.4% 6.3% 6.6% 04/17 China National Bureau of Statistics GDP YoY 1Q2019 6.4% 6.3% 6.4% Source: Bloomberg (s.a. = seasonally adjusted; n.s.a. = non-seasonally adjusted; w.d.a. = working day adjusted) Earnings Calendar Tickers Company Name Date of reporting 1Q2019 results No. of days remaining Status NLCS Alijarah Holding 18-Apr-19 0 Due QIIK Qatar International Islamic Bank 21-Apr-19 3 Due QISI Qatar Islamic Insurance Company 21-Apr-19 3 Due GWCS Gulf Warehousing Company 21-Apr-19 3 Due QGTS Qatar Gas Transport Company Limited (Nakilat) 21-Apr-19 3 Due WDAM Widam Food Company 22-Apr-19 4 Due DBIS Dlala Brokerage & Investment Holding Company 23-Apr-19 5 Due QIGD Qatari Investors Group 23-Apr-19 5 Due Source: QSE Overall Activity Buy %* Sell %* Net (QR) Qatari Individuals 39.19% 56.23% (49,567,506.71) Qatari Institutions 11.38% 14.28% (8,448,686.85) Qatari 50.57% 70.51% (58,016,193.56) GCC Individuals 1.27% 1.61% (994,193.47) GCC Institutions 15.63% 0.84% 42,985,061.32 GCC 16.90% 2.45% 41,990,867.85 Non-Qatari Individuals 14.34% 15.41% (3,086,061.47) Non-Qatari Institutions 18.20% 11.63% 19,111,387.18 Non-Qatari 32.54% 27.04% 16,025,325.71
- 3. Page 3 of 9 Earnings Calendar Tickers Company Name Date of reporting 1Q2019 results No. of days remaining Status MCGS Medicare Group 24-Apr-19 6 Due QFBQ Qatar First Bank 24-Apr-19 6 Due QIMD Qatar Industrial Manufacturing Company 24-Apr-19 6 Due UDCD United Development Company 24-Apr-19 6 Due QCFS Qatar Cinema & Film Distribution Company 25-Apr-19 7 Due QAMC Qatar Aluminum Manufacturing Company 28-Apr-19 10 Due QNNS Qatar Navigation (Milaha) 28-Apr-19 10 Due IGRD Investment Holding Group 28-Apr-19 10 Due QFLS Qatar Fuel Company 28-Apr-19 10 Due MERS Al Meera Consumer Goods Company 28-Apr-19 10 Due BRES Barwa Real Estate Company 29-Apr-19 11 Due AHCS Aamal Company 29-Apr-19 11 Due SIIS Salam International Investment Limited 29-Apr-19 11 Due ZHCD Zad Holding Company 29-Apr-19 11 Due QGRI Qatar General Insurance & Reinsurance Company 29-Apr-19 11 Due AKHI Al Khaleej Takaful Insurance Company 29-Apr-19 11 Due MCCS Mannai Corporation 29-Apr-19 11 Due QOIS Qatar Oman Investment Company 29-Apr-19 11 Due DOHI Doha Insurance Group 29-Apr-19 11 Due ORDS Ooredoo 29-Apr-19 11 Due KCBK Al Khalij Commercial Bank 29-Apr-19 11 Due VFQS Vodafone Qatar 30-Apr-19 12 Due QGMD Qatari German Company for Medical Devices 30-Apr-19 12 Due DHBK Doha Bank 30-Apr-19 12 Due Source: QSE Stock Split Dates for Listed Qatari Companies Source: QSE
- 4. Page 4 of 9 News Qatar QSE announced stock split days for listed Qatari companies – Please refer to the table above (QSE) CBQK's bottom line rises 6.5% YoY and 6.8% QoQ in 1Q2019, in- line with our estimate – The Commercial Bank's (CBQK) net profit rose 6.5% YoY (+6.8% QoQ) to QR431.1mn in 1Q2019, in line with our estimate of QR425.0mn (variation of +1.4%). Net interest income decreased 11.9% YoY in 1Q2019 to QR580.6mn. However, on QoQ basis, net interest income rose 1.2%. The company's revenue came in at QR899.8mn in 1Q2019, which represents a decrease of 2.1% YoY. However, on QoQ basis, revenue rose 6.5%. The bank's total assets stood at QR144.0bn at the end of March 31, 2019, down 1.6% YoY. However, on QoQ basis, the bank's total assets increased 6.6%. Loans and advances to customers gained by 1.7% YTD to QR85.2bn. Customer deposits rose 14.4% YTD to reach QR81.6bn at the end of March 31, 2019. Earnings per share amounted to QR1.07 in 1Q2019 as compared to QR1.00 in 1Q2018. (QNB FS Research, QSE) MARK's bottom line rises 2.5% YoY and 9.2% QoQ in 1Q2019, in-line with our estimate – Masraf Al Rayan's (MARK) net profit rose 2.5% YoY (+9.2% QoQ) to QR544.2mn in 1Q2019, in line with our estimate of QR534.1mn (variation of +1.9%). Total net income from financing and investing activities increased 0.6% YoY and 1.6% QoQ in 1Q2019 to QR1.11bn. The company's total income came in at QR1.26bn in 1Q2019, which represents an increase of 2.1% YoY (+4.0% QoQ). The bank's total assets stood at QR100.3bn at the end of March 31, 2019, down 3.1% YoY. However, on QoQ basis, the bank's total assets increased 3.1%. Financing assets were QR75.9bn, registering a rise of 4.5% YoY (+4.6% QoQ) at the end of March 31, 2019. Customer current accounts rose 2.4% YoY and 6.6% QoQ to reach QR7.7bn at the end of March 31, 2019. EPS increased to QR0.726 in 1Q2019 from QR0.708 in 1Q2018. MARK’s return on average assets continues to be one of the highest in the market at 2.20%. Return on average shareholders’ equity of the bank reached 17.0%. Capital adequacy ratio, using Basel-III standards and QCB regulations, reached 19.28%. The bank’s operational efficiency ratio (cost to income ratio) stood at 22.78%. Non-performing financing (NPF) ratio reached 0.74%, reflecting very strong and prudent credit and risk management policies and procedures. (QNB FS Research, QSE, Peninsula Qatar) QIBK posts 9.6% YoY increase but 8.6% QoQ decline in net profit in 1Q2019, modestly beating our estimate – Qatar Islamic Bank's (QIBK) net profit rose 9.6% YoY (but declined 8.6% on QoQ basis) to QR685.2mn in 1Q2019, modestly beating our estimate of QR650.7mn (variation of +5.3%). Total net income from financing and investing activities increased 16.3% YoY and 12.4% QoQ in 1Q2019 to QR1.68bn. The company's total income came in at QR1.85.5bn in 1Q2019, which represents an increase of 13.0% YoY (+3.2% QoQ). The bank's total assets stood at QR155.3bn at the end of March 31, 2019, up 2.3% YoY (+1.4% QoQ). Financing assets were QR106.3bn, registering a rise of 1.6% YoY (+4.0% QoQ) at the end of March 31, 2019. Customers' current accounts declined 13.3% YoY and 2.0% QoQ to reach QR15.1bn at the end of March 31, 2019. EPS increased to QR2.90 in 1Q2019 from QR2.65 in 1Q2018. Total expenses of QR267.1mn for the three months’ period ended March 31, 2019 are 8.1% lower than QR290.7mn from a year ago. Strict cost controls supporting higher operating revenues enabled further enhancement of efficiency, bringing down the cost to income ratio to 23.2% for 1Q2019 as compared to 26.5% for 1Q2018. QIBK was able to maintain the ratio of non-performing financing assets to total financing assets at 1.2%, reflecting the quality of the bank’s financing assets portfolio and its effective risk management framework. QIBK continues to pursue the conservative impairment provisioning policy with the coverage ratio for non-performing financing assets at 100% as of March 2019. Total shareholders’ equity of the bank has reached QR14.9bn. Total Capital adequacy of the bank under Basel III guidelines is 18.7% as of March 2019, higher than the minimum regulatory requirements prescribed by Qatar Central Bank and the Basel Committee. (QNB FS Research, QSE, Gulf-Times.com) ABQK's bottom line rises 0.8% YoY and 38.9% QoQ in 1Q2019, in-line with our estimate – Ahli Bank's (ABQK) net profit rose 0.8% YoY (+38.9% QoQ) to QR177.5mn in 1Q2019, in line with our estimate of QR177.8mn (variation of -0.2%). Net interest income decreased 1.0% YoY and 0.2% QoQ in 1Q2019 to QR204.0mn. The company's total revenue came in at QR262.5mn in 1Q2019, which represents an increase of 0.6% YoY. However, on QoQ basis, total revenue fell 14.0%. Loans and advances to customers were QR28.0bn, registering a growth of 2.5% YTD. Deposits & CDs expanded by 12.4% YTD to QR24.8bn. (QNB FS Research, QSE) QATI to disclose 1Q2019 financial statements on April 28 – Qatar Insurance Company (QATI) announced its intent to disclose 1Q2019 financial statements for the period ended March 31, 2019, on April 28, 2019. (QSE) MCGS to disclose 1Q2019 financial statements on April 24 – Medicare Group (MCGS) announced its intent to disclose 1Q2019 financial statements for the period ended March 31, 2019, on April 24, 2019. (QSE) QFBQ changes the date of disclosure of first quarter financial statements to April 24 – Qatar First Bank (QFBQ) announced the change of the disclosure date of its first quarter financial statements to April 24, 2019. (QSE) AKHI’s AGM and EGM endorses items on its agenda and approves the distribution of 5% cash dividend – Al Khaleej Takaful Insurance Company (AKHI) announced the results of the AGM and EGM, which was held on April 17, 2019. The AGM approved the board of directors’ recommendation to distribute 5% cash dividends to shareholders. In the EGM following resolutions were approved: 1) Amending Article (3) of the Articles of Association concerning the company's purposes by adding the following paragraphs: a) extended warranty services: The company carries out extended warranty insurance for vehicles, equipment, electronic and electrical equipment. B) Selling insurance salvage: Sale of damaged cars, electrical and electronic equipment and all insurance salvage of any type. 2) Amending the Articles of Association in accordance with the decision of the board of directors of Qatar Financial Markets
- 5. Page 5 of 9 Authority issued on December16, 2018 regarding the stock split of the shares. (QSE) MoCI: Qatar to streamline investment, business initiatives – Qatar is streamlining investment and business initiatives by providing support for commercial companies as part of efforts to boost confidence and enhance partnerships with the private sector for building a competitive and diversified economy. This was announced by the Ministry of Commerce and Industry (MoCI) at a workshop 'Public Shareholding Companies Listed on the Stock Market'. Discussions focused on how to enhance cooperation to support listed companies and enhance their performance and contribution to the economy. At present, there are 46 listed companies on the local bourse and more are in the pipeline, including some family-owned enterprises. Moreover, there is also a junior bourse Venture Market with eased listing norms and conditions for the small and medium enterprises. (Gulf-Times.com) Qatar Manpower Solutions Company signs MoU with Ezdan Hotels Group – Qatar Manpower Solutions Company (Wisa) signed a Memorandum of Understanding (MoU) with Ezdan Hotels Group. As part of the agreement, Ezdan Hotels Group will provide intensive and varied workshops for trainees nominated by Wisa, run in conjunction with Ezdan Hotels Group’s core services related to the field of housework, etiquette and so on. Wisa’s CEO, Hussain Ali Al Hababi said, “This agreement marks the beginning of the desired cooperation between the two entities. We are keen to train and qualify individuals in basic skills according to the selected specialization, as well as guide and enhance skills in occupational health and safety, education, and awareness of the values and teachings of society.” (Peninsula Qatar) Britain a key business partner of QFC, says Al Jaida – Qatar Financial Centre (QFC) considers UK a key strategic business partner. With over 600 firms registered on the QFC platform, 94 companies are from the UK, according to QFC Authority’s CEO, Yousuf Mohamed Al Jaida. Welcoming the Lord Mayor of London, Alderman Peter Estlin and his delegation to Qatar recently, Jaida said, “Qatar and the UK have enjoyed a history of strong bilateral, trade and cultural relations. I am confident that Qatar’s relationship with the UK will further flourish as we continue to explore different avenues for mutual collaboration.” Organized by the Department of International Trade (DIT) at the British Embassy in Qatar, the Lord Mayor visited Doha as part of an official delegation themed, ‘Shaping Tomorrow’s City Today’, which focuses on digital innovation and smart cities. The Lord Mayor took part in a tour of Msheireb Downtown Doha (MDD), alongside Al Jaida, and other senior British officials. The new financial city and future headquarters of the QFC is considered the world’s first sustainable downtown regeneration project and soon to be the highest concentration of LEED (Leadership in Energy & Environmental Design) buildings in the world, distinguished by its high-tech infrastructure. The project is fully equipped to offer organizations sophisticated infrastructure that will further support their business growth. (Qatar Tribune) International US trade deficit hits eight-month low on weak Chinese imports – The US trade deficit fell to an eight-month low in February as imports from China plunged, temporarily providing a boost to President Donald Trump’s “America First” agenda and economic growth in the first quarter. The surprise second straight monthly narrowing in the trade gap reported by the Commerce Department was also driven by soaring aircraft exports, which are likely to reverse after Boeing halted deliveries of its troubled 737 MAX aircraft. MAX planes have been grounded indefinitely following two deadly crashes. Economists warned the trade deficit would remain elevated regardless of whether the US and China struck a trade deal that was to the White House’s liking because of Americans’ insatiable appetite for cheaper imports. The trade deficit tumbled 3.4% to $49.4bn in February, the lowest level since June 2018. Economists polled by Reuters had forecasted the trade shortfall widening to $53.5bn in February. The politically sensitive goods trade deficit with China - a focus of the Trump administration’s protectionist trade policy - decreased 28.2% to $24.8bn in February as imports from the world’s No. 2 economy plunged 20.2%. US exports to China jumped 18.2% in February. (Reuters) MBA: US purchase mortgage activity hits nine-year high – Applications to US lenders seeking loans to buy a home climbed to their highest level in almost nine years last week even as mortgage rates increased for a second week, according to the Mortgage Bankers Association (MBA). The Washington-based group’s seasonally-adjusted barometer on purchase mortgage activity, which is seen as a proxy on future housing activity, edged up 0.9% to 280.7 in the week of April 12, marking its strongest reading since 291.3 in the week of April 30, 2010. Interest rates on conforming 30-year mortgages, with loan balances of $484,350 or less, averaged 4.44% last week, up 4 basis points from the prior week, MBA stated. Other mortgage rates MBA tracks on average increased anywhere from 1 basis points to 10 basis points. Home loan rates rose in step with rising bond yields, as investors pared their bond holdings on less dismal data from China, Europe and the US. On the other hand, refinancing applications fell 8.2% to 1,453.0 in the last week on a seasonally adjusted basis, MBA stated. (Reuters) US labor market remains tight, economy continues to grow – Labor markets remained tight across the US as businesses struggled to find skilled workers and wages grew modestly, the Federal Reserve stated in its latest report on the economy. The US central bank’s ‘Beige Book’ report, a glimpse of the economy based on conversations with business contacts across all 12 of the Fed’s districts, found economic activity grew at a slight-to- moderate pace in March and early April. A few districts reported some strengthening in economic growth. Prices have risen modestly since the last Beige Book, with tariffs, freight costs and rising wages often cited as key factors, the Fed stated. It added that consumer spending was mixed but suggested sluggish sales for both general retailers and auto dealers. Wages grew moderately in most districts for both skilled and unskilled workers, with only three reporting slight growth in workers’ pay. Businesses in most districts reported shortages of skilled workers, mainly in manufacturing and construction, but also in technical and professional roles. Companies have responded to the tight labor market by boosting bonuses and benefits packages, along with raising wages moderately, according to the report. (Reuters)
- 6. Page 6 of 9 London slump drags UK house price growth to more than six- year low – British house prices rose at the weakest rate in six- and-a-half years in February, dragged down by London’s biggest price slump in a decade as Brexit uncertainty sent chills through the property market. Official data also showed Britain’s consumer price inflation unexpectedly held just below the Bank of England’s 2% target in March, offering relief to consumers whose spending has helped Britain’s economy through the Brexit crisis. House prices were just 0.6% higher in February than a year ago, slowing sharply from 1.7% annual rise in January, the Office for National Statistics (ONS) stated. In London, house prices were down by 3.8% - the biggest drop since mid-2009. The malaise in the capital spread to the south- east of England, where prices fell for the first time since 2011. (Reuters) European Union’s goods trade surplus with US grows, deficit with China widens – The European Union’s (EU) trade surplus in goods with the US increased in the first two months of 2019 while its deficit with China widened, figures that could increase global economic tensions. The European Union’s surplus with the US grew to EUR21.6bn in January-February 2019 from EUR20.9bn in the same period of 2018, EU statistics office Eurostat reported. With China, the EU’s trade deficit expanded to EUR37.8bn from EUR35.5bn. The US has hit the European Union with tariffs and threatened more in complaint over the trade balance. Both Washington and Brussels have also complained that China wants free trade without playing fair. Overall, the goods trade deficit of the 28-nation bloc increased to EUR28.4bn in January-February 2019 from EUR20.7bn a year earlier. Energy imports were the chief cause of the deficit, especially from Russia and Norway. For the narrower 19- country Eurozone, exports grew by 4.4% YoY in February and imports by 4.0%, leading to an expansion of its trade surplus to EUR17.9bn in February from EUR16.5bn a year earlier. On a seasonally adjusted basis, the Eurozone’s trade surplus also increased to EUR19.5bn in February from EUR17.4bn in January as exports fell by 1.4% and imports declined by 2.7%. (Reuters) Japan manufacturers' mood slumps to two-and-a-half-year low – Japanese manufacturers’ business confidence slipped to a two-and-a-half-year low in April, a Reuters poll showed, underlining growing concerns the economy could slip into a recession in the face of slowing external demand. The monthly poll, which tracks the Bank of Japan’s (BoJ) closely watched tankan quarterly survey, found the service-sector mood up for the first time in four months, which may help ease some of the pressure on the world’s third-biggest economy. Manufacturers’ mood is expected to rebound over the coming three months and service-sector morale is also seen edging up slightly, although the pace of recovery appears weak. Subdued business confidence - on top of weakness in factory output and exports - has raised the specter of a downturn, although BoJ’s Governor, Haruhiko Kuroda has maintained a relatively sanguine view on the economy in a signal that policy will remain steady at next week’s rate-review. (Reuters) BoJ warns of overheating in real estate loans for first time in two decades – Bank of Japan (BoJ) issued a warning for the first time in 20 years that financial institutions may be over- extending real estate loans, a sign that years of ultra-low interest rates is prodding banks to move into riskier lending to make profits. Nearly 60% of regional banks could suffer net losses a decade from now if corporate borrowing keeps falling at the current trend; the central bank stated in a semi-annual report on Japan’s banking system. The report, which is among key factors the BoJ’ board will scrutinize in deciding monetary policy, highlights the mounting demerits of prolonged monetary easing such as the damage it is inflicting on financial institutions’ profits. (Reuters) Regional ICAEW: GCC to see marginal economic growth in 2019 – The GCC is expected to post economic growth of 2.3% in 2019, a marginal improvement on the previous year of 0.3 percentage points, according to ICAEW’s latest Economic Insight report. The GCC economy will be weighed down by renewed OPEC-plus oil production cuts and lower oil prices, with the main source of growth coming from the non-oil sector, it stated. Economic Insight: Middle East 1Q2019, produced by Oxford Economics, has stated that despite a strong drive in recent years by GCC authorities to diversify their economies, oil continues to play a dominant role, constituting up to 46% cent of total GDP. As such, the renewal of the OPEC-plus oil production cuts will limit the oil sector’s contribution to overall growth in 2019. The non- oil sector in the GCC is expected to be the primary engine of growth in 2019, forecast to grow by 3.1%. This will be supported by higher government spending, notably in the UAE and Saudi Arabia, continued reforms and project spending like Qatar’s 2022 World Cup and the UAE’s Expo 2020, as well as stimulus plans geared to support the private sector. (Zawya) Chinese tech investors turn attention to GCC – With the potential opportunities for tech in investments in Southeast Asia market starting to become saturated, a number of Chinese investors are increasingly turning towards the MENA region. The tech investors are now spreading across the GCC; and Venture Capitalists (VCs) are turning their attention to Middle East. The investors are interested in e-commerce, entertainment, leisure, technology, logistics and Fintech, noted a report released as part of the recently concluded World Economic Forum (WEF) Middle East and North Africa, in Jordan. With total internet penetration surpassing 60% in the Middle East, representing more than 150mn users, Chinese venture capitalists (VC) and angel investors are starting to take notice of the region. Unlike some other central parts of the Belt and Road Initiative (BRI) regions, such as sub-Saharan Africa, the MENA region has relatively stable digital and physical infrastructure, the WEF report noted. (Peninsula Qatar) FBCG and PwC publish guide to help GCC family businesses – Family Business Council – Gulf (FBCG), a regional association of the Family Business Network (FBN) have launched a guide in co-operation with PricewaterhouseCoopers (PwC) to help family businesses in the Middle East successfully plan and navigate scenarios of shareholder exit in the family business. For family-owned businesses in the Middle East, and the GCC in particular, handover from the first to the second generation, and increasingly from the second to the third generation can present unique challenges, which can have tremendous implications on the sustainability and growth of many of the region’s largest companies. The newly published guide provides
- 7. Page 7 of 9 a roadmap through succession challenges, and is designed to help family businesses navigate potential divergence and differences in family members’ interests and goals, understand the opportunities and challenges of the shareholder exit process, and plan for an optimized outcome that preserves both business continuity and family unity. (Peninsula Qatar) EMEA ultra-high net worth investors remain optimistic about global markets – Many Europe, the Middle East and Africa’s (EMEA) ultra-high net worth investors (39%) continue to believe equities will be the best performing asset class over the next 12 months, according to J.P. Morgan’s Spring Private Client Survey. Despite on-going global uncertainty, investor sentiment has remained largely unchanged since the winter Private Client Surveyi, however with increased volatility expectations for 2019, many investors are now beginning to adopt a more defensive investment approach. (Peninsula Qatar) Islamic Development Bank set to raise $1.5bn in five-year Sukuk – The Islamic Development Bank (IsDB) is set to raise $1.5bn with five-year Sukuk, a document issued by one of the banks leading the deal showed. The Jeddah-based triple A-rated institution’s notes offer 40 basis points over mid-swaps to investors. Credit Agricole CIB, Emirates NBD Capital, First Abu Dhabi Bank, Gulf International Bank, HSBC, JPMorgan, Natixis and Standard Chartered are the joint lead managers. (Reuters) Saudi Aramco plans to buy Shell's stake in Saudi Arabian refining Joint Venture – Saudi Aramco plans to buy Royal Dutch Shell’s 50% stake in Saudi Arabian refining complex SASREF, a joint venture between the firms, sources said. Sources said that an agreement has been reached between Saudi Aramco and Shell. Saudi Aramco Shell Refinery Company (SASREF), based in Jubail Industrial City in Saudi Arabia, has a crude oil refining capacity of 305,000 bpd. Shell has sold over $30bn of assets in recent years as it shift its focus to lower carbon businesses such as natural gas and petrochemicals. Energy Intelligence first reported the stake purchase plan. (Reuters) Reliance said to weigh refinery stake sale to Saudi Aramco and ADNOC – Indian billionaire Mukesh Ambani’s Reliance Industries Ltd. is considering selling as much as 25% of its refinery business in a deal that could fetch at least $10bn, sources said. Reliance is sounding out potential investors including state-owned Saudi Aramco and Abu Dhabi National Oil Company (ADNOC) to gauge their interest, according to sources. Middle Eastern oil giants like Saudi Aramco and ADNOC have been expanding into downstream operations as they seek to move from being pure producers to becoming more integrated energy companies. (Bloomberg) Alinma Bank recovers $10bn tag amid corporate lending push – Alinma Bank has recovered a $10bn valuation lost more than four years ago as the Saudi Arabian lender expands its share of the domestic corporate loans market. Alinma Bank’s market capitalization has exceeded the threshold on April 11 for the first time since 2014, after a 29% gain in its stock in the past year. The lender is one of just 13 members of the $10bn -club among the 191 constituents of the Tadawul All Share Index. Alinma Bank is a Shari’ah-compliant lender based in Riyadh, with 90 branches in the country. (Bloomberg) UAE to cultivate coral reefs to boost biodiversity and economy – The UAE is to develop a 74-acre coral reef garden, where 1.5mn coral colonies will be cultivated over the next five years, the UAE’s climate change and Environment Minister, Thani Al Zeyoudi announced on April 14. The project is part of the UAE’s focus on preserving biodiversity, as part of the government’s Vision 2021 strategic plan. It is one of the several protected areas designed to sustain fish stocks, maintain the local fishing industry, and encourage ecotourism. The reef could provide a safe haven for local fish species, boosting their populations by protecting eggs and larvae from predators and strong water currents that threaten their survival. The Fujairah Cultured Coral Reef Gardens will also help to boost food diversity and food security by sustaining fish populations within the corals reefs and allowing stocks to grow, he said. (Bloomberg) CBD posts 21.6% YoY rise in net profit to AED340.1mn in 1Q2019 – Commercial Bank of Dubai (CBD) recorded net profit of AED340.1mn in 1Q2019, an increase of 21.6% YoY. Net interest income and income from Islamic financing rose 7.7% YoY to AED493.0mn in 1Q2019. Total operating income rose 17.6% YoY to AED774.1mn in 1Q2019. Total assets stood at AED76.2bn at the end of March 31, 2019 as compared to AED74.1bn at the end of December 31, 2018. Loans and advances and Islamic financing (net) stood at AED51.8bn (+1.7% QoQ), while customers’ deposits and Islamic customer deposits stood at AED54.6bn (+2.7% QoQ) at the end of March 31, 2019. EPS came in at AED0.12 in 1Q2019 as compared to AED0.10 in 1Q2018. (DFM) EMIRATES NBD posts 15.0% YoY rise in net profit to AED2,743.4mn in 1Q2019 – Emirates NBD Bank (EMIRATES NBD) recorded net profit of AED2,743.4mn in 1Q2019, an increase of 15.0% YoY. Net interest income rose 14.6% YoY to AED2,893.0mn in 1Q2019. Total operating income rose 14.9% YoY to AED4,716.8mn in 1Q2019. Total assets stood at AED525.8bn at the end of March 31, 2019 as compared to AED500.3bn at the end of December 31, 2018. Loans and receivables stood at AED287.2bn (+3.3% QoQ), while customers’ deposits stood at AED301.0bn (+3.5% QoQ) at the end of March 31, 2019. EPS came in at AED0.47 in 1Q2019 as compared to AED0.40 in 1Q2018. (DFM) EIB posts 97.1% YoY rise in net profit to AED411.1mn in 1Q2019 – Emirates Islamic Bank (EIB) recorded net profit of AED411.1mn in 1Q2019, an increase of 97.1% YoY. Net income from financing and investment products rose 13.5% YoY to AED443.9mn in 1Q2019. Total operating income rose 12.5% YoY to AED663.5mn in 1Q2019. Total assets stood at AED60.6bn at the end of March 31, 2019 as compared to AED58.4bn at the end of December 31, 2018. Financing receivables stood at AED36.4bn (+0.7% QoQ), while customers’ deposits stood at AED43.4bn (+4.4% QoQ) at the end of March 31, 2019. EPS came in at AED0.076 in 1Q2019 as compared to AED0.038 in 1Q2018. (DFM) Abu Dhabi allows foreigners to own freehold properties in investment areas – Abu Dhabi will now allow all foreigners to own land and property in investment areas on a freehold basis after making changes to its real estate law, state news agency WAM reported. Abu Dhabi previously limited ownership largely to Emiratis and citizens of the neighboring GCC states. Residential units in investment areas will now be registered under Abu Dhabi’s freehold law, according to Abu Dhabi real
- 8. Page 8 of 9 estate firm Aldar Properties, citing a government statement. Previously, foreign investors in Abu Dhabi were largely restricted to 99-year leases, it stated. “This will not only further drive the maturity of Abu Dhabi’s real estate market, however will also increase transparency and provide clarity of title for property owners, increasing long term investment, injecting more liquidity into the market and encouraging longer term residency,” Aldar CEO, Talal Al Dhiyebi said. Aldar announced a recently launched residential project on Abu Dhabi’s Yas Island, where land and property can be sold to all nationalities, has sold out and generated over $109mn in sales. The oil rich Emirate’s revenues have been hit in recent years by lower oil prices as the government prioritized diversifying its economy into other sectors such as tourism. Abu Dhabi property prices fell by 6.4% in the fourth quarter compared to corresponding period, the Central Bank of the UAE (CBUAE) stated in a report. Last year, Abu Dhabi announced a $13.6bn economic stimulus package and other economic initiatives. Abu Dhabi is the wealthiest of the seven Emirates that make up the UAE federation. The UAE economy grew by around 1.7% in 2018, slower than projected despite a boost from higher oil prices, according to official preliminary data. (Reuters) Kuwait’s March real estate sales at KD289.1mn, a fall of 2% MoM – Ministry of Justice in Kuwait City published data on real estate transactions registered by the Ministry from March 3 to March 28 which showed that the real estate sales came in at KD289.1mn, representing a fall of 2% MoM. Residential sales came in at KD163.9mn in March as compared to KD113.2mn in February. Investments came in at KD82.5mn in March as compared to KD75.8mn in February. (Bloomberg) NBB posts 3.6% YoY rise in net profit to BHD20.4mn in 1Q2019 – National Bank of Bahrain (NBB) recorded net profit of BHD20.4mn in 1Q2019, an increase of 3.6% YoY. Net interest income rose 21.4% YoY to BHD23.8mn in 1Q2019. Total operating income rose 13.6% YoY to BHD34.2mn in 1Q2019. Total assets stood at BHD3.2bn at the end of March 31, 2019 as compared to BHD3.0bn at the end of March 31, 2018. Loans and advances stood at BHD1.1bn (-9.6% YoY), while customers’ deposits stood at BHD2.2bn (+5.2% YoY) at the end of March 31, 2019. EPS remained flat YoY at BHD0.013 in 1Q2019. (Bahrain Bourse)
- 9. Contacts Saugata Sarkar, CFA, CAIA Shahan Keushgerian Zaid al-Nafoosi, CMT, CFTe Head of Research Senior Research Analyst Senior Research Analyst Tel: (+974) 4476 6534 Tel: (+974) 4476 6509 Tel: (+974) 4476 6535 saugata.sarkar@qnbfs.com.qa shahan.keushgerian@qnbfs.com.qa zaid.alnafoosi@qnbfs.com.qa Mehmet Aksoy, PhD QNB Financial Services Co. W.L.L. Senior Research Analyst Contact Center: (+974) 4476 6666 Tel: (+974) 4476 6589 PO Box 24025 mehmet.aksoy@qnbfs.com.qa Doha, Qatar Disclaimer and Copyright Notice: This publication has been prepared by QNB Financial Services Co. W.L.L. (“QNB FS”) a wholly-owned subsidiary of Qatar National Bank (Q.P.S.C.). QNB FS is regulated by the Qatar Financial Markets Authority and the Qatar Exchange. Qatar National Bank (Q.P.S.C.) is regulated by the Qatar Central Bank. This publication expresses the views and opinions of QNB FS at a given time only. It is not an offer, promotion or recommendation to buy or sell securities or other investments, nor is it intended to constitute legal, tax, accounting, or financial advice. QNB FS accepts no liability whatsoever for any direct or indirect losses arising from use of this report. Any investment decision should depend on the individual circumstances of the investor and be based on specifically engaged investment advice. We therefore strongly advise potential investors to seek independent professional advice before making any investment decision. Although the information in this report has been obtained from sources that QNB FS believes to be reliable, we have not independently verified such information and it may not be accurate or complete. QNB FS does not make any representations or warranties as to the accuracy and completeness of the information it may contain, and declines any liability in that respect. For reports dealing with Technical Analysis, expressed opinions and/or recommendations may be different or contrary to the opinions/recommendations of QNB FS Fundamental Research as a result of depending solely on the historical technical data (price and volume). QNB FS reserves the right to amend the views and opinions expressed in this publication at any time. It may also express viewpoints or make investment decisions that differ significantly from, or even contradict, the views and opinions included in this report. This report may not be reproduced in whole or in part without permission from QNB FS. COPYRIGHT: No part of this document may be reproduced without the explicit written permission of QNB FS. Page 9 of 9 Rebased Performance Daily Index Performance Source: Bloomberg Source: Bloomberg Source: Bloomberg (#Market was closed on April 17, 2019) Source: Bloomberg (*$ adjusted returns, #Market was closed on April 17, 2019) 45.0 70.0 95.0 120.0 Mar-15 Mar-16 Mar-17 Mar-18 Mar-19 QSEIndex S&P Pan Arab S&P GCC 1.1% 0.5% (1.2%) 0.1% (0.2%) 0.4% 0.8% (1.5%) (1.0%) (0.5%) 0.0% 0.5% 1.0% 1.5% SaudiArabia Qatar Kuwait Bahrain Oman AbuDhabi Dubai Asset/Currency Performance Close ($) 1D% WTD% YTD% Global Indices Performance Close 1D%* WTD%* YTD%* Gold/Ounce 1,274.01 (0.2) (1.3) (0.7) MSCI World Index 2,160.94 (0.1) 0.1 14.7 Silver/Ounce 14.99 (0.1) 0.1 (3.3) DJ Industrial 26,449.54 (0.0) 0.1 13.4 Crude Oil (Brent)/Barrel (FM Future) 71.62 (0.1) 0.1 33.1 S&P 500 2,900.45 (0.2) (0.2) 15.7 Crude Oil (WTI)/Barrel (FM Future) 63.76 (0.5) (0.2) 40.4 NASDAQ 100 7,996.08 (0.1) 0.1 20.5 Natural Gas (Henry Hub)/MMBtu# 2.66 0.0 (3.3) (16.5) STOXX 600 389.59 0.2 0.5 13.8 LPG Propane (Arab Gulf)/Ton 62.50 (1.2) (6.0) (2.3) DAX 12,153.07 0.5 1.2 13.6 LPG Butane (Arab Gulf)/Ton 66.00 (0.8) (2.6) (5.0) FTSE 100 7,471.32 (0.1) 0.1 13.6 Euro 1.13 0.1 (0.0) (1.5) CAC 40 5,563.09 0.7 1.1 16.0 Yen 112.06 0.1 0.0 2.2 Nikkei 22,277.97 0.3 1.9 9.7 GBP 1.30 (0.0) (0.2) 2.3 MSCI EM 1,096.39 0.3 0.7 13.5 CHF 0.99 (0.3) (0.8) (2.9) SHANGHAI SE Composite 3,263.12 0.7 2.6 34.6 AUD 0.72 0.1 0.1 1.8 HANG SENG 30,124.68 (0.0) 0.7 16.4 USD Index 97.01 (0.0) 0.0 0.9 BSE SENSEX# 39,275.64 0.0 0.9 9.1 RUB 63.86 (0.4) (0.8) (8.4) Bovespa 93,284.75 (2.0) (0.5) 4.5 BRL 0.25 (0.9) (1.5) (1.5) RTS 1,265.51 0.8 1.0 18.4 103.5 96.6 82.8