Mira Road Memorable Call Grls Number-9833754194-Bhayandar Speciallty Call Gir...
26 September Daily Technical Trader
1. Page 1 of 2
TECHNICAL ANALYSIS: QE INDEX AND KEY STOCKS TO CONSIDER
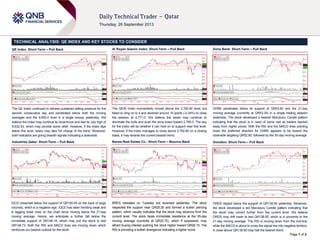
QE Index: Short-Term – Pull Back
The QE Index continued to witness sustained selling pressure for the
second consecutive day and penetrated below both the moving
averages and the 9,600.0 level in a single swoop yesterday. We
believe the index may continue its downmove and test its July high of
9,532.43, which may provide some relief. However, if the index dips
below this level, bears may take full charge of the trend. Moreover,
both indicators are giving bearish signals indicating a downside.
Industries Qatar: Short-Term – Pull Back
IQCD breached below the support of QR150.45 on the back of large
volumes, which is a negative sign. IQCD has been trending weak and
is tagging lower lows on the chart since moving below the 21-day
moving average. Hence, we anticipate a further fall below the
immediate support of QR148.18, which may pull the stock to test
QR146.73. Both the RSI and MACD lines are moving down which
reinforces our bearish outlook for the stock.
Al Rayan Islamic Index: Short-Term – Pull Back
The QERI Index momentarily moved above the 2,782.80 level, but
failed to cling on to it and declined around 10 points (-0.34%) to close
the session at 2,771.0. We believe the bears may continue to
dominate the bulls and push the price lower toward 2,760.0. The key
for the index will be whether it can hold on to support near this level.
However, if the index manages to close above 2,782.80 on a closing
basis, it may reverse the current bearish trend.
Barwa Real Estate Co.: Short-Term – Bounce Back
BRES retreated on Tuesday but reversed yesterday. The stock
respected the support near QR25.20 and formed a bullish piercing
pattern, which usually indicates that the stock may advance from the
current level. The stock faces immediate resistance at the 55-day
moving average (currently at QR25.72), which if surpassed, may
attract buying interest pushing the stock higher toward QR26.10. The
RSI is providing a bullish divergence indicating a higher move.
Doha Bank: Short-Term – Pull Back
DHBK penetrated below its support of QR53.60 and the 21-day
moving average (currently at QR53.34) in a single trading session
yesterday. The stock developed a bearish Marubozu Candle pattern
indicating that the stock is in need of some rest as traders backed
away from higher prices. With the RSI and the MACD lines pointing
lower the preferred direction for DHBK appears to be toward the
downside targeting QR52.80, followed by the 55-day moving average.
Ooredoo: Short-Term – Pull Back
ORDS dipped below the support of QR139.90 yesterday. Moreover,
the stock developed a red Marubozu Candle pattern indicating that
the stock may correct further from the current level. We believe
ORDS may drift lower to test QR138.50, which is in proximity to the
21-day moving average. The RSI is moving down from the mid-line,
while the MACD is about to cross the signal line into negative territory.
A close above QR139.90 may halt the bearish trend.
2. Contacts
Saugata Sarkar Ahmed M. Shehada Keith Whitney Sahbi Kasraoui QNB Financial Services SPC
Head of Research Head of Trading Head of Sales Manager - HNWI Contact Center: (+974) 4476 6666
Tel: (+974) 4476 6534 Tel: (+974) 4476 6535 Tel: (+974) 4476 6533 Tel: (+974) 4476 6544 PO Box 24025
saugata.sarkar@qnbfs.com.qa ahmed.shehada@qnbfs.com.qa keith.whitney@qnbfs.com.qa sahbi.alkasraoui@qnbfs.com.qa Doha, Qatar
DISCLAIMER: This publication has been prepared by QNB Financial Services SPC (“QNBFS”) a wholly-owned subsidiary of Qatar National Bank (“QNB”). QNBFS is regulated by the Qatar Financial Markets Authority and the Qatar Exchange; QNB is
regulated by the Qatar Central Bank. This publication expresses the views and opinions of QNBFS at a given time only. It is not an offer, promotion or recommendation to buy or sell securities or other investments, nor is it intended to constitute legal,
tax, accounting, or financial advice. We therefore strongly advise potential investors to seek independent professional advice before making any investment decision. Although the information in this report has been obtained from sources that QNBFS
believes to be reliable, we have not independently verified such information and it may not be accurate or complete. While this publication has been prepared with the utmost degree of care by our analysts, QNBFS does not make any representations or
warranties as to the accuracy and completeness of the information it may contain, and declines any liability in that respect. QNBFS reserves the right to amend the views and opinions expressed in this publication at any time. It may also express
viewpoints or make investment decisions that differ significantly from, or even contradict, the views and opinions included in this report.
COPYRIGHT: No part of this document may be reproduced without the explicit written permission of QNBFS.
Page 2 of 2
*These stocks are today’s suggested ideas
Overall Methodology: The charts and descriptions on Page 1 provide an indicative view of the future direction of the equities mentioned. The table on page 2 has been provided to denote historical movements in certain stocks. The historical trend analysis uses 21- and 55-
day SMAs for indicating short-term and long-term trends, respectively. Based on these SMAs, the historical direction of the trend is denoted as UP, DOWN or FLAT.
Selection of Key Stocks of the Day: Key stocks’ selection is based on our analysis of 19 members of the QE Index (excludes QNBK QD). Analysis includes identifying trends (short-term as well as long-term), patterns and support/resistance levels.
Trend Direction: The methods used to determine trend direction are subjective in nature. We use 21-day SMA and 55-day SMA, absolute price movements, price movements relative to SMAs and accurately drawn trend lines and chart patterns to determine the short- and
long-term trends.
Investment Horizon: The definition of short term and long term depends upon investors’ preferences and their investment objectives. As a rule of thumb, the time horizon for traders/short-term trend is 1-3 weeks while it is 1-3 months for investors/long-term trend.
Combining Technical and Fundamental Analysis: Investors can combine technical analysis (TA) with fundamental analysis (FA) to maximize their investment returns. While the “True Value” of stocks could be estimated by FA, the entry and exit timings could be fine
tuned using technical analysis to benefit from short-term movements in stock prices.
Trading Tactics: The trend direction should be analyzed based on the time-horizon of your investments. In general, investors attempt selling close to resistance levels during a downtrend and attempt buying close to support levels during uptrend.
Definitions:
1> Simple Moving Average (SMA): A SMA is the average of the closing price of a security for a given period.
2> RSI (Relative Strength Index): A technical momentum indicator that ranges from 0 to 100 and compares the stock’s recent price movements by evaluating recent gains and losses. Stocks with RSI above 70 could be considered overbought and below 30 could be
considered oversold. If the RSI falls below 70, it is a bearish signal. On the other hand, if the RSI rises above 30 it is considered bullish. We use a RSI of 14 days.
3> MACD (Moving Average Convergence Divergence): MACD denotes the relationship between two moving averages, which is used to spot changes in strength, direction, momentum and duration of a stock price trend. The MACD is calculated by subtracting the 26-day
exponential moving average (EMA) from the 12-day EMA. A nine-day EMA of the MACD, called the signal line, is also plotted on top of the MACD, functioning as a trigger for buy/sell signals. The MACD line above the signal line provides a positive signal and vice versa.
Name (Ticker) Last Close Trend Support Resistance
Short Term Long Term First Second First Second
Qatar Exchange Index (QE Index) 9,596.34 DOWN DOWN 9,500.00 9,440.00 10,200.00 10,350.00
Al Rayan Islamic Index (QERI Index) 2,771.00 UP DOWN 2,700.00 2,600.00 2,950.00 3,000.00
Banks and Financial Services
Masraf Al Rayan (MARK QD) 29.00 UP UP 24.00 23.20 31.40 33.00
Commercial Bank of Qatar (CBQK QD) 68.00 FLAT DOWN 63.90 62.40 84.20 87.20
Doha Bank (DHBK QD)* 53.10 UP UP 42.00 39.50 57.14 58.00
Qatar Islamic Bank (QIBK QD) 68.40 FLAT DOWN 65.00 64.30 78.50 79.60
Qatar International Islamic Bank (QIIK QD) 55.80 DOWN FLAT 47.90 45.00 60.80 61.50
Al Khalij Commercial Bank (KCBK QD) 18.52 DOWN UP 16.05 15.85 19.90 20.75
National Leasing Holding Co. (NLCS QD) 35.00 UP FLAT 32.00 31.00 43.90 45.00
Consumer Goods and Services
Widam Food Co. (WDAM QD) 52.50 UP DOWN 47.50 46.70 69.10 78.50
Industrials
Industries Qatar (IQCD QD)* 148.50 DOWN DOWN 144.10 142.00 175.20 176.80
Qatar Electricity & Water Co. (QEWS QD) 155.00 UP FLAT 140.00 132.10 172.00 174.00
Gulf International Services (GISS QD) 51.10 UP UP 30.50 29.50 54.00 55.90
Qatari Investors Group (QIGD QD) 29.40 UP UP 20.36 20.00 31.80 33.50
Real Estate
Barwa Real Estate Co. (BRES QD)* 25.50 UP FLAT 22.80 19.50 29.25 29.90
United Development Co. (UDCD QD) 21.66 UP FLAT 17.06 16.00 25.30 25.90
Mazaya Qatar Real Estate Development (MRDS QD) 11.58 UP UP 10.17 9.42 12.65 13.20
Telecom
Ooredoo (ORDS QD)* 139.20 UP UP 108.00 98.10 146.00 148.00
Vodafone Qatar (VFQS QD) 9.07 UP FLAT 8.50 8.24 9.98 10.20
Transportation
Nakilat (QGTS QD) 19.46 UP UP 15.08 14.52 21.15 21.70
Milaha (QNNS QD) 80.40 UP UP 58.20 56.70 84.90 86.50