SlideShare ist ein Scribd-Unternehmen logo
1 von 4
Beyond profit: should businesses be
facing up to inequality?
Visit our blog for periodic updates at:
pwc.blogs.com/economics_in_business
Global Economy Watch
April 2014
At a glance…
Inequality is on the agenda for
advanced economies…
In April, policymakers from around the
world will gather in Washington DC to
take stock of the global economy. Even
though the numbers show the recovery
is underway, rising inequality in many
advanced economies mean the benefits
of economic growth are not being felt
equally.
…although this isn’t a new story
Inequality has been rising for more
than 20 years. We think global
economic trends can help explain why.
Our “Megatrends” framework looks at
global trends that are having a major
influence on the economy today, and
will still be important over the next
decade. They permeate all areas of the
economy and society.
We think two Megatrends have
contributed to the rise in inequality:
• Technological breakthroughs,
which reduce the importance of
labour in the production process,
whilst increasing the rewards to
those with world class skills.
• The shift in global economic
power, which has previously led to
“off-shoring” of lower-skilled jobs to
the East. Though as wages in the East
are rising we could soon see a partial
reversal of this trend.
Our CEO survey suggests that 75% of
leaders believe their firm has a wider
role to play in society and inequality is
emerging as a key issue to address.
Is China’s growth at risk?
2014 could be a landmark year for
China. Sweeping reforms agreed at the
12th National People’s Congress affect
practically all sectors. However, recent
disappointing data on exports and
investment suggest the reaffirmed
7.5% GDP growth target could be at
risk.
The potential fallout from China’s
decade-long credit boom is a major
downside risk, given the strong
interlinkages between banks, state
corporations and local government.
Further defaults and financial market
volatility could slow down, or even
halt, China’s reform agenda.
A “swings and roundabouts” UK
budget
A continuing large structural deficit
meant George Osborne didn’t have
room for significant giveaways when
he delivered his Budget on 19th
March. Though there were some
measures that will support UK
business, such as a rise in the amount
of export finance available and help
with energy costs, they are unlikely to
have a major impact at the
macroeconomic level.
Fig 1: Inequality rose in each of the G7 advanced economies
between the middle of the 1980s and the late 2000s
Source: OECD
Note: France c.1985 value is from 1996
0.2
0.3
0.4
Canada Germany France Italy Japan UK US
Ginicoefficient
c.1985 c.2010
Moreunequal
Economic update: swings and roundabouts UK budget won’t
have a big macroeconomic impact
The economic recovery is underway in the UK. The OBR has
updated its forecasts for GDP growth to 2.7% in 2014 and 2.3% in
2015, very similar to the projections in our latest UK Economic
Outlook report of 2.6% this year and 2.4% next year.
Headline borrowing forecasts were down, but the structural
budget deficit remains relatively large in the UK, as shown in
Figure 2. The Chancellor therefore had limited room for
manoeuvre and delivered a ‘swings and roundabouts’ Budget
where ‘giveaways’ were broadly balanced by ‘takeaways’. which
impacts the micro level of the economy more than the macro level.
There is a lot more austerity to come, as reflected by the
Chancellor’s new welfare spending cap, and projected real
government spending cuts stretching out to 2018/19.
Nonetheless, the Chancellor did announce some pro-growth
measures which will provide a boost for business, including cuts in
energy costs, a temporary rise in tax allowances for investment
and more and cheaper export credit finance. While welcome, these
measures are unlikely to be large enough to change the
macroeconomic outlook for the UK economy as a whole.
More details of this report are available at:
http://www.pwc.co.uk/ukeo
Fig 2: Of the G7 and peripheral Eurozone economies, only
Japan has a bigger structural deficit than the UK
Source: OECD
Could downside risks derail China’s
growth?
China has seen a substantial credit-fuelled investment boom over
the past decade. Credit to the private non-financial sector has
grown from around 100% of GDP in 2000 to around 180% in
2013. This rate of increase is more dramatic than in most of the
crisis-hit nations in the Eurozone.
Deleveraging ahead
Borrowing to invest (especially in a developing economy like
China) is not a bad thing, provided that investment brings future
economic benefits. However, non-performing loan levels at a 2
year high suggest this has not always been the case and
underlines the need to rein in lending . This has already begun:
new total social financing (a broad measure of liquidity and
credit) fell more than 50% to 938.7 billion yuan in February from
the previous month.
A hard or soft landing?
A raft of disappointing recent data suggests the risk of an
economic slowdown in China this year. The latest purchasing
managers’ index for manufacturing fell for the fourth consecutive
month in March to a 7-month low. Annual growth in industrial
output fell to 8.6% - strong by Western standards but the
weakest growth rate for China since the global financial crisis.
Investment fell 17.9% year-on-year, its weakest pace since 2000.
Exports also disappointed, falling by 18.1% in February, even
after accounting for distortions caused by the Lunar New Year
celebrations .
Finally, interbank markets have been unusually volatile. Banks
suffered a liquidity crunch in December when interbank lending
rates almost hit 10%. A “western-style” credit crunch is unlikely
given the state’s involvement in the banking system, as
subsequent intervention by the central bank showed. But
continuing volatility could mean higher lending rates for riskier
borrowers, including SMEs.
An ambitious reform agenda
2014 is looking like a landmark year for reform in China across
many sectors as the government seeks to reduce over-capacity of
production. The historic default of Chaori (an otherwise
unimportant solar cell maker) is indicative of the increasing
liberalisation of markets. However, there are concerns that these
reforms may be watered down in light of downside risks.
For example, a sharp slowdown in lending could weigh on
growth, putting pressure on the central bank to loosen money
supply to support the recently reaffirmed 7.5% growth target.
Highly-leveraged SOEs may be next, given the strong links
between highly-indebted local governments, state-owned
enterprises and banks. Risks to the quasi-public sector would
surely see a roll-back on reforms.
Reforms are needed
These risks to growth also underline the importance of these
much-needed reforms. The transition from the exports and
investment-led growth model to a domestic consumption and
services model will necessarily slow long-term growth, but it will
reduce China’s vulnerability to external shocks and ensure
sustainable growth. Opening up the banking sector to private
capital will boost competition in financial services and reduce
dependence on shadow banking. Pursuing these reforms may
have some transitional costs, but are necessary to secure
sustainable growth in the long-term for China.
Fig 3: Loans to private non-financial sector
Source: BIS, National Bureau of Statistics
80%
100%
120%
140%
160%
180%
Q1
2000
Q1
2001
Q1
2002
Q1
2003
Q1
2004
Q1
2005
Q1
2006
Q1
2007
Q1
2008
Q1
2009
Q1
2010
Q1
2011
Q1
2012
Q1
2013
% of GDP
-20
-15
-10
-5
0
5
Estimatedcyclicallyadjustedgovernment
netlending(%ofpotentialGDP)
2009 2013
Source: AMECO
Inequality – is the Gini out of the bottle?
Fig 4: The wage share of the economy has been falling in
several advanced economies
Source: PwC 17th Annual Global CEO Survey
Fig 6: Three quarters of business leaders believe that their
firm has a role to play in society
Fig 5: Less inequality is associated with better conditions for
growth
Inequality is on the rise in key advanced economies
As the economic recovery continues to take hold in advanced
economies, substantial levels of inequality mean that the benefits
of recovery are not being felt equally throughout the economy.
For example the top 10% of wage earners in the US earned 48% of
total income in 2012.
Rising inequality is not a new phenomenon - in fact this is a trend
lasting more than 20 years. Figure 1 shows that the Gini
coefficient (a standard measure of inequality) rose in each of the
G7 economies from around 1985 to around 2010. During that
period the top 1% of the income earners in the US increased their
share of total income by 10 percentage points from 1985 to 2012.
Global Megatrends can help to explain why
We think there are some important structural trends at play
which can linked to broader “megatrends” in the global economy.
In particular:
• Technological breakthroughs are changing the role of
labour in the production process. During the industrial
revolution, technology reduced the need for labour to do
physically repetitive tasks. Now, the digital revolution is
reducing the need for labour to do mentally repetitive tasks.
This partly explains why, in the US, we have seen the share of
wages as a proportion of the economy decrease from around
61% in 1990 (approximately when the world wide web was
invented) to 56% in 2013.
• The shift in global economic power from the West to the
East has given businesses in advanced economies more
flexibility in deciding where to operate parts of their business.
One side-effect of this has been offshoring of some lower value
added activities to low-wage destinations.
Inequality levels can have important implications for businesses.
Recent IMF research suggests that higher levels of inequality are
associated with lower levels of economic growth (see Figure 5).
More equal economies can also mean a “broader base” of
consumer spending, expanding the range of products that
businesses can bring to market. They can also add to social
cohesion, which may be important for sustainable growth.
What does this mean for businesses?
Technological advances and declining wage gaps with China and
other emerging markets may mean reshoring of some jobs makes
more commercial sense in future. For example, in our recent UK
Economic Outlook, we estimated that reshoring could bring
approximately 100,000-200,000 jobs back to the UK over the
next decade.
But it’s not just the bottom line, businesses are increasingly
looking “beyond profit” to wider social issues (See Figure 6). One
approach here is to look at alternative models with greater
employee ownership of firms. This could help supplement wages,
while also better aligning the interests of employees and the firm.
There could be other upsides too: data suggests that listed UK
companies with 10% or greater employee ownership have
outperformed the FTSE All Share by an average of 7.7% a year
since 2003.
“Redistribution, inequality and growth”, IMF Staff Discussion Note, February 2014
50
55
60
65
70
75
1980 1985 1990 1995 2000 2005 2010
Adjustedwageshare(%ofGDP)
Germany UK US Japan
31%
44%
It's important for us to satisfy wider societal needs and
protect interests of future generations
Agree strongly Agree
Source: IMF, OECD, PwC Calculations
Note: West Germany data used for Germany from 1980-1990
-0.50
0.00
0.50
1.00
1.50
2.00
2.50
3.00
3.50
0.2 0.25 0.3 0.35 0.4
2004-13ave.GDPgrowth
C.2004 Gini coefficient
Projections: April 2014
Sources: PwC analysis, National statistical authorities, Thomson Datastream and IMF. All inflation indicators relate to the Consumer Price Index (CPI), with the
exception of the Indian indicator which refers to the Wholesale Price Index (WPI). Argentinian inflation figures are based on the old price index which measure CPI in
Greater Buenos Aires. A new index the "National and urban Consumer Price Index" (NuCPI) has now been released by INDEC the Argentinian statistical agency. We will
monitor this new price index and will base our projection on this once we have several months of data available. Also note that the tables above form our main scenario
projections and are therefore subject to considerable uncertainties. We recommend that our clients look at a range of alternative scenarios
This publication has been prepared for general guidance on matters of interest only, and does not constitute professional advice. You should not act upon the information contained in this publication
without obtaining specific professional advice. No representation or warranty (express or implied) is given as to the accuracy or completeness of the information contained in this publication, and, to
the extent permitted by law, PricewaterhouseCoopers LLP, its members, employees and agents do not accept or assume any liability, responsibility or duty of care for any consequences of you or
anyone else acting, or refraining to act, in reliance on the information contained in this publication or for any decision based on it.
© 2014 PricewaterhouseCoopers LLP. All rights reserved. In this document, "PwC" refers to the UK member firm, and may sometimes refer to the PwC network. Each member firm is a separate legal
entity. Please see www.pwc.com/structure for further details.
140123-203416-BK-OS
Interest rate outlook of major economies
Current rate (Last change) Expectation Next meeting
Federal Reserve 0-0.25% (December 2008) QE tapering to continue during 2014 29/30 April
European Central Bank 0.25% (November 2013) On hold 3 April
Bank of England 0.5% (March 2009) On hold 3 April
We help you understand how big economic, demographic, social, and environmental changes affect your organisation by setting out scenarios that
identify growth opportunities and risks on a global, regional, national and local level. We help make strategic and tactical operational, pricing and
investment decisions to support business value creation. We work together with you to achieve sustainable growth.
PwC’s Global Consumer
Index – March 2014
Global consumer spending growth picks up
to 3.6% this month. Global equity market
activity and market confidence dipped
slightly in February.
These are offset by increases in global money
supply and supported by the rebound in US
industrial production from last month,
which marks a positive turn in businesses’
expectations of consumer demand over the
next few months.
Richard Boxshall
T: +44 (0) 20 7213 2079
E: richard.boxshall@uk.pwc.com
William Zimmern
T: +44 (0) 20 7212 2750
E: william.zimmern@uk.pwc.com
Barret Kupelian
T: + 44 (0) 20 7213 1579
E: barret.g.kupelian@uk.pwc.com
The GCI is a monthly updated index providing an early steer on consumer spending and
growth prospects in the world’s 20 largest economies. For more information, please visit
www.pwc.co.uk/globalconsumerindex
0.0%
0.5%
1.0%
1.5%
2.0%
2.5%
3.0%
3.5%
4.0%
Apr-13
May-13
Jun-13
Jul-13
Aug-13
Sep-13
Oct-13
Nov-13
Dec-13
Jan-14
Feb-14
Mar-14
YoYgrowth
Long-term growth
3.6%
P P P * MER* 2013e 2014p 2015p 2016-2020p 2013e 2014p 2015p 2016-2020p
Global (market exchange rates) 100% 2.5 3.1 3.2 3.2 4.8 5.2 5.6 4.7
Global (PPP rates) 100% 3.0 3.5 3.7 3.7
United States 19.5% 22.5% 1.9 3.0 3.0 2.4 1.5 1.8 1.9 1.9
China 14.7 % 11.4% 7 .7 7 .5 7 .2 7 .0 2.7 2.5 2.7 3.4
Japan 5.5% 8.3% 1.6 1.5 1.1 1.2 0.4 2.1 1.8 1.5
United Kingdom 2.8% 3.4% 1.7 2.6 2.4 2.4 2.6 1.8 1.9 2.0
Eurozone 13.5% 16.9% -0.4 1.0 1.3 1.5 1.4 1.3 1.5 1.9
France 2.7 % 3.6% 0.1 0.9 1.2 1.6 1.0 1.2 1.6 2.0
Germany 3.8% 4.7 % 0.5 1.7 1.9 1.5 1.6 1.7 1.8 2.0
Greece 0.3% 0.3% -3.8 0.2 1.8 2.5 -0.9 -0.3 0.1 1.0
Ireland 0.2% 0.3% 0.1 2.1 1.8 2.5 0.5 1.4 1.2 1.7
Italy 2.2% 2.8% -1.8 0.4 1.0 0.8 1.3 1.1 1.3 1.7
Netherlands 0.8% 1.1% -0.9 0.8 0.9 2.0 2.6 1.4 1.7 2.1
Portugal 0.3% 0.3% -1.2 1.3 1.6 1.8 0.4 0.5 1.2 1.5
Spain 1.7 % 1.8% -1.2 0.7 0.9 1.7 1.5 0.9 1.2 1.7
Poland 1.0% 0.7 % 1.5 3.2 3.4 3.9 1.2 1.4 2.5 2.5
Russia 3.0% 2.8% 1.6 2.0 2.9 3.8 6.8 5.8 5.3 5.6
Turkey 1.3% 1.1% 3.7 2.6 4.3 4.5 7 .5 8.0 6.5 4.8
Australia 1.2% 2.1% 2.4 2.7 3.0 3.1 2.4 2.8 2.6 2.7
India 5.7 % 2.6% 4.6 5.4 6.4 6.5 6.3 5.2 6.0 6.0
Indonesia 1.4% 1.2% 5.8 5.5 5.8 6.3 7 .0 6.2 5.3 5.1
South Korea 1.9% 1.6% 2.8 2.8 4.0 3.8 1.2 1.8 2.9 2.9
Argentina 0.9% 0.7 % 5.0 0.7 1.8 3.3 10.6 11.9 13.3 9.7
Brazil 2.8% 3.1% 2.3 1.8 2.5 4.0 6.2 6.1 5.6 4.8
Canada 1.8% 2.5% 1.7 2.3 2.5 2.2 0.9 1.7 1.9 2.1
Mexico 2.2% 1.6% 1.6 3.2 3.7 3.6 3.8 3.8 3.9 3.6
South Africa 0.7 % 0.5% 1.9 2.6 3.2 3.8 5.8 6.2 5.0 4.8
Saudi Arabia 1.1% 1.0% 3.8 4.4 4.2 4.3 3.5 3.1 3.5 4.0
Real GDP growth InflationS ha re o f 2 0 12 wo rld GDP

Weitere ähnliche Inhalte

Was ist angesagt?

External Shocks and Economic Cycles
External Shocks and Economic CyclesExternal Shocks and Economic Cycles
External Shocks and Economic Cyclestutor2u
 
Getting stronger but tensions are rising presentation OECD interim economic o...
Getting stronger but tensions are rising presentation OECD interim economic o...Getting stronger but tensions are rising presentation OECD interim economic o...
Getting stronger but tensions are rising presentation OECD interim economic o...OECD, Economics Department
 
Media Brief - August 2015
Media Brief - August 2015Media Brief - August 2015
Media Brief - August 2015CXC Global A/NZ
 
Federal agency cybersecurity funding
Federal agency cybersecurity fundingFederal agency cybersecurity funding
Federal agency cybersecurity fundingJLL
 
Chinese Economic Slowdown
Chinese Economic SlowdownChinese Economic Slowdown
Chinese Economic SlowdownAnurag Gupta
 
Slowdown in Chinese Economy and its Impact on the World
Slowdown in Chinese Economy and its Impact on the WorldSlowdown in Chinese Economy and its Impact on the World
Slowdown in Chinese Economy and its Impact on the Worldinamdaramaan
 
China - A Country in Transition to a New Normal
China - A Country in Transition to a New NormalChina - A Country in Transition to a New Normal
China - A Country in Transition to a New Normaltutor2u
 
China's Current Challenges – A Dummies Guide
China's Current Challenges – A Dummies GuideChina's Current Challenges – A Dummies Guide
China's Current Challenges – A Dummies GuideAmir Khan
 
VERTEX Annual State of the Construction Industry 2018
VERTEX Annual State of the Construction Industry 2018VERTEX Annual State of the Construction Industry 2018
VERTEX Annual State of the Construction Industry 2018The Vertex Companies, LLC
 
Vertex annual state of the construction industry presentation 2018
Vertex annual state of the construction industry presentation   2018Vertex annual state of the construction industry presentation   2018
Vertex annual state of the construction industry presentation 2018The Vertex Companies, LLC
 
AS Macro Question - Falling Unemployment
AS Macro Question - Falling UnemploymentAS Macro Question - Falling Unemployment
AS Macro Question - Falling UnemploymentEton College
 
AS Macro - Unemployment and the Labour Market
AS Macro - Unemployment and the Labour MarketAS Macro - Unemployment and the Labour Market
AS Macro - Unemployment and the Labour Markettutor2u
 
Impact of Chinese slowdown on India and the World
Impact of Chinese slowdown on India and the WorldImpact of Chinese slowdown on India and the World
Impact of Chinese slowdown on India and the WorldPriyanka Banerjee
 
PwC Global Economy Watch (sept. 2013)
PwC Global Economy Watch (sept. 2013)PwC Global Economy Watch (sept. 2013)
PwC Global Economy Watch (sept. 2013)PwC France
 
AS Macro Revision: Migration and the Economy
AS Macro Revision: Migration and the EconomyAS Macro Revision: Migration and the Economy
AS Macro Revision: Migration and the Economytutor2u
 
Japan 2017 OECD Economic Survey Raising Productivity
Japan 2017 OECD Economic Survey Raising ProductivityJapan 2017 OECD Economic Survey Raising Productivity
Japan 2017 OECD Economic Survey Raising ProductivityOECD, Economics Department
 
This Year, Next Year: Global Mid-Year Forecast Report
This Year, Next Year: Global Mid-Year Forecast ReportThis Year, Next Year: Global Mid-Year Forecast Report
This Year, Next Year: Global Mid-Year Forecast ReportHarsha MV
 
Trade cycle output_gaps
Trade cycle output_gapsTrade cycle output_gaps
Trade cycle output_gapsmattbentley34
 
2015 san diego and national economic update july 24 2015
2015 san diego and national economic update july 24 20152015 san diego and national economic update july 24 2015
2015 san diego and national economic update july 24 2015Evan Donaldson
 

Was ist angesagt? (20)

External Shocks and Economic Cycles
External Shocks and Economic CyclesExternal Shocks and Economic Cycles
External Shocks and Economic Cycles
 
Getting stronger but tensions are rising presentation OECD interim economic o...
Getting stronger but tensions are rising presentation OECD interim economic o...Getting stronger but tensions are rising presentation OECD interim economic o...
Getting stronger but tensions are rising presentation OECD interim economic o...
 
Media Brief - August 2015
Media Brief - August 2015Media Brief - August 2015
Media Brief - August 2015
 
Federal agency cybersecurity funding
Federal agency cybersecurity fundingFederal agency cybersecurity funding
Federal agency cybersecurity funding
 
Chinese Economic Slowdown
Chinese Economic SlowdownChinese Economic Slowdown
Chinese Economic Slowdown
 
Slowdown in Chinese Economy and its Impact on the World
Slowdown in Chinese Economy and its Impact on the WorldSlowdown in Chinese Economy and its Impact on the World
Slowdown in Chinese Economy and its Impact on the World
 
China - A Country in Transition to a New Normal
China - A Country in Transition to a New NormalChina - A Country in Transition to a New Normal
China - A Country in Transition to a New Normal
 
China's Current Challenges – A Dummies Guide
China's Current Challenges – A Dummies GuideChina's Current Challenges – A Dummies Guide
China's Current Challenges – A Dummies Guide
 
Employment unemployment
Employment unemploymentEmployment unemployment
Employment unemployment
 
VERTEX Annual State of the Construction Industry 2018
VERTEX Annual State of the Construction Industry 2018VERTEX Annual State of the Construction Industry 2018
VERTEX Annual State of the Construction Industry 2018
 
Vertex annual state of the construction industry presentation 2018
Vertex annual state of the construction industry presentation   2018Vertex annual state of the construction industry presentation   2018
Vertex annual state of the construction industry presentation 2018
 
AS Macro Question - Falling Unemployment
AS Macro Question - Falling UnemploymentAS Macro Question - Falling Unemployment
AS Macro Question - Falling Unemployment
 
AS Macro - Unemployment and the Labour Market
AS Macro - Unemployment and the Labour MarketAS Macro - Unemployment and the Labour Market
AS Macro - Unemployment and the Labour Market
 
Impact of Chinese slowdown on India and the World
Impact of Chinese slowdown on India and the WorldImpact of Chinese slowdown on India and the World
Impact of Chinese slowdown on India and the World
 
PwC Global Economy Watch (sept. 2013)
PwC Global Economy Watch (sept. 2013)PwC Global Economy Watch (sept. 2013)
PwC Global Economy Watch (sept. 2013)
 
AS Macro Revision: Migration and the Economy
AS Macro Revision: Migration and the EconomyAS Macro Revision: Migration and the Economy
AS Macro Revision: Migration and the Economy
 
Japan 2017 OECD Economic Survey Raising Productivity
Japan 2017 OECD Economic Survey Raising ProductivityJapan 2017 OECD Economic Survey Raising Productivity
Japan 2017 OECD Economic Survey Raising Productivity
 
This Year, Next Year: Global Mid-Year Forecast Report
This Year, Next Year: Global Mid-Year Forecast ReportThis Year, Next Year: Global Mid-Year Forecast Report
This Year, Next Year: Global Mid-Year Forecast Report
 
Trade cycle output_gaps
Trade cycle output_gapsTrade cycle output_gaps
Trade cycle output_gaps
 
2015 san diego and national economic update july 24 2015
2015 san diego and national economic update july 24 20152015 san diego and national economic update july 24 2015
2015 san diego and national economic update july 24 2015
 

Andere mochten auch

Power Deals : étude sur les fusions-acquisitions dans le secteur de l'énergie...
Power Deals : étude sur les fusions-acquisitions dans le secteur de l'énergie...Power Deals : étude sur les fusions-acquisitions dans le secteur de l'énergie...
Power Deals : étude sur les fusions-acquisitions dans le secteur de l'énergie...PwC France
 
Etude PwC sur le Bitcoin (fév. 2014)
Etude PwC sur le Bitcoin (fév. 2014)Etude PwC sur le Bitcoin (fév. 2014)
Etude PwC sur le Bitcoin (fév. 2014)PwC France
 
Etude PwC "Mine 2014"
Etude PwC "Mine 2014"Etude PwC "Mine 2014"
Etude PwC "Mine 2014"PwC France
 
PwC Global Economy watch (mai 2014)
PwC Global Economy watch (mai 2014)PwC Global Economy watch (mai 2014)
PwC Global Economy watch (mai 2014)PwC France
 
Étude PwC sur les objets connectés "The Wearable Future" (oct. 2014)
Étude PwC sur les objets connectés "The Wearable Future" (oct. 2014)Étude PwC sur les objets connectés "The Wearable Future" (oct. 2014)
Étude PwC sur les objets connectés "The Wearable Future" (oct. 2014)PwC France
 
PwC Emerging Trends Real Estate Europe 2012
PwC Emerging Trends Real Estate Europe 2012PwC Emerging Trends Real Estate Europe 2012
PwC Emerging Trends Real Estate Europe 2012PwC France
 
Etude PwC "Cash for growth" sur le BFR (2014)
Etude PwC "Cash for growth" sur le BFR (2014)Etude PwC "Cash for growth" sur le BFR (2014)
Etude PwC "Cash for growth" sur le BFR (2014)PwC France
 
Etude PwC "Modern Mobility" (nov. 2014)
Etude PwC "Modern Mobility" (nov. 2014)Etude PwC "Modern Mobility" (nov. 2014)
Etude PwC "Modern Mobility" (nov. 2014)PwC France
 
PwC Global Economy Watch (juin 2014)
PwC Global Economy Watch (juin 2014)PwC Global Economy Watch (juin 2014)
PwC Global Economy Watch (juin 2014)PwC France
 

Andere mochten auch (9)

Power Deals : étude sur les fusions-acquisitions dans le secteur de l'énergie...
Power Deals : étude sur les fusions-acquisitions dans le secteur de l'énergie...Power Deals : étude sur les fusions-acquisitions dans le secteur de l'énergie...
Power Deals : étude sur les fusions-acquisitions dans le secteur de l'énergie...
 
Etude PwC sur le Bitcoin (fév. 2014)
Etude PwC sur le Bitcoin (fév. 2014)Etude PwC sur le Bitcoin (fév. 2014)
Etude PwC sur le Bitcoin (fév. 2014)
 
Etude PwC "Mine 2014"
Etude PwC "Mine 2014"Etude PwC "Mine 2014"
Etude PwC "Mine 2014"
 
PwC Global Economy watch (mai 2014)
PwC Global Economy watch (mai 2014)PwC Global Economy watch (mai 2014)
PwC Global Economy watch (mai 2014)
 
Étude PwC sur les objets connectés "The Wearable Future" (oct. 2014)
Étude PwC sur les objets connectés "The Wearable Future" (oct. 2014)Étude PwC sur les objets connectés "The Wearable Future" (oct. 2014)
Étude PwC sur les objets connectés "The Wearable Future" (oct. 2014)
 
PwC Emerging Trends Real Estate Europe 2012
PwC Emerging Trends Real Estate Europe 2012PwC Emerging Trends Real Estate Europe 2012
PwC Emerging Trends Real Estate Europe 2012
 
Etude PwC "Cash for growth" sur le BFR (2014)
Etude PwC "Cash for growth" sur le BFR (2014)Etude PwC "Cash for growth" sur le BFR (2014)
Etude PwC "Cash for growth" sur le BFR (2014)
 
Etude PwC "Modern Mobility" (nov. 2014)
Etude PwC "Modern Mobility" (nov. 2014)Etude PwC "Modern Mobility" (nov. 2014)
Etude PwC "Modern Mobility" (nov. 2014)
 
PwC Global Economy Watch (juin 2014)
PwC Global Economy Watch (juin 2014)PwC Global Economy Watch (juin 2014)
PwC Global Economy Watch (juin 2014)
 

Ähnlich wie PwC Global Economy watch (mars 2014)

The Long Term Investment Outlook for China
The Long Term Investment Outlook for ChinaThe Long Term Investment Outlook for China
The Long Term Investment Outlook for ChinaJohn M Olson, CLTC
 
OECD Economic Outlook - Christian Kastrop, OECD
OECD Economic Outlook - Christian Kastrop, OECDOECD Economic Outlook - Christian Kastrop, OECD
OECD Economic Outlook - Christian Kastrop, OECDOECD Governance
 
Global Market Outlook - Equities
Global Market Outlook - EquitiesGlobal Market Outlook - Equities
Global Market Outlook - EquitiesChris Kearns
 
Global Powers of Consumer Products 2013
Global Powers of Consumer Products 2013Global Powers of Consumer Products 2013
Global Powers of Consumer Products 2013Melih ÖZCANLI
 
QNB Group China Economic Insight 2014
QNB Group China Economic Insight 2014QNB Group China Economic Insight 2014
QNB Group China Economic Insight 2014Joannes Mongardini
 
OECD Economic Outlook June 2016 Policymakers: act now to keep promises!
OECD Economic Outlook June 2016 Policymakers: act now to keep promises!OECD Economic Outlook June 2016 Policymakers: act now to keep promises!
OECD Economic Outlook June 2016 Policymakers: act now to keep promises!OECD, Economics Department
 
Economic Volatility: How Covid-19 is Affecting Our Communities
Economic Volatility: How Covid-19 is Affecting Our CommunitiesEconomic Volatility: How Covid-19 is Affecting Our Communities
Economic Volatility: How Covid-19 is Affecting Our CommunitiesNicolasMontenegro13
 
PwC Global Economy Watch (août 2014)
PwC Global Economy Watch (août 2014)PwC Global Economy Watch (août 2014)
PwC Global Economy Watch (août 2014)PwC France
 
Swedbank Asia Analysis, No. !2
Swedbank Asia Analysis, No. !2Swedbank Asia Analysis, No. !2
Swedbank Asia Analysis, No. !2Swedbank
 
Moving-forward-in-difficult-times-oecd-economic-outlook
Moving-forward-in-difficult-times-oecd-economic-outlookMoving-forward-in-difficult-times-oecd-economic-outlook
Moving-forward-in-difficult-times-oecd-economic-outlookOECD, Economics Department
 
PwC Global Economy Watch (oct. 2013)
PwC Global Economy Watch (oct. 2013)PwC Global Economy Watch (oct. 2013)
PwC Global Economy Watch (oct. 2013)PwC France
 
Nfais Presentation20080226 F
Nfais Presentation20080226 FNfais Presentation20080226 F
Nfais Presentation20080226 Frotciv
 
BNP PARIBAS - Investment Outlook 2023
BNP PARIBAS - Investment Outlook 2023BNP PARIBAS - Investment Outlook 2023
BNP PARIBAS - Investment Outlook 2023Investoida
 
Short-term momentum: will it be sustained? OECD Economic Outlook presentation...
Short-term momentum: will it be sustained? OECD Economic Outlook presentation...Short-term momentum: will it be sustained? OECD Economic Outlook presentation...
Short-term momentum: will it be sustained? OECD Economic Outlook presentation...OECD, Economics Department
 
2016/17 China Macroeconomic Outlook & Market Opportunities
2016/17 China Macroeconomic Outlook & Market Opportunities2016/17 China Macroeconomic Outlook & Market Opportunities
2016/17 China Macroeconomic Outlook & Market OpportunitiesNan BAI,CFA
 

Ähnlich wie PwC Global Economy watch (mars 2014) (20)

The Long Term Investment Outlook for China
The Long Term Investment Outlook for ChinaThe Long Term Investment Outlook for China
The Long Term Investment Outlook for China
 
Welsh Government Future Trends 2017: economy and infrastructure
Welsh Government Future Trends 2017:  economy and infrastructureWelsh Government Future Trends 2017:  economy and infrastructure
Welsh Government Future Trends 2017: economy and infrastructure
 
2015 Year End Outlook
2015 Year End Outlook2015 Year End Outlook
2015 Year End Outlook
 
OECD Economic Outlook - Christian Kastrop, OECD
OECD Economic Outlook - Christian Kastrop, OECDOECD Economic Outlook - Christian Kastrop, OECD
OECD Economic Outlook - Christian Kastrop, OECD
 
Global Market Outlook - Equities
Global Market Outlook - EquitiesGlobal Market Outlook - Equities
Global Market Outlook - Equities
 
Global Powers of Consumer Products 2013
Global Powers of Consumer Products 2013Global Powers of Consumer Products 2013
Global Powers of Consumer Products 2013
 
QNB Group China Economic Insight 2014
QNB Group China Economic Insight 2014QNB Group China Economic Insight 2014
QNB Group China Economic Insight 2014
 
TECNOLOGIA.pdf
TECNOLOGIA.pdfTECNOLOGIA.pdf
TECNOLOGIA.pdf
 
OECD Economic Outlook June 2016 Policymakers: act now to keep promises!
OECD Economic Outlook June 2016 Policymakers: act now to keep promises!OECD Economic Outlook June 2016 Policymakers: act now to keep promises!
OECD Economic Outlook June 2016 Policymakers: act now to keep promises!
 
Economic Volatility: How Covid-19 is Affecting Our Communities
Economic Volatility: How Covid-19 is Affecting Our CommunitiesEconomic Volatility: How Covid-19 is Affecting Our Communities
Economic Volatility: How Covid-19 is Affecting Our Communities
 
Presentation on update of macroeconomic framework for negotiations 2[1]
Presentation on update of macroeconomic framework for negotiations 2[1]Presentation on update of macroeconomic framework for negotiations 2[1]
Presentation on update of macroeconomic framework for negotiations 2[1]
 
PwC Global Economy Watch (août 2014)
PwC Global Economy Watch (août 2014)PwC Global Economy Watch (août 2014)
PwC Global Economy Watch (août 2014)
 
Swedbank Asia Analysis, No. !2
Swedbank Asia Analysis, No. !2Swedbank Asia Analysis, No. !2
Swedbank Asia Analysis, No. !2
 
Moving-forward-in-difficult-times-oecd-economic-outlook
Moving-forward-in-difficult-times-oecd-economic-outlookMoving-forward-in-difficult-times-oecd-economic-outlook
Moving-forward-in-difficult-times-oecd-economic-outlook
 
PwC Global Economy Watch (oct. 2013)
PwC Global Economy Watch (oct. 2013)PwC Global Economy Watch (oct. 2013)
PwC Global Economy Watch (oct. 2013)
 
Nfais Presentation20080226 F
Nfais Presentation20080226 FNfais Presentation20080226 F
Nfais Presentation20080226 F
 
BNP PARIBAS - Investment Outlook 2023
BNP PARIBAS - Investment Outlook 2023BNP PARIBAS - Investment Outlook 2023
BNP PARIBAS - Investment Outlook 2023
 
Short-term momentum: will it be sustained? OECD Economic Outlook presentation...
Short-term momentum: will it be sustained? OECD Economic Outlook presentation...Short-term momentum: will it be sustained? OECD Economic Outlook presentation...
Short-term momentum: will it be sustained? OECD Economic Outlook presentation...
 
2016/17 China Macroeconomic Outlook & Market Opportunities
2016/17 China Macroeconomic Outlook & Market Opportunities2016/17 China Macroeconomic Outlook & Market Opportunities
2016/17 China Macroeconomic Outlook & Market Opportunities
 
Key Findings: The Future of Corporate Governance in Capital Markets Following...
Key Findings: The Future of Corporate Governance in Capital Markets Following...Key Findings: The Future of Corporate Governance in Capital Markets Following...
Key Findings: The Future of Corporate Governance in Capital Markets Following...
 

Mehr von PwC France

Etude PwC "20ème édition de la CEO Survey" - Janvier 2017
Etude PwC "20ème édition de la CEO Survey" - Janvier 2017Etude PwC "20ème édition de la CEO Survey" - Janvier 2017
Etude PwC "20ème édition de la CEO Survey" - Janvier 2017PwC France
 
Etude PwC "Carbon Factor" (nov. 2015)
Etude PwC "Carbon Factor" (nov. 2015)Etude PwC "Carbon Factor" (nov. 2015)
Etude PwC "Carbon Factor" (nov. 2015)PwC France
 
Etude PwC : La transition énergétique pour la croissance verte (nov 2015)
Etude PwC : La transition énergétique pour la croissance verte (nov 2015)Etude PwC : La transition énergétique pour la croissance verte (nov 2015)
Etude PwC : La transition énergétique pour la croissance verte (nov 2015)PwC France
 
Etude PwC "Total Retail 2015" Sur quoi miser aujourd’hui pour réenchanter la ...
Etude PwC "Total Retail 2015" Sur quoi miser aujourd’hui pour réenchanter la ...Etude PwC "Total Retail 2015" Sur quoi miser aujourd’hui pour réenchanter la ...
Etude PwC "Total Retail 2015" Sur quoi miser aujourd’hui pour réenchanter la ...PwC France
 
GEMO 2016 : un digital de plus en plus cannibale ?
GEMO 2016  : un digital de plus en plus cannibale ?GEMO 2016  : un digital de plus en plus cannibale ?
GEMO 2016 : un digital de plus en plus cannibale ?PwC France
 
Infographie PwC GEMO 2016 sur l'industrie Médias et Loisirs (juin 2015)
Infographie PwC GEMO 2016 sur l'industrie Médias et Loisirs (juin 2015)Infographie PwC GEMO 2016 sur l'industrie Médias et Loisirs (juin 2015)
Infographie PwC GEMO 2016 sur l'industrie Médias et Loisirs (juin 2015)PwC France
 
Etude PwC Low Carbon Economy Index (oct. 2015)
Etude PwC Low Carbon Economy Index (oct. 2015)Etude PwC Low Carbon Economy Index (oct. 2015)
Etude PwC Low Carbon Economy Index (oct. 2015)PwC France
 
Etude FCD, ESSEC et PwC sur la distribution responsable (août 2015)
Etude FCD, ESSEC et PwC sur la distribution responsable (août 2015)Etude FCD, ESSEC et PwC sur la distribution responsable (août 2015)
Etude FCD, ESSEC et PwC sur la distribution responsable (août 2015)PwC France
 
Etude PwC IPO Watch
Etude PwC IPO WatchEtude PwC IPO Watch
Etude PwC IPO WatchPwC France
 
Etude PwC CEO Survey Talent "People Strategy for the Digital Age" (juillet 2015)
Etude PwC CEO Survey Talent "People Strategy for the Digital Age" (juillet 2015)Etude PwC CEO Survey Talent "People Strategy for the Digital Age" (juillet 2015)
Etude PwC CEO Survey Talent "People Strategy for the Digital Age" (juillet 2015)PwC France
 
Etude PwC Golden Age Index (juin 2015)
Etude PwC Golden Age Index (juin 2015)Etude PwC Golden Age Index (juin 2015)
Etude PwC Golden Age Index (juin 2015)PwC France
 
Etude PwC Global Economy Watch (juin 2015)
Etude PwC Global Economy Watch (juin 2015)Etude PwC Global Economy Watch (juin 2015)
Etude PwC Global Economy Watch (juin 2015)PwC France
 
Etude PwC et Essec "Grande consommation 1985 - 2015 - 2045"
Etude PwC et Essec "Grande consommation 1985 - 2015 - 2045"Etude PwC et Essec "Grande consommation 1985 - 2015 - 2045"
Etude PwC et Essec "Grande consommation 1985 - 2015 - 2045"PwC France
 
Etude PwC sur le Top 100 des entreprises les mieux valorisées au monde en 201...
Etude PwC sur le Top 100 des entreprises les mieux valorisées au monde en 201...Etude PwC sur le Top 100 des entreprises les mieux valorisées au monde en 201...
Etude PwC sur le Top 100 des entreprises les mieux valorisées au monde en 201...PwC France
 
Etude PwC "Point of View: Enterprise Portfolio & Program Management" (mai 2015)
Etude PwC "Point of View: Enterprise Portfolio & Program Management" (mai 2015)Etude PwC "Point of View: Enterprise Portfolio & Program Management" (mai 2015)
Etude PwC "Point of View: Enterprise Portfolio & Program Management" (mai 2015)PwC France
 
Etude PwC "Bridging the gap" sur les investisseurs institutionnels (mai 2015)
Etude PwC "Bridging the gap" sur les investisseurs institutionnels (mai 2015)Etude PwC "Bridging the gap" sur les investisseurs institutionnels (mai 2015)
Etude PwC "Bridging the gap" sur les investisseurs institutionnels (mai 2015)PwC France
 
Etude PwC, AFDEL et SNJV sur "Les 100 digital"
Etude PwC, AFDEL et SNJV sur "Les 100 digital"Etude PwC, AFDEL et SNJV sur "Les 100 digital"
Etude PwC, AFDEL et SNJV sur "Les 100 digital"PwC France
 
Etude PwC Global Economy Watch (mai 2015)
Etude PwC Global Economy Watch (mai 2015)Etude PwC Global Economy Watch (mai 2015)
Etude PwC Global Economy Watch (mai 2015)PwC France
 
Etude PwC sur l'économie collaborative (mai 2015)
Etude PwC sur l'économie collaborative (mai 2015)Etude PwC sur l'économie collaborative (mai 2015)
Etude PwC sur l'économie collaborative (mai 2015)PwC France
 
Etude PwC sur l'intérêt des investisseurs pour l’Afrique (avril 2015)
Etude PwC sur l'intérêt des investisseurs pour l’Afrique (avril 2015)Etude PwC sur l'intérêt des investisseurs pour l’Afrique (avril 2015)
Etude PwC sur l'intérêt des investisseurs pour l’Afrique (avril 2015)PwC France
 

Mehr von PwC France (20)

Etude PwC "20ème édition de la CEO Survey" - Janvier 2017
Etude PwC "20ème édition de la CEO Survey" - Janvier 2017Etude PwC "20ème édition de la CEO Survey" - Janvier 2017
Etude PwC "20ème édition de la CEO Survey" - Janvier 2017
 
Etude PwC "Carbon Factor" (nov. 2015)
Etude PwC "Carbon Factor" (nov. 2015)Etude PwC "Carbon Factor" (nov. 2015)
Etude PwC "Carbon Factor" (nov. 2015)
 
Etude PwC : La transition énergétique pour la croissance verte (nov 2015)
Etude PwC : La transition énergétique pour la croissance verte (nov 2015)Etude PwC : La transition énergétique pour la croissance verte (nov 2015)
Etude PwC : La transition énergétique pour la croissance verte (nov 2015)
 
Etude PwC "Total Retail 2015" Sur quoi miser aujourd’hui pour réenchanter la ...
Etude PwC "Total Retail 2015" Sur quoi miser aujourd’hui pour réenchanter la ...Etude PwC "Total Retail 2015" Sur quoi miser aujourd’hui pour réenchanter la ...
Etude PwC "Total Retail 2015" Sur quoi miser aujourd’hui pour réenchanter la ...
 
GEMO 2016 : un digital de plus en plus cannibale ?
GEMO 2016  : un digital de plus en plus cannibale ?GEMO 2016  : un digital de plus en plus cannibale ?
GEMO 2016 : un digital de plus en plus cannibale ?
 
Infographie PwC GEMO 2016 sur l'industrie Médias et Loisirs (juin 2015)
Infographie PwC GEMO 2016 sur l'industrie Médias et Loisirs (juin 2015)Infographie PwC GEMO 2016 sur l'industrie Médias et Loisirs (juin 2015)
Infographie PwC GEMO 2016 sur l'industrie Médias et Loisirs (juin 2015)
 
Etude PwC Low Carbon Economy Index (oct. 2015)
Etude PwC Low Carbon Economy Index (oct. 2015)Etude PwC Low Carbon Economy Index (oct. 2015)
Etude PwC Low Carbon Economy Index (oct. 2015)
 
Etude FCD, ESSEC et PwC sur la distribution responsable (août 2015)
Etude FCD, ESSEC et PwC sur la distribution responsable (août 2015)Etude FCD, ESSEC et PwC sur la distribution responsable (août 2015)
Etude FCD, ESSEC et PwC sur la distribution responsable (août 2015)
 
Etude PwC IPO Watch
Etude PwC IPO WatchEtude PwC IPO Watch
Etude PwC IPO Watch
 
Etude PwC CEO Survey Talent "People Strategy for the Digital Age" (juillet 2015)
Etude PwC CEO Survey Talent "People Strategy for the Digital Age" (juillet 2015)Etude PwC CEO Survey Talent "People Strategy for the Digital Age" (juillet 2015)
Etude PwC CEO Survey Talent "People Strategy for the Digital Age" (juillet 2015)
 
Etude PwC Golden Age Index (juin 2015)
Etude PwC Golden Age Index (juin 2015)Etude PwC Golden Age Index (juin 2015)
Etude PwC Golden Age Index (juin 2015)
 
Etude PwC Global Economy Watch (juin 2015)
Etude PwC Global Economy Watch (juin 2015)Etude PwC Global Economy Watch (juin 2015)
Etude PwC Global Economy Watch (juin 2015)
 
Etude PwC et Essec "Grande consommation 1985 - 2015 - 2045"
Etude PwC et Essec "Grande consommation 1985 - 2015 - 2045"Etude PwC et Essec "Grande consommation 1985 - 2015 - 2045"
Etude PwC et Essec "Grande consommation 1985 - 2015 - 2045"
 
Etude PwC sur le Top 100 des entreprises les mieux valorisées au monde en 201...
Etude PwC sur le Top 100 des entreprises les mieux valorisées au monde en 201...Etude PwC sur le Top 100 des entreprises les mieux valorisées au monde en 201...
Etude PwC sur le Top 100 des entreprises les mieux valorisées au monde en 201...
 
Etude PwC "Point of View: Enterprise Portfolio & Program Management" (mai 2015)
Etude PwC "Point of View: Enterprise Portfolio & Program Management" (mai 2015)Etude PwC "Point of View: Enterprise Portfolio & Program Management" (mai 2015)
Etude PwC "Point of View: Enterprise Portfolio & Program Management" (mai 2015)
 
Etude PwC "Bridging the gap" sur les investisseurs institutionnels (mai 2015)
Etude PwC "Bridging the gap" sur les investisseurs institutionnels (mai 2015)Etude PwC "Bridging the gap" sur les investisseurs institutionnels (mai 2015)
Etude PwC "Bridging the gap" sur les investisseurs institutionnels (mai 2015)
 
Etude PwC, AFDEL et SNJV sur "Les 100 digital"
Etude PwC, AFDEL et SNJV sur "Les 100 digital"Etude PwC, AFDEL et SNJV sur "Les 100 digital"
Etude PwC, AFDEL et SNJV sur "Les 100 digital"
 
Etude PwC Global Economy Watch (mai 2015)
Etude PwC Global Economy Watch (mai 2015)Etude PwC Global Economy Watch (mai 2015)
Etude PwC Global Economy Watch (mai 2015)
 
Etude PwC sur l'économie collaborative (mai 2015)
Etude PwC sur l'économie collaborative (mai 2015)Etude PwC sur l'économie collaborative (mai 2015)
Etude PwC sur l'économie collaborative (mai 2015)
 
Etude PwC sur l'intérêt des investisseurs pour l’Afrique (avril 2015)
Etude PwC sur l'intérêt des investisseurs pour l’Afrique (avril 2015)Etude PwC sur l'intérêt des investisseurs pour l’Afrique (avril 2015)
Etude PwC sur l'intérêt des investisseurs pour l’Afrique (avril 2015)
 

Kürzlich hochgeladen

Kempen ' UK DB Endgame Paper Apr 24 final3.pdf
Kempen ' UK DB Endgame Paper Apr 24 final3.pdfKempen ' UK DB Endgame Paper Apr 24 final3.pdf
Kempen ' UK DB Endgame Paper Apr 24 final3.pdfHenry Tapper
 
ΤτΕ: Ανάπτυξη 2,3% και πληθωρισμός 2,8% φέτος
ΤτΕ: Ανάπτυξη 2,3% και πληθωρισμός 2,8% φέτοςΤτΕ: Ανάπτυξη 2,3% και πληθωρισμός 2,8% φέτος
ΤτΕ: Ανάπτυξη 2,3% και πληθωρισμός 2,8% φέτοςNewsroom8
 
10 QuickBooks Tips 2024 - Globus Finanza.pdf
10 QuickBooks Tips 2024 - Globus Finanza.pdf10 QuickBooks Tips 2024 - Globus Finanza.pdf
10 QuickBooks Tips 2024 - Globus Finanza.pdfglobusfinanza
 
Liquidity Decisions in Financial management
Liquidity Decisions in Financial managementLiquidity Decisions in Financial management
Liquidity Decisions in Financial managementshrutisingh143670
 
The Inspirational Story of Julio Herrera Velutini - Global Finance Leader
The Inspirational Story of Julio Herrera Velutini - Global Finance LeaderThe Inspirational Story of Julio Herrera Velutini - Global Finance Leader
The Inspirational Story of Julio Herrera Velutini - Global Finance LeaderArianna Varetto
 
Aon-UK-DC-Pension-Tracker-Q1-2024. slideshare
Aon-UK-DC-Pension-Tracker-Q1-2024. slideshareAon-UK-DC-Pension-Tracker-Q1-2024. slideshare
Aon-UK-DC-Pension-Tracker-Q1-2024. slideshareHenry Tapper
 
OAT_RI_Ep18 WeighingTheRisks_Mar24_GlobalCredit.pptx
OAT_RI_Ep18 WeighingTheRisks_Mar24_GlobalCredit.pptxOAT_RI_Ep18 WeighingTheRisks_Mar24_GlobalCredit.pptx
OAT_RI_Ep18 WeighingTheRisks_Mar24_GlobalCredit.pptxhiddenlevers
 
Building pressure? Rising rents, and what to expect in the future
Building pressure? Rising rents, and what to expect in the futureBuilding pressure? Rising rents, and what to expect in the future
Building pressure? Rising rents, and what to expect in the futureResolutionFoundation
 
Hello this ppt is about seminar final project
Hello this ppt is about seminar final projectHello this ppt is about seminar final project
Hello this ppt is about seminar final projectninnasirsi
 
Thoma Bravo Equity - Presentation Pension Fund
Thoma Bravo Equity - Presentation Pension FundThoma Bravo Equity - Presentation Pension Fund
Thoma Bravo Equity - Presentation Pension FundAshwinJey
 
ekthesi-trapeza-tis-ellados-gia-2023.pdf
ekthesi-trapeza-tis-ellados-gia-2023.pdfekthesi-trapeza-tis-ellados-gia-2023.pdf
ekthesi-trapeza-tis-ellados-gia-2023.pdfSteliosTheodorou4
 
Banking: Commercial and Central Banking.pptx
Banking: Commercial and Central Banking.pptxBanking: Commercial and Central Banking.pptx
Banking: Commercial and Central Banking.pptxANTHONYAKINYOSOYE1
 
Money Forward Integrated Report “Forward Map” 2024
Money Forward Integrated Report “Forward Map” 2024Money Forward Integrated Report “Forward Map” 2024
Money Forward Integrated Report “Forward Map” 2024Money Forward
 
2024-04-09 - Pension Playpen roundtable - slides.pptx
2024-04-09 - Pension Playpen roundtable - slides.pptx2024-04-09 - Pension Playpen roundtable - slides.pptx
2024-04-09 - Pension Playpen roundtable - slides.pptxHenry Tapper
 
Crypto Confidence Unlocked: AnyKYCaccount's Shortcut to Binance Verification
Crypto Confidence Unlocked: AnyKYCaccount's Shortcut to Binance VerificationCrypto Confidence Unlocked: AnyKYCaccount's Shortcut to Binance Verification
Crypto Confidence Unlocked: AnyKYCaccount's Shortcut to Binance VerificationAny kyc Account
 
What is sip and What are its Benefits in 2024
What is sip and What are its Benefits in 2024What is sip and What are its Benefits in 2024
What is sip and What are its Benefits in 2024prajwalgopocket
 
2B Nation-State.pptx contemporary world nation
2B  Nation-State.pptx contemporary world nation2B  Nation-State.pptx contemporary world nation
2B Nation-State.pptx contemporary world nationko9240888
 
Gender and caste discrimination in india
Gender and caste discrimination in indiaGender and caste discrimination in india
Gender and caste discrimination in indiavandanasingh01072003
 
Global Economic Outlook, 2024 - Scholaride Consulting
Global Economic Outlook, 2024 - Scholaride ConsultingGlobal Economic Outlook, 2024 - Scholaride Consulting
Global Economic Outlook, 2024 - Scholaride Consultingswastiknandyofficial
 
Introduction to Health Economics Dr. R. Kurinji Malar.pptx
Introduction to Health Economics Dr. R. Kurinji Malar.pptxIntroduction to Health Economics Dr. R. Kurinji Malar.pptx
Introduction to Health Economics Dr. R. Kurinji Malar.pptxDrRkurinjiMalarkurin
 

Kürzlich hochgeladen (20)

Kempen ' UK DB Endgame Paper Apr 24 final3.pdf
Kempen ' UK DB Endgame Paper Apr 24 final3.pdfKempen ' UK DB Endgame Paper Apr 24 final3.pdf
Kempen ' UK DB Endgame Paper Apr 24 final3.pdf
 
ΤτΕ: Ανάπτυξη 2,3% και πληθωρισμός 2,8% φέτος
ΤτΕ: Ανάπτυξη 2,3% και πληθωρισμός 2,8% φέτοςΤτΕ: Ανάπτυξη 2,3% και πληθωρισμός 2,8% φέτος
ΤτΕ: Ανάπτυξη 2,3% και πληθωρισμός 2,8% φέτος
 
10 QuickBooks Tips 2024 - Globus Finanza.pdf
10 QuickBooks Tips 2024 - Globus Finanza.pdf10 QuickBooks Tips 2024 - Globus Finanza.pdf
10 QuickBooks Tips 2024 - Globus Finanza.pdf
 
Liquidity Decisions in Financial management
Liquidity Decisions in Financial managementLiquidity Decisions in Financial management
Liquidity Decisions in Financial management
 
The Inspirational Story of Julio Herrera Velutini - Global Finance Leader
The Inspirational Story of Julio Herrera Velutini - Global Finance LeaderThe Inspirational Story of Julio Herrera Velutini - Global Finance Leader
The Inspirational Story of Julio Herrera Velutini - Global Finance Leader
 
Aon-UK-DC-Pension-Tracker-Q1-2024. slideshare
Aon-UK-DC-Pension-Tracker-Q1-2024. slideshareAon-UK-DC-Pension-Tracker-Q1-2024. slideshare
Aon-UK-DC-Pension-Tracker-Q1-2024. slideshare
 
OAT_RI_Ep18 WeighingTheRisks_Mar24_GlobalCredit.pptx
OAT_RI_Ep18 WeighingTheRisks_Mar24_GlobalCredit.pptxOAT_RI_Ep18 WeighingTheRisks_Mar24_GlobalCredit.pptx
OAT_RI_Ep18 WeighingTheRisks_Mar24_GlobalCredit.pptx
 
Building pressure? Rising rents, and what to expect in the future
Building pressure? Rising rents, and what to expect in the futureBuilding pressure? Rising rents, and what to expect in the future
Building pressure? Rising rents, and what to expect in the future
 
Hello this ppt is about seminar final project
Hello this ppt is about seminar final projectHello this ppt is about seminar final project
Hello this ppt is about seminar final project
 
Thoma Bravo Equity - Presentation Pension Fund
Thoma Bravo Equity - Presentation Pension FundThoma Bravo Equity - Presentation Pension Fund
Thoma Bravo Equity - Presentation Pension Fund
 
ekthesi-trapeza-tis-ellados-gia-2023.pdf
ekthesi-trapeza-tis-ellados-gia-2023.pdfekthesi-trapeza-tis-ellados-gia-2023.pdf
ekthesi-trapeza-tis-ellados-gia-2023.pdf
 
Banking: Commercial and Central Banking.pptx
Banking: Commercial and Central Banking.pptxBanking: Commercial and Central Banking.pptx
Banking: Commercial and Central Banking.pptx
 
Money Forward Integrated Report “Forward Map” 2024
Money Forward Integrated Report “Forward Map” 2024Money Forward Integrated Report “Forward Map” 2024
Money Forward Integrated Report “Forward Map” 2024
 
2024-04-09 - Pension Playpen roundtable - slides.pptx
2024-04-09 - Pension Playpen roundtable - slides.pptx2024-04-09 - Pension Playpen roundtable - slides.pptx
2024-04-09 - Pension Playpen roundtable - slides.pptx
 
Crypto Confidence Unlocked: AnyKYCaccount's Shortcut to Binance Verification
Crypto Confidence Unlocked: AnyKYCaccount's Shortcut to Binance VerificationCrypto Confidence Unlocked: AnyKYCaccount's Shortcut to Binance Verification
Crypto Confidence Unlocked: AnyKYCaccount's Shortcut to Binance Verification
 
What is sip and What are its Benefits in 2024
What is sip and What are its Benefits in 2024What is sip and What are its Benefits in 2024
What is sip and What are its Benefits in 2024
 
2B Nation-State.pptx contemporary world nation
2B  Nation-State.pptx contemporary world nation2B  Nation-State.pptx contemporary world nation
2B Nation-State.pptx contemporary world nation
 
Gender and caste discrimination in india
Gender and caste discrimination in indiaGender and caste discrimination in india
Gender and caste discrimination in india
 
Global Economic Outlook, 2024 - Scholaride Consulting
Global Economic Outlook, 2024 - Scholaride ConsultingGlobal Economic Outlook, 2024 - Scholaride Consulting
Global Economic Outlook, 2024 - Scholaride Consulting
 
Introduction to Health Economics Dr. R. Kurinji Malar.pptx
Introduction to Health Economics Dr. R. Kurinji Malar.pptxIntroduction to Health Economics Dr. R. Kurinji Malar.pptx
Introduction to Health Economics Dr. R. Kurinji Malar.pptx
 

PwC Global Economy watch (mars 2014)

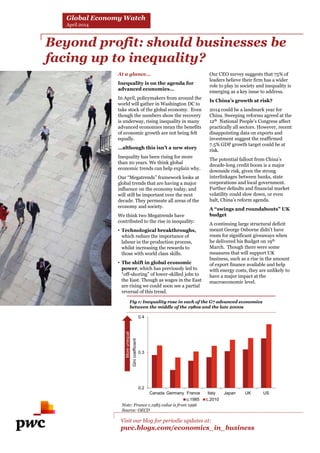
  • 1. Beyond profit: should businesses be facing up to inequality? Visit our blog for periodic updates at: pwc.blogs.com/economics_in_business Global Economy Watch April 2014 At a glance… Inequality is on the agenda for advanced economies… In April, policymakers from around the world will gather in Washington DC to take stock of the global economy. Even though the numbers show the recovery is underway, rising inequality in many advanced economies mean the benefits of economic growth are not being felt equally. …although this isn’t a new story Inequality has been rising for more than 20 years. We think global economic trends can help explain why. Our “Megatrends” framework looks at global trends that are having a major influence on the economy today, and will still be important over the next decade. They permeate all areas of the economy and society. We think two Megatrends have contributed to the rise in inequality: • Technological breakthroughs, which reduce the importance of labour in the production process, whilst increasing the rewards to those with world class skills. • The shift in global economic power, which has previously led to “off-shoring” of lower-skilled jobs to the East. Though as wages in the East are rising we could soon see a partial reversal of this trend. Our CEO survey suggests that 75% of leaders believe their firm has a wider role to play in society and inequality is emerging as a key issue to address. Is China’s growth at risk? 2014 could be a landmark year for China. Sweeping reforms agreed at the 12th National People’s Congress affect practically all sectors. However, recent disappointing data on exports and investment suggest the reaffirmed 7.5% GDP growth target could be at risk. The potential fallout from China’s decade-long credit boom is a major downside risk, given the strong interlinkages between banks, state corporations and local government. Further defaults and financial market volatility could slow down, or even halt, China’s reform agenda. A “swings and roundabouts” UK budget A continuing large structural deficit meant George Osborne didn’t have room for significant giveaways when he delivered his Budget on 19th March. Though there were some measures that will support UK business, such as a rise in the amount of export finance available and help with energy costs, they are unlikely to have a major impact at the macroeconomic level. Fig 1: Inequality rose in each of the G7 advanced economies between the middle of the 1980s and the late 2000s Source: OECD Note: France c.1985 value is from 1996 0.2 0.3 0.4 Canada Germany France Italy Japan UK US Ginicoefficient c.1985 c.2010 Moreunequal
  • 2. Economic update: swings and roundabouts UK budget won’t have a big macroeconomic impact The economic recovery is underway in the UK. The OBR has updated its forecasts for GDP growth to 2.7% in 2014 and 2.3% in 2015, very similar to the projections in our latest UK Economic Outlook report of 2.6% this year and 2.4% next year. Headline borrowing forecasts were down, but the structural budget deficit remains relatively large in the UK, as shown in Figure 2. The Chancellor therefore had limited room for manoeuvre and delivered a ‘swings and roundabouts’ Budget where ‘giveaways’ were broadly balanced by ‘takeaways’. which impacts the micro level of the economy more than the macro level. There is a lot more austerity to come, as reflected by the Chancellor’s new welfare spending cap, and projected real government spending cuts stretching out to 2018/19. Nonetheless, the Chancellor did announce some pro-growth measures which will provide a boost for business, including cuts in energy costs, a temporary rise in tax allowances for investment and more and cheaper export credit finance. While welcome, these measures are unlikely to be large enough to change the macroeconomic outlook for the UK economy as a whole. More details of this report are available at: http://www.pwc.co.uk/ukeo Fig 2: Of the G7 and peripheral Eurozone economies, only Japan has a bigger structural deficit than the UK Source: OECD Could downside risks derail China’s growth? China has seen a substantial credit-fuelled investment boom over the past decade. Credit to the private non-financial sector has grown from around 100% of GDP in 2000 to around 180% in 2013. This rate of increase is more dramatic than in most of the crisis-hit nations in the Eurozone. Deleveraging ahead Borrowing to invest (especially in a developing economy like China) is not a bad thing, provided that investment brings future economic benefits. However, non-performing loan levels at a 2 year high suggest this has not always been the case and underlines the need to rein in lending . This has already begun: new total social financing (a broad measure of liquidity and credit) fell more than 50% to 938.7 billion yuan in February from the previous month. A hard or soft landing? A raft of disappointing recent data suggests the risk of an economic slowdown in China this year. The latest purchasing managers’ index for manufacturing fell for the fourth consecutive month in March to a 7-month low. Annual growth in industrial output fell to 8.6% - strong by Western standards but the weakest growth rate for China since the global financial crisis. Investment fell 17.9% year-on-year, its weakest pace since 2000. Exports also disappointed, falling by 18.1% in February, even after accounting for distortions caused by the Lunar New Year celebrations . Finally, interbank markets have been unusually volatile. Banks suffered a liquidity crunch in December when interbank lending rates almost hit 10%. A “western-style” credit crunch is unlikely given the state’s involvement in the banking system, as subsequent intervention by the central bank showed. But continuing volatility could mean higher lending rates for riskier borrowers, including SMEs. An ambitious reform agenda 2014 is looking like a landmark year for reform in China across many sectors as the government seeks to reduce over-capacity of production. The historic default of Chaori (an otherwise unimportant solar cell maker) is indicative of the increasing liberalisation of markets. However, there are concerns that these reforms may be watered down in light of downside risks. For example, a sharp slowdown in lending could weigh on growth, putting pressure on the central bank to loosen money supply to support the recently reaffirmed 7.5% growth target. Highly-leveraged SOEs may be next, given the strong links between highly-indebted local governments, state-owned enterprises and banks. Risks to the quasi-public sector would surely see a roll-back on reforms. Reforms are needed These risks to growth also underline the importance of these much-needed reforms. The transition from the exports and investment-led growth model to a domestic consumption and services model will necessarily slow long-term growth, but it will reduce China’s vulnerability to external shocks and ensure sustainable growth. Opening up the banking sector to private capital will boost competition in financial services and reduce dependence on shadow banking. Pursuing these reforms may have some transitional costs, but are necessary to secure sustainable growth in the long-term for China. Fig 3: Loans to private non-financial sector Source: BIS, National Bureau of Statistics 80% 100% 120% 140% 160% 180% Q1 2000 Q1 2001 Q1 2002 Q1 2003 Q1 2004 Q1 2005 Q1 2006 Q1 2007 Q1 2008 Q1 2009 Q1 2010 Q1 2011 Q1 2012 Q1 2013 % of GDP -20 -15 -10 -5 0 5 Estimatedcyclicallyadjustedgovernment netlending(%ofpotentialGDP) 2009 2013
  • 3. Source: AMECO Inequality – is the Gini out of the bottle? Fig 4: The wage share of the economy has been falling in several advanced economies Source: PwC 17th Annual Global CEO Survey Fig 6: Three quarters of business leaders believe that their firm has a role to play in society Fig 5: Less inequality is associated with better conditions for growth Inequality is on the rise in key advanced economies As the economic recovery continues to take hold in advanced economies, substantial levels of inequality mean that the benefits of recovery are not being felt equally throughout the economy. For example the top 10% of wage earners in the US earned 48% of total income in 2012. Rising inequality is not a new phenomenon - in fact this is a trend lasting more than 20 years. Figure 1 shows that the Gini coefficient (a standard measure of inequality) rose in each of the G7 economies from around 1985 to around 2010. During that period the top 1% of the income earners in the US increased their share of total income by 10 percentage points from 1985 to 2012. Global Megatrends can help to explain why We think there are some important structural trends at play which can linked to broader “megatrends” in the global economy. In particular: • Technological breakthroughs are changing the role of labour in the production process. During the industrial revolution, technology reduced the need for labour to do physically repetitive tasks. Now, the digital revolution is reducing the need for labour to do mentally repetitive tasks. This partly explains why, in the US, we have seen the share of wages as a proportion of the economy decrease from around 61% in 1990 (approximately when the world wide web was invented) to 56% in 2013. • The shift in global economic power from the West to the East has given businesses in advanced economies more flexibility in deciding where to operate parts of their business. One side-effect of this has been offshoring of some lower value added activities to low-wage destinations. Inequality levels can have important implications for businesses. Recent IMF research suggests that higher levels of inequality are associated with lower levels of economic growth (see Figure 5). More equal economies can also mean a “broader base” of consumer spending, expanding the range of products that businesses can bring to market. They can also add to social cohesion, which may be important for sustainable growth. What does this mean for businesses? Technological advances and declining wage gaps with China and other emerging markets may mean reshoring of some jobs makes more commercial sense in future. For example, in our recent UK Economic Outlook, we estimated that reshoring could bring approximately 100,000-200,000 jobs back to the UK over the next decade. But it’s not just the bottom line, businesses are increasingly looking “beyond profit” to wider social issues (See Figure 6). One approach here is to look at alternative models with greater employee ownership of firms. This could help supplement wages, while also better aligning the interests of employees and the firm. There could be other upsides too: data suggests that listed UK companies with 10% or greater employee ownership have outperformed the FTSE All Share by an average of 7.7% a year since 2003. “Redistribution, inequality and growth”, IMF Staff Discussion Note, February 2014 50 55 60 65 70 75 1980 1985 1990 1995 2000 2005 2010 Adjustedwageshare(%ofGDP) Germany UK US Japan 31% 44% It's important for us to satisfy wider societal needs and protect interests of future generations Agree strongly Agree Source: IMF, OECD, PwC Calculations Note: West Germany data used for Germany from 1980-1990 -0.50 0.00 0.50 1.00 1.50 2.00 2.50 3.00 3.50 0.2 0.25 0.3 0.35 0.4 2004-13ave.GDPgrowth C.2004 Gini coefficient
  • 4. Projections: April 2014 Sources: PwC analysis, National statistical authorities, Thomson Datastream and IMF. All inflation indicators relate to the Consumer Price Index (CPI), with the exception of the Indian indicator which refers to the Wholesale Price Index (WPI). Argentinian inflation figures are based on the old price index which measure CPI in Greater Buenos Aires. A new index the "National and urban Consumer Price Index" (NuCPI) has now been released by INDEC the Argentinian statistical agency. We will monitor this new price index and will base our projection on this once we have several months of data available. Also note that the tables above form our main scenario projections and are therefore subject to considerable uncertainties. We recommend that our clients look at a range of alternative scenarios This publication has been prepared for general guidance on matters of interest only, and does not constitute professional advice. You should not act upon the information contained in this publication without obtaining specific professional advice. No representation or warranty (express or implied) is given as to the accuracy or completeness of the information contained in this publication, and, to the extent permitted by law, PricewaterhouseCoopers LLP, its members, employees and agents do not accept or assume any liability, responsibility or duty of care for any consequences of you or anyone else acting, or refraining to act, in reliance on the information contained in this publication or for any decision based on it. © 2014 PricewaterhouseCoopers LLP. All rights reserved. In this document, "PwC" refers to the UK member firm, and may sometimes refer to the PwC network. Each member firm is a separate legal entity. Please see www.pwc.com/structure for further details. 140123-203416-BK-OS Interest rate outlook of major economies Current rate (Last change) Expectation Next meeting Federal Reserve 0-0.25% (December 2008) QE tapering to continue during 2014 29/30 April European Central Bank 0.25% (November 2013) On hold 3 April Bank of England 0.5% (March 2009) On hold 3 April We help you understand how big economic, demographic, social, and environmental changes affect your organisation by setting out scenarios that identify growth opportunities and risks on a global, regional, national and local level. We help make strategic and tactical operational, pricing and investment decisions to support business value creation. We work together with you to achieve sustainable growth. PwC’s Global Consumer Index – March 2014 Global consumer spending growth picks up to 3.6% this month. Global equity market activity and market confidence dipped slightly in February. These are offset by increases in global money supply and supported by the rebound in US industrial production from last month, which marks a positive turn in businesses’ expectations of consumer demand over the next few months. Richard Boxshall T: +44 (0) 20 7213 2079 E: richard.boxshall@uk.pwc.com William Zimmern T: +44 (0) 20 7212 2750 E: william.zimmern@uk.pwc.com Barret Kupelian T: + 44 (0) 20 7213 1579 E: barret.g.kupelian@uk.pwc.com The GCI is a monthly updated index providing an early steer on consumer spending and growth prospects in the world’s 20 largest economies. For more information, please visit www.pwc.co.uk/globalconsumerindex 0.0% 0.5% 1.0% 1.5% 2.0% 2.5% 3.0% 3.5% 4.0% Apr-13 May-13 Jun-13 Jul-13 Aug-13 Sep-13 Oct-13 Nov-13 Dec-13 Jan-14 Feb-14 Mar-14 YoYgrowth Long-term growth 3.6% P P P * MER* 2013e 2014p 2015p 2016-2020p 2013e 2014p 2015p 2016-2020p Global (market exchange rates) 100% 2.5 3.1 3.2 3.2 4.8 5.2 5.6 4.7 Global (PPP rates) 100% 3.0 3.5 3.7 3.7 United States 19.5% 22.5% 1.9 3.0 3.0 2.4 1.5 1.8 1.9 1.9 China 14.7 % 11.4% 7 .7 7 .5 7 .2 7 .0 2.7 2.5 2.7 3.4 Japan 5.5% 8.3% 1.6 1.5 1.1 1.2 0.4 2.1 1.8 1.5 United Kingdom 2.8% 3.4% 1.7 2.6 2.4 2.4 2.6 1.8 1.9 2.0 Eurozone 13.5% 16.9% -0.4 1.0 1.3 1.5 1.4 1.3 1.5 1.9 France 2.7 % 3.6% 0.1 0.9 1.2 1.6 1.0 1.2 1.6 2.0 Germany 3.8% 4.7 % 0.5 1.7 1.9 1.5 1.6 1.7 1.8 2.0 Greece 0.3% 0.3% -3.8 0.2 1.8 2.5 -0.9 -0.3 0.1 1.0 Ireland 0.2% 0.3% 0.1 2.1 1.8 2.5 0.5 1.4 1.2 1.7 Italy 2.2% 2.8% -1.8 0.4 1.0 0.8 1.3 1.1 1.3 1.7 Netherlands 0.8% 1.1% -0.9 0.8 0.9 2.0 2.6 1.4 1.7 2.1 Portugal 0.3% 0.3% -1.2 1.3 1.6 1.8 0.4 0.5 1.2 1.5 Spain 1.7 % 1.8% -1.2 0.7 0.9 1.7 1.5 0.9 1.2 1.7 Poland 1.0% 0.7 % 1.5 3.2 3.4 3.9 1.2 1.4 2.5 2.5 Russia 3.0% 2.8% 1.6 2.0 2.9 3.8 6.8 5.8 5.3 5.6 Turkey 1.3% 1.1% 3.7 2.6 4.3 4.5 7 .5 8.0 6.5 4.8 Australia 1.2% 2.1% 2.4 2.7 3.0 3.1 2.4 2.8 2.6 2.7 India 5.7 % 2.6% 4.6 5.4 6.4 6.5 6.3 5.2 6.0 6.0 Indonesia 1.4% 1.2% 5.8 5.5 5.8 6.3 7 .0 6.2 5.3 5.1 South Korea 1.9% 1.6% 2.8 2.8 4.0 3.8 1.2 1.8 2.9 2.9 Argentina 0.9% 0.7 % 5.0 0.7 1.8 3.3 10.6 11.9 13.3 9.7 Brazil 2.8% 3.1% 2.3 1.8 2.5 4.0 6.2 6.1 5.6 4.8 Canada 1.8% 2.5% 1.7 2.3 2.5 2.2 0.9 1.7 1.9 2.1 Mexico 2.2% 1.6% 1.6 3.2 3.7 3.6 3.8 3.8 3.9 3.6 South Africa 0.7 % 0.5% 1.9 2.6 3.2 3.8 5.8 6.2 5.0 4.8 Saudi Arabia 1.1% 1.0% 3.8 4.4 4.2 4.3 3.5 3.1 3.5 4.0 Real GDP growth InflationS ha re o f 2 0 12 wo rld GDP