
Recommended
More Related Content
What's hot
Viewers also liked
Similar to Statistics for critical appraisal made easy
Similar to Statistics for critical appraisal made easy (20)
More from PaulaFunnell
More from PaulaFunnell (15)
Recently uploaded
Recently uploaded (20)
Statistics for critical appraisal made easy
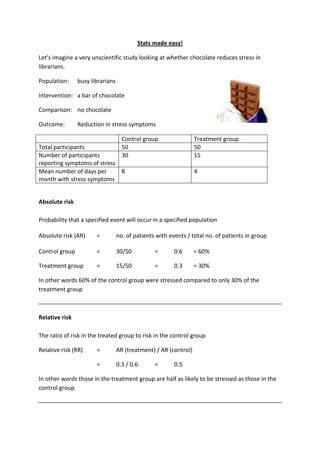
- 1. Stats made easy! Let's imagine a very unscientific study looking at whether chocolate reduces stress in librarians. Population: busy librarians Intervention: a bar of chocolate Comparison: no chocolate Outcome: Reduction in stress symptoms Control group Treatment group Total participants 50 50 Number of participants reporting symptoms of stress 30 15 Mean number of days per month with stress symptoms 8 4 Absolute risk Probability that a specified event will occur in a specified population Absolute risk (AR) = no. of patients with events / total no. of patients in group Control group = 30/50 = 0.6 = 60% Treatment group = 15/50 = 0.3 = 30% In other words 60% of the control group were stressed compared to only 30% of the treatment group Relative risk The ratio of risk in the treated group to risk in the control group Relative risk (RR) = AR (treatment) / AR (control) = 0.3 / 0.6 = 0.5 In other words those in the treatment group are half as likely to be stressed as those in the control group
- 2. Relative risk reduction The proportional reduction comparing the risk in the control group against the risk in the treatment group. Relative risk reduction = (1 – RR) x 100 (RRR) = (1 – 0.5) x 100 = 50 In other words giving chocolate to librarians reduces the risk of stress by half (or 50%) Absolute risk reduction The size of a difference between two treatments in terms of the actual numbers of people who experience the outcome. Absolute risk reduction = AR(control) – AR(treatment) (ARR) = 0.6 – 0.3 = 0.3 = 30% In other words chocolate will prevent 30% of librarians suffering from stress Both relative risk and absolute risk can be inverted to express increase rather than reduction if you’re looking at a study where events occur more times in the treatment group than the control group. Number needed to treat The number of patients you need to treat with a specific intervention to get one additional positive outcome (or one less negative outcome). Number needed to treat = 1/AAR = 1/03 = 3.3 In other words you’d need to give three librarians chocolate in order for one of them to see the benefit
- 3. Odds ratio The likelihood of an outcome occurringwith a particular exposure, compared to the likelihood of the outcome occurring without that exposure. Odds = no.with events / no.without = 30/20 (control) = 1.5 = 15/35 (treatment) = 0.43 Odd ratio = odds (treatment) / odds (control) = 0.43 / 1.5 = 0.29 In other words the odds of getting stressed are 30% less in librarians who eat chocolate Mean difference The average difference between the intervention group and the control group. Used when combining or comparing measures on continuous scales, such as weight. Mean difference = Mean value in control group - mean value in treatment group = 8 days – 4 days = 4 In other words librarians eating chocolate will, on average, have four less days of stress per month than those who don’t. Some things to bear in mind Odds ratio and risk ratio will be similar when an event is rare, but very different when the event is common. Be aware that the odds ratio can often show an intervention in a more positive light. Relative risk reduction and absolute risk reduction both show the decrease (or increase) of risk. However, because of the way they are calculated, the values can be quite different. Be aware that relative risk reduction tends to look more impressive so drug companies are likely to use this measure to make their drugs look more effective. Absolute risk reduction is a more accurate measure.