1. Malware Attack Vectors
25%
15%
17%
4% 4%
web-browsing
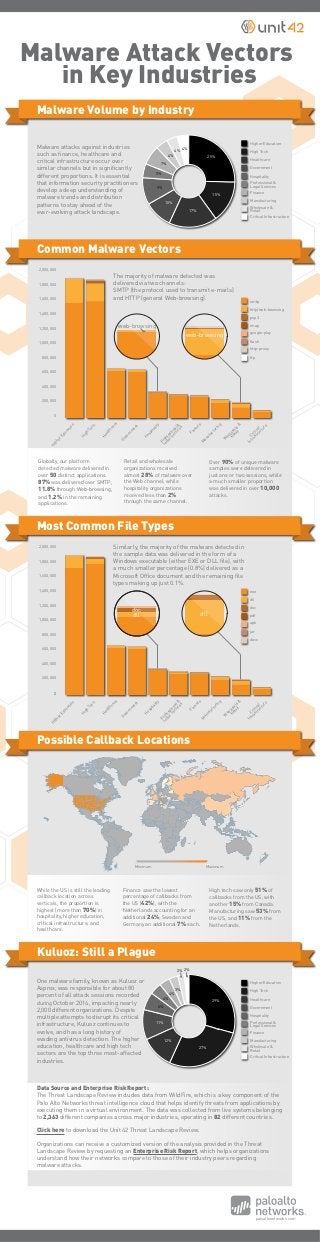
Malware attacks against industries
such as finance, healthcare and
critical infrastructure occur over
similar channels but in significantly
different proportions. It is essential
that information security practitioners
develop a deep understanding of
malware trends and distribution
patterns to stay ahead of the
ever-evolving attack landscape.
7%
4%
10%
5%
9%
Common Malware Vectors
web-browsing
2,000,000
1,800,000
2,000,000
1,800,000
1,600,000
1,400,000
1,200,000
1,000,000
800,000
600,000
400,000
200,000
0
in Key Industries
Malware Volume by Industry
Most Common File Types
Higher Education
High Tech
Healthcare
Government
Hospitality
Professional &
Legal Services
Finance
Manufacturing
Wholesale &
Retail
Critical Infrastructure
smtp
http/web-browsing
pop3
imap
google-play
flash
http-proxy
ftp
The majority of malware detected was
delivered via two channels:
SMTP (the protocol used to transmit e-mails)
and HTTP (general Web-browsing).
Higher Education
High Tech
Healthcare
Government
Hospitality
Professional &
Legal Services
Finance
Manufacturing
Wholesale &
Retail
1,600,000
1,400,000
1,200,000
1,000,000
800,000
600,000
400,000
200,000
0
Globally, our platform
detected malware delivered in
over 50 distinct applications.
87% was delivered over SMTP,
11.8% through Web-browsing,
and 1.2% in the remaining
applications.
Retail and wholesale
organizations received
almost 28% of malware over
the Web channel, while
hospitality organizations
received less than 2%
through the same channel.
Critical
Infrastructure
Over 90% of unique malware
samples were delivered in
just one or two sessions, while
a much smaller proportion
was delivered in over 10,000
attacks.
Higher Education
Similarly, the majority of the malware detected in
the sample data was delivered in the form of a
Windows executable (either EXE or DLL file), with
a much smaller percentage (0.8%) delivered as a
Microsoft Office document and the remaining file
types making up just 0.1%.
High Tech
Healthcare
doc
dll dll
Government
Hospitality
Professional &
Legal Services
Finance
Manufacturing
Wholesale &
Retail
exe
dll
doc
pdf
apk
jar
docx
Possible Callback Locations
While the US is still the leading
callback location across
verticals, the proportion is
highest (more than 70%) in
hospitality, higher education,
critical infrastructure, and
healthcare.
Minimum Maximum
Finance saw the lowest
percentage of callbacks from
the US (42%), with the
Netherlands accounting for an
additional 24%; Sweden and
Germany an additional 7% each.
Kuluoz: Still a Plague
One malware family, known as Kuluoz or
Asprox, was responsible for about 80
percent of all attack sessions recorded
during October 2014, impacting nearly
2,000 different organizations. Despite
multiple attempts to disrupt its critical
infrastructure, Kuluoz continues to
evolve, and has a long history of
evading antivirus detection. The higher
education, healthcare and high tech
sectors are the top three most-affected
industries.
Critical
Infrastructure
High tech saw only 51% of
callbacks from the US, with
another 15% from Canada.
Manufacturing saw 53% from
the US, and 11% from the
Netherlands.
Higher Education
High Tech
Healthcare
Government
Hospitality
Professional &
Legal Services
Finance
Manufacturing
Wholesale &
Retail
Critical Infrastructure
4%
6%
2% 2%
Data Source and Enterprise Risk Report:
The Threat Landscape Review includes data from WildFire, which is a key component of the
Palo Alto Networks threat intelligence cloud that helps identify threats from applications by
executing them in a virtual environment. The data was collected from live systems belonging
to 2,363 different companies across major industries, operating in 82 different countries.
Click here to download the Unit 42 Threat Landscape Review.
Organizations can receive a customized version of the analysis provided in the Threat
Landscape Review by requesting an Enterprise Risk Report, which helps organizations
understand how their networks compare to those of their industry peers regarding
malware attacks.
paloaltonetworks.com
29%
27%
12%
11%
4%
3%