1. U.S.D.A. Foreign Agricultural Services – Linking U.S. agriculture to the World
http://www.fas.usda.gov/regions/peru
Email: AgLima@FAS.USDA.gov
Tel: (+51-1) 618-2491 or (+51-1) 434-3042
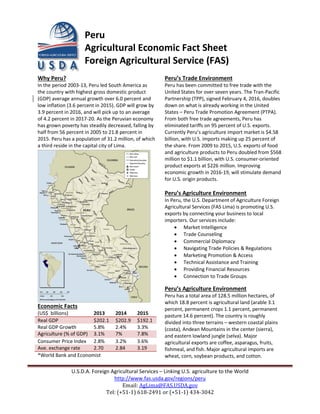
Peru
Agricultural Economic Fact Sheet
Foreign Agricultural Service (FAS)
Why Peru?
In the period 2003-13, Peru led South America as
the country with highest gross domestic product
(GDP) average annual growth over 6.0 percent and
low inflation (3.6 percent in 2015). GDP will grow by
3.9 percent in 2016, and will pick up to an average
of 4.2 percent in 2017-20. As the Peruvian economy
has grown poverty has steadily decreased, falling by
half from 56 percent in 2005 to 21.8 percent in
2015. Peru has a population of 31.2 million, of which
a third reside in the capital city of Lima.
Economic Facts
*World Bank and Economist
Peru’s Trade Environment
Peru has been committed to free trade with the
United States for over seven years. The Tran-Pacific
Partnership (TPP), signed February 4, 2016, doubles
down on what is already working in the United
States – Peru Trade Promotion Agreement (PTPA).
From both free trade agreements, Peru has
eliminated tariffs on 95 percent of U.S. exports.
Currently Peru’s agriculture import market is $4.58
billion, with U.S. imports making up 25 percent of
the share. From 2009 to 2015, U.S. exports of food
and agriculture products to Peru doubled from $568
million to $1.1 billion, with U.S. consumer-oriented
product exports at $226 million. Improving
economic growth in 2016-19, will stimulate demand
for U.S. origin products.
Peru’s Agriculture Environment
In Peru, the U.S. Department of Agriculture Foreign
Agricultural Services (FAS Lima) is promoting U.S.
exports by connecting your business to local
importers. Our services include:
Market Intelligence
Trade Counseling
Commercial Diplomacy
Navigating Trade Policies & Regulations
Marketing Promotion & Access
Technical Assistance and Training
Providing Financial Resources
Connection to Trade Groups
Peru’s Agriculture Environment
Peru has a total area of 128.5 million hectares, of
which 18.8 percent is agricultural land (arable 3.1
percent, permanent crops 1.1 percent, permanent
pasture 14.6 percent). The country is roughly
divided into three terrains – western coastal plains
(costa), Andean Mountains in the center (sierra),
and eastern lowland jungle (selva). Major
agricultural exports are coffee, asparagus, fruits,
fishmeal, and fish. Major agricultural imports are
wheat, corn, soybean products, and cotton.
(US$ billions) 2013 2014 2015
Real GDP $202.1 $202.9 $192.1
Real GDP Growth 5.8% 2.4% 3.3%
Agriculture (% of GDP) 3.1% 7% 7.8%
Consumer Price Index 2.8% 3.2% 3.6%
Ave. exchange rate 2.70 2.84 3.19
2. U.S.D.A. Foreign Agricultural Services – Linking U.S. agriculture to the World
http://www.fas.usda.gov/regions/peru
Email: AgLima@FAS.USDA.gov
Tel: (+51-1) 618-2491 or (+51-1) 434-3042
23.9%
23.8%
5.6%
4.9%
4.2%
0.0% 10.0% 20.0% 30.0%
United States
China
Brazil
Mexico
Ecuador
Peru’s Global Trade (billion)
All Products Agriculture
Year Exports Imports Exports Imports
2013 $41.9 $43.7 $4.2 $4.4
2014 $38.4 $42.3 $5.1 $4.6
2015 $33.5 $37.9 $5.1 $4.3
2016* $10.0 $11.4 $1.4 $1.3
*Jan.-Apr. 2016
Peru’s Leading Import Suppliers (2015)
Peru’s Leading Export Markets (2015)
Agricultural Trade between U.S. and Peru
2013 2014 2015 2016*
Total U.S.
Agriculture
Exports to
Peru
$840.8 $1286.4 $1,141.3 $395.9
Total U.S.
Agriculture
Imports
from Peru
$1524.4 $1885.6 $1919.0 $633.7
* Jan.- Apr. 2016
Major U.S. Agricultural (bulk) Exports to Peru
2013 2014 2015 2016*
Bulk Total $428.
0
$816.
1
$575.
2
$203.
4
Wheat $205.
9
$165.
0
$88.2 $13.1
Corn $51.6 $477.
3
$302.
5
$145.
2
Soybeans $22.6 $20.1 $60.1 $10.8
Cotton $128.
3
$129.
9
$95.7 $25.9
Pulses $19.3 $18.3 $20.6 $7.0
Major U.S. Agricultural (bulk) Imports From Peru
2013 2014 2015 2016
Coffee,
Unroasted
$172.
9
$209.
2
$177.
4
$36.0
Raw Beets &
Sugar Cane
$12.4 $32.4 $13.0 $15.2
Major U.S. Consumer-Oriented Products Exported
to Peru (millions)
2013 2014 2015 2016*
Beef $32.6 $33.7 $25.4 $6.5
Pork $5.7 $6.7 $9.9 $1.8
Dairy $61.4 $69.2 $73.4 $19.7
Chocolate $15.9 $22 $14.5 $4.5
Prepared
Foods
$25.0 $29.7 $25.5 $11.5
Poultry $12.6 $9.5 $9.3 $5.5
Pet Food $5.1 $5.4 $7.0 $2.1
Fruits & Veg. $12.9 $24.7 $20.6 $7.6
U.S. Consumer-Oriented Products Imported from
Peru (millions)
2013 2014 2015 2016*
Fresh Fruits $218.1 $402.3 $492.1 $201.7
Fresh
Vegetables
$326.2 $318.3 $340.9 $63.9
Processed
Fruits & Veg.
$269.5 $295.9 $312.2 $110.9
Spices $51.6 $61.0 $65.1 $16.9
(US$ millions) *Jan.-Apr
21.0%
14.4%
7.1%
7.0%
4.2%
4.1%
0.0% 10.0% 20.0% 30.0%
China
United States
Switzerland
Canada
Brazil
Japan