Global growth update
•Als DOCX, PDF herunterladen•
0 gefällt mir•90 views

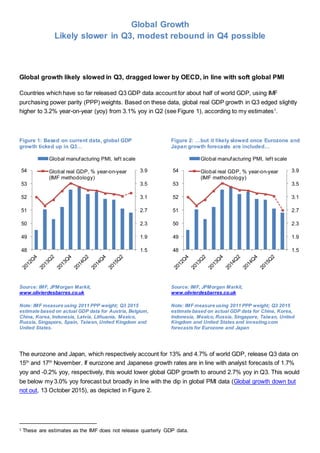
Countries which have so far released Q3 GDP data account for about half of world GDP, using IMF purchasing power parity (PPP) weights. Based on these data, global real GDP growth in Q3 edged slightly higher to 3.2% year-on-year (yoy) from 3.1% yoy in Q2 (see Figure 1), according to my estimates.

Empfohlen
Empfohlen
Weitere ähnliche Inhalte
Was ist angesagt?
Was ist angesagt? (20)
Andere mochten auch
Andere mochten auch (6)
Ähnlich wie Global growth update
Ähnlich wie Global growth update (20)
Kürzlich hochgeladen
Kürzlich hochgeladen (20)
Global growth update
- 1. Global Growth Likely slower in Q3, modest rebound in Q4 possible Global growth likely slowed in Q3, dragged lower by OECD, in line with soft global PMI Countries which have so far released Q3 GDP data account for about half of world GDP, using IMF purchasing power parity (PPP) weights. Based on these data, global real GDP growth in Q3 edged slightly higher to 3.2% year-on-year (yoy) from 3.1% yoy in Q2 (see Figure 1), according to my estimates1 . Figure 1: Based on current data, global GDP growth ticked up in Q3… Figure 2: …but it likely slowed once Eurozone and Japan growth forecasts are included… Source: IMF, JPMorgan Markit, www.olivierdesbarres.co.uk Note: IMF measure using 2011 PPP weight; Q3 2015 estimate based on actual GDP data for Austria, Belgium, China, Korea, Indonesia, Latvia, Lithuania, Mexico, Russia, Singapore, Spain, Taiwan, United Kingdom and United States. Source: IMF, JPMorgan Markit, www.olivierdesbarres.co.uk Note: IMF measure using 2011 PPP weight; Q3 2015 estimate based on actual GDP data for China, Korea, Indonesia, Mexico, Russia, Singapore, Taiwan, United Kingdom and United States and investing.com forecasts for Eurozone and Japan The eurozone and Japan, which respectively account for 13% and 4.7% of world GDP, release Q3 data on 15th and 17th November. If eurozone and Japanese growth rates are in line with analyst forecasts of 1.7% yoy and -0.2% yoy, respectively, this would lower global GDP growth to around 2.7% yoy in Q3. This would be below my 3.0% yoy forecast but broadly in line with the dip in global PMI data (Global growth down but not out, 13 October 2015), as depicted in Figure 2. 1 These are estimates as the IMF does not release quarterly GDP data. 1.5 1.9 2.3 2.7 3.1 3.5 3.9 48 49 50 51 52 53 54 Global manufacturing PMI, left scale Global real GDP, % year-on-year (IMF methodology) 1.5 1.9 2.3 2.7 3.1 3.5 3.9 48 49 50 51 52 53 54 Global manufacturing PMI, left scale Global real GDP, % year-on-year (IMF methodology)
- 2. It would also imply GDP growth in the OECD having slowed to around 1.8% yoy in Q3 from 2.2% yoy in Q2 (see Figure 3). GDP growth in non-OECD countries which have so far reported Q3 data – including China, Indonesia, Russia and Singapore – was broadly unchanged or slightly stronger than in Q2. One notable exception is Taiwan where GDP growth slowed to -1% yoy in Q3 from 0.5% yoy in Q2 (see Figure 3). This leaves Taiwan’s central bank (CBC) in somewhat of a bind. It would want to stimulate growth via looser policy but the recent jump inflation, not to mention the possible December Fed rate hike, probably does not afford it the room. CPI-inflation averaged 0.3% yoy in September-October, up from -0.45% yoy in August (see More EM central banks to join rate-cutting party, 30 September 2015). Figure 3: …in large part due to likely slowdown in OECD growth Figure 4: Asian imports picked up in October but exports contracted Source: OECD, www.olivierdesbarres.co.uk Note: For OECD Q3 2015 estimate is based on 2011 PPP weights and includes actual data for Austria, Belgium, Korea, Mexico, Singapore, Spain, United Kingdom and United States and investing.com forecasts for Eurozone and Japan Source: National statistics offices, www.olivierdesbarres.co.uk What about Q4? Global manufacturing PMI, which continues to prove a reasonably accurate forward looking indicator for global growth, ticked up in October to a seven-month high of 51.4. Of course one should take a singular positive PMI point with a pinch of salt, particularly as available data suggest that other drivers of growth such as global trade were soft in October. While aggregate merchandise imports for China, Korea and Taiwan picked up in October (in seasonally-adjusted terms), exports contracted (see Figure 4). Assuming unchanged global growth of 2.7% yoy in Q4, growth in the full-year 2015 would fall to 2.9% from 3.4% in 2014. This would be slightly below the IMF’s latest forecast of 3.1% (see Figure 5) and the slowest annual growth since 2009 (see Figure 6). The OECD earlier this week revised down its global growth forecasts for 2015 and 2016 to 2.9% and 3.3%, respectively, from 3.0% and 3.6%. Note that this does not -2 0 2 4 6 8 10 12 2011-Q1 2012-Q2 2013-Q3 2014-Q4 OECD China Taiwan GDP growth, % year-on-year 180 200 220 240 260 280 300 320 Jan-11 Mar-12 May-13 Jul-14 Sep-15 Exports Imports Merchandise trade for China, Korea and Taiwan seasonally adjusted ($ bn)
- 3. necessarily imply that the OECD is markedly more pessimistic than the IMF as the two institutions use slightly different country weights. Figure 5: OECD has again revised down its growth forecasts Figure 6: 2015 likely to record slowest growth since 2009 Source: IMF, World Bank, OECD www.olivierdesbarres.co.uk Source: IMF, OECD www.olivierdesbarres.co.uk 2.0 2.5 3.0 3.5 4.0 2015 new 2015 old 2016 new 2016 old IMF OECD World Bank Average Global GDP growth forecasts, % 2.0 2.5 3.0 3.5 4.0 4.5 5.0 5.5 2010 2011 2012 2013 2014 2015f Global GDP growth (%) IMF OECD