BDSM⚡Call Girls in Indirapuram Escorts >༒8448380779 Escort Service
Ocean City High School report card 2013-14
1. OVERVIEW
2013-14
1
501 ATLANTIC AVENUE
09-3780-050
OCEAN CITY, NJ 08226
CAPE MAY
OCEAN CITY
OCEAN CITY HIGH SCHOOL
State of New Jersey
GRADE SPAN 09-12
Very High Performance is defined as being equal to or above the 80th percentile.
High Performance is defined as being between the 60th and 79.9th percentiles.
Average Performance is defined as being between the 40th and 59.9th percentiles.
Lagging Performance is defined as being between the 20th and 39.9th percentiles.
Significantly Lagging Performance is defined as being equal to or below the 19.9th percentile.
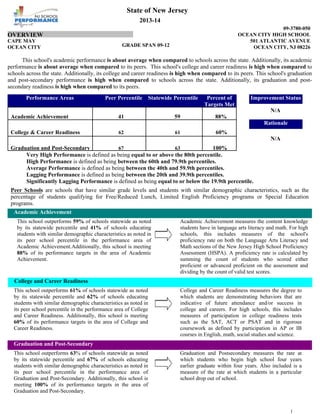
This school's academic performance is about average when compared to schools across the state. Additionally, its academic
performance is about average when compared to its peers. This school's college and career readiness is high when compared to
schools across the state. Additionally, its college and career readiness is high when compared to its peers. This school's graduation
and post-secondary performance is high when compared to schools across the state. Additionally, its graduation and post-
secondary readiness is high when compared to its peers.
Improvement Status
N/A
Rationale
N/A
Peer Schools are schools that have similar grade levels and students with similar demographic characteristics, such as the
percentage of students qualifying for Free/Reduced Lunch, Limited English Proficiency programs or Special Education
programs.
This school outperforms 59% of schools statewide as noted
by its statewide percentile and 41% of schools educating
students with similar demographic characteristics as noted in
its peer school percentile in the performance area of
Academic Achievement.Additionally, this school is meeting
88% of its performance targets in the area of Academic
Achievement.
Academic Achievement
Academic Achievement measures the content knowledge
students have in language arts literacy and math. For high
schools, this includes measures of the school's
proficiency rate on both the Language Arts Literacy and
Math sections of the New Jersey High School Proficiency
Assessment (HSPA). A proficiency rate is calculated by
summing the count of students who scored either
proficient or advanced proficient on the assessment and
dividing by the count of valid test scores.
College and Career Readiness measures the degree to
which students are demonstrating behaviors that are
indicative of future attendance and/or success in
college and careers. For high schools, this includes
measures of participation in college readiness tests
such as the SAT, ACT or PSAT and in rigorous
coursework as defined by participation in AP or IB
courses in English, math, social studies and science.
This school outperforms 61% of schools statewide as noted
by its statewide percentile and 62% of schools educating
students with similar demographic characteristics as noted in
its peer school percentile in the performance area of College
and Career Readiness. Additionally, this school is meeting
60% of its performance targets in the area of College and
Career Readiness.
College and Career Readiness
This school outperforms 63% of schools statewide as noted
by its statewide percentile and 67% of schools educating
students with similar demographic characteristics as noted in
its peer school percentile in the performance area of
Graduation and Post-Secondary. Additionally, this school is
meeting 100% of its performance targets in the area of
Graduation and Post-Secondary.
Graduation and Post-Secondary
Graduation and Postsecondary measures the rate at
which students who begin high school four years
earlier graduate within four years. Also included is a
measure of the rate at which students in a particular
school drop out of school.
Academic Achievement
College & Career Readiness
41 59
60%
100%
62 61
6367
Percent of
Targets Met
Graduation and Post-Secondary
Performance Areas Peer Percentile
88%
Statewide Percentile
1.00
2. DEMOGRAPHIC INFORMATION
2.00
2013-14
2
501 ATLANTIC AVENUE
09-3780-050
OCEAN CITY, NJ 08226
CAPE MAY
OCEAN CITY
OCEAN CITY HIGH SCHOOL
State of New Jersey
GRADE SPAN 09-12
2013-14 Percent
Spanish 1.3%
Philippine languages 0.2%
Chinese 0.2%
Mon-Khmer languages 0.1%
Tagalog 0.1%
Other 0.2%
Language Diversity
This table presents the percentage of students who
primarily speak each language in their home.
English 98.0%
2011-12 2012-13 2013-14
Total School Enrollment Trends
EnrollmentCount
0
200
400
600
800
1000
1200
1400
296
21
318
294
295 307
23
314
293298
290
20
308
331 297 UG
12
11
10
09
Enrollment by Grade
This graph presents the count of students who were 'on roll' by
grade in October of each school year.
Total School Enrollment
1,2582011-12
1,2272012-13
1,2182013-14
Note: "UG" represents the count of students who are 'on
roll' in this school but who are educated in ungraded
classrooms, meaning that the classrooms may contain
students from multiple grade levels.
Two
or
More
Races
0.4%
Pacific
0.2%
Indian
0.2%
1.9%
3.8%
2.4%
White
91.1%
White
Black
Hispanic
Asian
American Indian
Pacific Islander
Two or More Races
Enrollment by Ethnic/Racial Subgroup
This graph presents the percentages of enrollment for each
subgroup defined by the No Child Left Behind Act of 2001
2011-12 2012-13 2013-14
0
100
200
300
400
500
600
700
Male
Female
Enrollment by Gender
This graph presents the count of students by gender who were 'on roll' in
October of each school year.
6522011-12
6302012-13
6372013-14
607
597
582
Male Female
DISABILITY ECONDIS LEP
PercentofEnrollment
0
4
8
12
16
20
18
14
18
3
0
12
0
15
0
2011-12
2012-13
2013-14
Enrollment Trends by Program Participation
Current Year Enrollment by Program Participation
Count of
Students
% of
Enrollment
2013-2014
Economically Disadvantaged
Students
0
216
0.0%
17.7%
Students with Disability 12%145
Limited English Proficient
Students
3. ACADEMIC ACHIEVEMENT
2013-14
3
501 ATLANTIC AVENUE
09-3780-050
OCEAN CITY, NJ 08226
CAPE MAY
OCEAN CITY
OCEAN CITY HIGH SCHOOL
State of New Jersey
GRADE SPAN 09-12
Academic Achievement measures the content knowledge students have in Language Arts Literacy and Math. In high schools, this
includes the outcomes of the New Jersey High School Proficiency Assessment (HSPA). The first column - Schoolwide Performance - in
the table below includes measures of the total schoolwide proficiency rate in both Language Arts Literacy and Math across multiple
administrations of the assessment. The second column - Peer School Percentile - indicates where the school's proficiency rate compares
to its group of peer schools. For example, a school that has a peer school percentile of 65 has a proficiency rate that is higher than 65%
of its peer schools. The third column - Statewide Percentile - indicates where the school's proficiency rate compares to schools across
the state. For example, a school that has a statewide percentile of 30 has a proficiency rate that is higher than 30% of all schools with
HSPA scores statewide. The last column - Percent of Targets Met - presents the percentage of progress targets met as defined by the
NJDOE’s NCLB waiver.
The Summary row presents the averages of the peer school percentiles, the average of statewide percentiles and the percentage of
statewide targets met.
91%
96%
5941
100%
75%
88%
5223
6558
Academic Achievement Indicators
Schoolwide
Performance
State
Percentile
Percent of Targets Met
HSPA Math Proficiency and above
SUMMARY - Academic Achievement
Peer
Percentile
HSPA Language Arts Proficiency and above
NCLB Progress Targets - Language Arts Literacy
This table presents the Progress Targets as uniquely calculated for each
subgroup in each school under NJDOE’s NCLB waiver. The
methodology - as defined by the United States Department of Education
- is calculated so that each subgroup will halve the gap between their
2011 proficiency rate and 100% proficiency by 2017.
Schoolwide 90293 95.9
White 90272 96.3
Black - -
Hispanic - -
American Indian - -
Asian - -
Two or More Races - -
Students with Disability 78.242 71.4
- -
8846 91.3
YES* = Met Progress Target (Confidence Interval Applied)
Data is presented for subgroups when the count is high enough under
NCLB suppression rules.
Met
Target?
TargetPass
Rate
Subgroups
YES
YES
--
--
--
--
--
YES*
--
YES
Total Valid
Scores
Limited English Proficient
Students
Economically
Disadvantaged Students
2010-11 2011-12 2012-13 2013-14
0
20
40
60
80
100100
2824
76
4
71
5
1919
45
68
77
Advanced Proficient Proficient
Partially Proficient
Proficiency Trends - Language Arts Literacy
This graph presents the percentage of students who scored in
the Advanced Proficient, Proficient and Partially Proficient
categories of the statewide Language Arts Literacy assessment
over the prior four years.
4. ACADEMIC ACHIEVEMENT
2013-14
4
501 ATLANTIC AVENUE
09-3780-050
OCEAN CITY, NJ 08226
CAPE MAY
OCEAN CITY
OCEAN CITY HIGH SCHOOL
State of New Jersey
GRADE SPAN 09-12
2010-11 2011-12 2012-13 2013-14
0
20
40
60
80
100100
2928
62
9
60
12
2529
89
6267
Advanced Proficient Proficient
Partially Proficient
Proficiency Trends - Math
This graph presents the percentage of students who scored in
the Advanced Proficient, Proficient and Partially Proficient
categories of the statewide Math assessment over the prior four
years.
90292 91.1
90271 91.9
- -
- -
- -
- -
- -
69.141 51.2
- -
81.545 84.4
NCLB Progress Targets - Math
This table presents the Progress Targets as uniquely calculated for each
subgroup in each school under NJDOE’s NCLB waiver. The
methodology - as defined by the United States Department of
Education - is calculated so that each subgroup will halve the gap
between their 2011 proficiency rate and 100% proficiency by 2017.
YES* = Met Progress Target(Confidence Interval Applied)
Data is presented for subgroups when the count is high enough under
NCLB suppression rules.
YES
YES
--
--
--
--
--
NO
--
YES
Target
Pass
Rate
Subgroups
Schoolwide
White
Black
Hispanic
American Indian
Asian
Two or More Races
Students with Disability
Met
Target?
Total Valid
Scores
Limited English Proficient
Students
Economically Disadvantaged
Students
2010-11 2011-12 2012-13 2013-14
0
20
40
60
80
100100
1417
46
31
43
40
2417
27
37
55
49
Advanced Proficient Proficient
Partially Proficient
Proficiency Trends - Biology
This graph presents the percentage of students who scored in
the Advanced Proficient, Proficient, and Partially Proficient
categories of the Biology Competency Test over the last two
years.
This table presents the percentage of students who scored in the
Advanced Proficient, Proficient and Partially Proficient categories of
the New Jersey Biology Competency Test (NJBCT) in the latest school
year.
13% 31%55%
14% 30%56%
- --
- --
- --
- --
- --
6% 79%15%
- --
10% 48%43%
Proficiency Outcomes - Biology
Data is presented for subgroups when the count is high enough under
NCLB suppression rules.
Subgroups
Partially
Proficient
Schoolwide
White
Black
Hispanic
American Indian
Asian
Two or More Races
Students with Disability
Limited English Proficient Students
Economically Disdvantaged Students
Advanced Proficient
3.00
5. COLLEGE AND CAREER READINESS
2013-14
5
501 ATLANTIC AVENUE
09-3780-050
OCEAN CITY, NJ 08226
CAPE MAY
OCEAN CITY
OCEAN CITY HIGH SCHOOL
State of New Jersey
GRADE SPAN 09-12
Students in high schools begin to demonstrate college readiness behaviors long before they actually graduate from high school.
Among those behaviors are taking college entrance exams and challenging themselves with rigorous course work. The table below
presents five such indicators: the percentage of students enrolled in the 12th grade who took the SAT or ACT, the percentage of 10th and
11th graders who took the PSAT, the percentage of students who scored above the SAT benchmark of 1550, the percentage of 11th and
12th graders who took at least one AP or IB test in English, math, social studies or science, and the percentage of those AP or IB tests
that were scored a 3 or higher.
The first column - Schoolwide Performance - represents the outcomes for these particular inidcators in the school. The second
column - Peer School Percentile - indicates how the school's performance compares to its group of peer schools. For example, a school
whose peer school percentile is 65 in SAT participation has a higher SAT Participation than 65% of its peer group. The third column -
Statewide Percentile - indicates how the school's performance compares to schools across the state. The fourth column - Statewide Target
- provides the statewide targets for each of these indicators. The last column - Met Target? - indicates whether the School Performance
met or exceeded the statewide target.
The Summary row presents the averages of the peer school percentiles, the average of statewide percentiles and the percentage of
statewide targets met.
2010-11 2011-12 2012-13 2013-14
Year
ParticipationRate
0
20
40
60
80
100
8482 8082
Participation Trends - SAT Testing
This graph presents the participation rate in the SAT over the last four
years.
College Readiness Test Participation AP/IB Participation - 'Unique' Students
The first column of the table below presents the percentage of
students enrolled in the 12th grade who took the SAT or ACT and the
percentage of students enrolled in 10th and 11th grade who took the
PSAT. The second column provides the average across the school's peer
group for these two metrics.
The table below presents the proportion of 'unique' students
enrolled in at least 11th and 12th grade i.e, each student is counted once
regardless of how many AP or IB courses he/she may take. The table
also presents the proportion of how many 'unique' students took at least
one AP or IB test to the school's enrollment in 11th and 12th grade.
Note: Students who are enrolled in AP/IB coursework or take AP/IB
tests in grades other than 11th and 12th are included in the numerator of
this calculation.
AP /IB Test Results
This table presents the percentage of all AP/IB tests taken by students
enrolled in the school that were scored AP >= 3 and scored IB >= 4.
Participating in SAT
State Avg.
Participating in ACT
69.7%
45.2%
28.8%
69.8%
71.5%
76.2%
75.0%
34.2%
28.4%
18.9%
74.1%
72.4%
22.5%
78.6%
75.7%
75.3%
75.5%
49%
80%
60%
40%
35%
75%
62 61
85%
29%
70%
60%
74
57
5781
5042
6868
87
32
75%
Percent of Students Participating in SAT or ACT
Percent of Students Scoring Above 1550 on SAT
Met
Target?
Peer
Percentile
Statewide
Percentile
Schoolwide
Performance
College and Career Readiness
Indicators
Summary
2013-14 Percent of Students
One or More Test
School
State
Avg.
2013-14
State
Avg.
One or More Course83.8%
41.4%
33.4%
26.8%
22.2%
74.5%
Percent of Students Taking at least one AP Test or
IB Test in English, Math, Social Studies or Science
Percent of AP Tests >= 3 or IB Test >= 4 in
English, Math, Social Studies or Science
Participating in PSAT or PLAN
Peer Avg.
Peer
Avg.
2013-14 Percent of Students
Taking
School
Peer
Avg.
Percent of AP Tests >= 3 or IB Test >= 4
Percent of Scores in AP >= 3 or IB >= 4 in
English, Math, Social Studies or Science
YES
YES
YES
NO
NO
Percent of Students Participating in PSAT or PLAN
Statewide
Target
School
At least one AP or IB Test in English,
Math, Social Studies or Science
6. COLLEGE AND CAREER READINESS
2013-14
6
501 ATLANTIC AVENUE
09-3780-050
OCEAN CITY, NJ 08226
CAPE MAY
OCEAN CITY
OCEAN CITY HIGH SCHOOL
State of New Jersey
GRADE SPAN 09-12
2010-11 2011-12 2012-13 2013-14
Year
%above1550
0
20
40
60
80
100
49.0
40.2 39.240.0
PERCENT SAT ABOVE
1550
SAT Benchmark Trends
This chart presents the percentage of students who achieved a composite SAT score of 1550 or
higher over the past four years.
Scholastic Assessment Test (SAT) Results
This table presents the percentage of students who achieved a
composite SAT score of 1550 or higher. The SAT benchmark score of
1550 (Critical Reading, Mathematics and Writing Score combined)
indicates a 65 percent likelihood of achieveing a B- average or higher
during the first year of college, which in turn has been found by the
College Board's research to be indicative of a high likelihood of college
success and completion.
Composite SAT Score
This chart presents the average composite SAT score from the
last academic year for students enrolled in this school as well as the
average scores achieved in Critical Reading, Mathematics and
Writing. The averages from this school’s peer group are also
presented.
This chart presents the scores achieved in Critical Reading,
Mathematics and Writing by the students at the 25th percentile,
the 50th percentile and the 75th percentile of the school's
distribution of SAT scores.
State Avg.
25th Percentile
49.0% 44.6%47.7%
1,541
511
534
496
496
521
497
1,5141,544
507
529
508
560
490
430450
510
570 600
530
450
2013-14 School
2013-14
Critical Reading
Mathematics
Writing
State Avg.
50th Percentile
75th Percentile
WritingCritical Reading2013-14
Peer Avg.School
Composite SAT Score
Peer Avg.
Percent of Students Scoring
Above 1550 on SAT
Mathematics
AP/IB Courses Offered
This table presents the count of students enrolled in each
AP/IB course offered in this school in the first column. The second
column presents the count of tests taken in each AP/IB course. The
numbers may not match as some students do not take the test in the
same year as they take the course and some students may take the
course without taking the test or vice versa.
70185
107135
66104
2953
4549
4247
2837
1934
2734
2332
2631
1016
1214
1211
011
88
66
AP/IB Course Name
Students
Tested
AP U.S. History
AP Psychology
AP Statistics
AP U.S. Government and Politics
AP Calculus AB
AP English Language and Composition
AP Human Geography
AP Physics B
AP English Literature and Composition
AP Biology
AP Chemistry
AP World History
AP Calculus BC
AP Spanish Language
AP Studio Art-Drawing Portfolio
AP French Language
AP Computer Science A
Students
Enrolled
7. COLLEGE AND CAREER READINESS
2013-14
7
501 ATLANTIC AVENUE
09-3780-050
OCEAN CITY, NJ 08226
CAPE MAY
OCEAN CITY
OCEAN CITY HIGH SCHOOL
State of New Jersey
GRADE SPAN 09-12
The chart below contains the percentage of students who were enrolled in at least one Dance,
Drama/Theater, Music or Visual Arts class in this school. The last row shows the percentage of
students who were enrolled in any Visual and Performing Arts classes in the school.
Visual and Performing Arts
N/R - Data Not Reported
2.1%
3.9%
17.5%
31.1%
49.3%
N/R
2.8%
20.5%
34.1%
53.1%
Percent of Students Enrolled
Dance
Drama/Theater
Music
Visual Arts
Total: All Visual and Performing Arts
School State
Career in Technical Education Programs
The chart below contains percentage of students who were participants in an approved Career and
Technical Education Program in this school as well as across the State of New Jersey.
N/R - Data Not Reported
0.3% 19.2%
StateSchoolPercent of Students Enrolled
Participating in CTE
4.00
8. GRADUATION AND POSTSECONDARY
2013-14
8
501 ATLANTIC AVENUE
09-3780-050
OCEAN CITY, NJ 08226
CAPE MAY
OCEAN CITY
OCEAN CITY HIGH SCHOOL
State of New Jersey
GRADE SPAN 09-12
This section of the performance report presents data about graduation, dropout and post-secondary attendance. The
graduation rate is calculated according to the NCLB Cohort methodology as required by the United States Department of
Education. Dropout rates are calculated from student-level data submitted by districts for students officially classified as
dropouts. The dropout rate is the count of students who dropout in an academic year divided by the school's total enrollment.
The first column - Schoolwide Performance - represents the outcomes for these particular indicators in this school. The
second column - Peer School Percentile - indicates how the school’s performance compares to its group of peer schools. For
example, a school whose peer percentile is 65 in Graduation Rate has a higher Graduation Rate than 65% of its peer group. The
third column - Statewide Percentile - indicates how the school’s performance compares to schools across the state. The fourth
column - Statewide Target - provides the statewide targets for each of these indicators. The Statewide Target for Graduation
Rate was established pursuant to NJDOE’s NCLB Accountability Workbook. The last column - Met Target - indicates whether
the School Performance met or exceeded the statewide target.
The Summary row presents the averages of the peer school percentile, the average of statewide percentile and the
percentage of statewide targets met.
95% 78%
2%
6367
0.2%
100%
66
59
65
68
Graduation & Post Secondary
Indicators
Schoolwide
Performance
Peer
Percentile
Statewide
Targets
Met Target
SUMMARY - Graduation & Post-Secondary
Overall Graduation Rate
Dropout Rate
YES
YES
Statewide
Percentile
Schoolwide 95% 78%
96%
-
-
-
-
-
-
85%
-
94%
Graduation Rate by Subgroup
This table presents for all NCLB-identified subgroups the “4-
year Adjusted Graduation Rate.” This rate calculates the
percentage of students who are awarded a regular, high school
diploma within four years of becoming a first-time ninth grader.
The rate is adjusted to account for students who ‘transfer-in’ and
for students who are verified as ‘transfers-out'.
White
Black
Hispanic
American Indian
Asian
Native Hawaiian
Two or More Races
Students with Disability
Limited English Proficient Students
Economically Disadvantaged Students
School State Target
Schoolwide .2% 2%
0%
-
0%
-
-
-
-
0%
0%
-
Dropout Rate by Subgroup
This table presents for all NCLB-identified subgroups
the Dropout rate. This rate calculates the percentage of
students who are classified as dropouts divided by the school's
total enrollment and by each subgroup enrollment.
School State Target
White
Black
Hispanic
American Indian
Asian
Native Hawaiian
Two or More Races
Students with Disability
Economically Disadvantaged Students
Limited English Proficiency
9. GRADUATION AND POSTSECONDARY
2013-14
9
501 ATLANTIC AVENUE
09-3780-050
OCEAN CITY, NJ 08226
CAPE MAY
OCEAN CITY
OCEAN CITY HIGH SCHOOL
State of New Jersey
GRADE SPAN 09-12
EXEMPT
6.3
AHSA
3.9
HSPA
89.8
HSPA AHSA EXEMPT
Graduation Pathway Rates
This chart presents the percentage of high school
graduates who graduated by passing both sections of the
HSPA, who were exempt from passing the HSPA, or who
demonstrated proficiency through an alternative pathway
such as through the Alternative High School Assessment,
achievement of the ‘Just Proficient Mean’ or an appeal
process.
99% 97%
96%
95%
97%
Extended Year Graduation Rate
The chart below presents the 4-year and 5-year graduation
rate for the prior school year’s cohort in addition to the 4-year
graduation rate for last year’s cohort.
Class of 4-year Rate 5-year Rate
2012
2013
2014
This chart presents the enrollment rates of this school’s high school graduates, 16-months
after high school graduation. The data is from the National Student Clearinghouse which
reports that it collects student-level enrollment data from 95% of Institutions of Higher
Education nationwide.
The last columns indicate, for the schoolwide total and each subgroup, the percentage of
postsecondary enrollees that were enrolled in either a 2 year or a 4 year institution.
Schoolwide 44% 56%80%
81.4% 44.1% 55.9%
- - -
- - -
- - -
- - -
- - -
- - -
66.7% 70% 30%
- - -
60% 81.5% 18.5%
Postsecondary Enrollment Rates
Percent
Enrolled
Percent in
2 Year
Percent in
4 Year
White
Black
Hispanic
Asian
American Indian
Native Hawaiian
Two or More Races
Students with Disability
Limited English Proficient Students
Economically Disadvantaged Students
5.00
10. 6.00
WITHIN SCHOOL ACHIEVEMENT GAP
2013-14
10
501 ATLANTIC AVENUE
09-3780-050
OCEAN CITY, NJ 08226
CAPE MAY
OCEAN CITY
OCEAN CITY HIGH SCHOOL
State of New Jersey
GRADE SPAN 09-12
High School High School
This section of the performance report presents data about the achievement gap that exists within a school - as measured
by the difference between the students’ scale scores at the 25th and 75th percentile in the school, the so-called Interquartile
Range (IQR). Taken together with an understanding of the overall and average achievement levels in the school, the IQR furthers
an understanding of the range of student outcomes that exist in a school. A school gap smaller than the state gap indicates that
the school’s range of student outcomes is narrower than the state’s while a school gap larger than the state gap indicates that the
school’s range of student outcomes is larger than the state’s.
HSPA Language Arts 25th %ile vs 75th%ile HSPA Math 25th %ile vs 75th%ile
This table presents the scale scores associated with students
at the bottom (0th percentile), the 25th percentile, the 50th
percentile, the 75th percentile and the top (99th percentile)
of school's distribution.
This table presents the scale scores associated with students
at the bottom (0th percentile), the 25th percentile, the 50th
percentile, the 75th percentile and the top (99th percentile)
of school's distribution.
20 3826 45
136
230
241
250
265 271
253
235
215
150
287
250
240
224
100
300
253
232
208
132
Percentile
0th
25th
50th
75th
99th
Percentile
0th
25th
50th
75th
99th
25th vs 75th Gap
Scaled Score Gap
- State
State Scaled Score State Scaled Score
Scaled Score Gap
- School
Scaled Score Gap
- State
25th vs 75th Gap
Scaled Score Gap
- School
School Scaled Score School Scaled Score
11. 7.00
SCHOOL CLIMATE
2013-14
11
501 ATLANTIC AVENUE
09-3780-050
OCEAN CITY, NJ 08226
CAPE MAY
OCEAN CITY
OCEAN CITY HIGH SCHOOL
State of New Jersey
GRADE SPAN 09-12
This table presents the amount of time
that a typical student is engaged in
instructional activities under the
supervision of a certified teacher.
Length of School Day Instructional Time
Student Suspension Rate Student Expulsions
Student to Staff Ratio
This table presents the amount of time a
school is in session for a typical student on a
normal school day.
This table presents the percentage of students
who were suspended one or more times
during the school year.
This table presents the number of students
who were expelled from the school and
district during the school year.
This table presents the count of students per
faculty member or administrator in the school.
All staff are counted in full-time equivalents.
School
School
School
Faculty
Administrators
5.3%
11
244
0
5 Hrs. 50 Mins.
2 Hrs. 45 Mins.
6 Hrs. 45 Mins.2013-14
2013-14
2013-14
2013-14
2013-14
School
Full Time
Shared Time
School
12. 12
This table presents the list of peer schools in alphabetical order by county name that was created specifically for this school
(highlighted in yellow). Peer schools are drawn from across the state and represent schools that have similar grade configurations
and that are educating students of similar demographic characteristics, as measured by enrollment in Free/Reduced Lunch
Programs, Limited English Proficiency or Special Education Programs.
SCHOOL NAMEDISTRICT NAMECOUNTY NAME
FRPL LEP SpED
09-12BERGEN 10.3% 0.5% 12.0%
09-12BURLINGTON 13.6% 0.0% 15.2%
09-12BURLINGTON 12.6% 0.2% 13.6%
09-12BURLINGTON 10.7% 0.0% 13.4%
09-12CAMDEN 11.2% 0.3% 11.5%
07-12CAMDEN 13.6% 0.0% 11.6%
09-12CAPE MAY 17.7% 0.0% 11.6%
09-12GLOUCESTER 11.7% 0.1% 10.0%
09-12GLOUCESTER 15.5% 0.0% 15.3%
09-12GLOUCESTER 18.8% 0.0% 15.1%
07-12HUNTERDON 13.7% 0.0% 13.1%
09-12MIDDLESEX 11.4% 0.2% 11.8%
09-12MIDDLESEX 11.5% 0.4% 16.5%
09-12MIDDLESEX 11.0% 0.7% 11.7%
09-12MIDDLESEX 14.5% 0.3% 10.6%
09-12MONMOUTH 11.0% 0.0% 13.7%
09-12MONMOUTH 12.4% 0.2% 15.8%
09-12MONMOUTH 11.6% 0.5% 12.8%
09-12MONMOUTH 17.5% 0.1% 14.5%
09-12MONMOUTH 13.2% 0.3% 14.4%
09-12MORRIS 12.0% 0.4% 14.5%
09-12OCEAN 13.0% 0.0% 12.8%
09-12OCEAN 14.9% 0.2% 12.5%
09-12PASSAIC 11.2% 0.6% 12.2%
09-12PASSAIC 13.6% 0.2% 20.9%
09-12SUSSEX 12.5% 0.2% 14.7%
07-12SUSSEX 12.4% 0.0% 14.2%
09-12SUSSEX 11.9% 0.1% 14.6%
09-12SUSSEX 15.2% 0.2% 15.3%
09-12SUSSEX 18.3% 0.0% 17.8%
09-12WARREN 14.4% 0.0% 12.4%
09-3780-050OCEAN CITY HIGH SCHOOLSCHOOL PEER GROUP
GRAD
ESPAN
CDS
CODE
MAHWAH HIGH
CINNAMINSON HIGH SCHOOL
LENAPE HIGH SCHOOL
SENECA HIGH SCHOOL
CHERRY HILL HIGH SCHOOL EAST
HADDON HEIGHTS JR-SR HS
OCEAN CITY HIGH SCHOOL
CLEARVIEW REGIONAL HIGH
SCHOOL
PITMAN HIGH SCHOOL
WASHINGTON TOWNSHIP HIGH
SCHOOL
SOUTH HUNTERDON REGIONAL
HIGH SCHOOL
METUCHEN HIGH SCHOOL
MONROE TOWNSHIP HIGH SCHOOL
SOUTH BRUNSWICK HIGH SCHOOL
SPOTSWOOD HIGH SCHOOL
FREEHOLD TOWNSHIP HIGH
SCHOOL
RARITAN HIGH SCHOOL
MANASQUAN HIGH SCHOOL
MIDDLETOWN HIGH SCHOOL
NORTH
WALL HIGH SCHOOL
JEFFERSON TOWNSHIP HIGH
SCHOOL
JACKSON MEMORIAL HIGH
SCHOOL
NEW EGYPT HIGH SCHOOL
POMPTON LAKES HIGH SCHOOL
WEST MILFORD TOWNSHIP HIGH
SCHOOL
HIGH POINT REGIONAL HS
KITTATINNY REGIONAL SCHOOL
LENAPE VALLEY REGIONAL HIGH
SCHOOL
VERNON TOWNSHIP HIGH SCHOOL
WALLKILL VALLEY REGIONAL
HIGH SCHOOL
BELVIDERE HIGH SCHOOL
03-2900-050
05-0840-030
05-2610-050
05-2610-070
07-0800-030
07-1880-050
09-3780-050
15-0870-020
15-4140-050
15-5500-010
19-4890-050
23-3120-050
23-3290-005
23-4860-050
23-4970-040
25-1650-055
25-2105-050
25-2930-050
25-3160-050
25-5420-050
27-2380-020
29-2360-020
29-4190-010
31-4230-050
31-5650-040
37-2165-030
37-2465-050
37-2615-050
37-5360-020
37-5435-060
41-0280-020
MAHWAH TWP
CINNAMINSON TWP
LENAPE REGIONAL
LENAPE REGIONAL
CHERRY HILL TWP
HADDON HEIGHTS BORO
OCEAN CITY
CLEARVIEW REGIONAL
PITMAN BORO
WASHINGTON TWP
SOUTH HUNTERDON
REGIONAL
METUCHEN BORO
MONROE TWP
SOUTH BRUNSWICK TWP
SPOTSWOOD BORO
FREEHOLD REGIONAL
HAZLET TWP
MANASQUAN BORO
MIDDLETOWN TWP
WALL TWP
JEFFERSON TWP
JACKSON TWP
PLUMSTED TWP
POMPTON LAKES BORO
WEST MILFORD TWP
HIGH POINT REGIONAL
KITTATINNY REGIONAL
LENAPE VALLEY REGIONAL
VERNON TWP
WALLKILL VALLEY
REGIONAL
BELVIDERE TOWN