1. ::: Application Report
Advanced Mechanical Surface Testing
Nanoindentation and Nanoscratch of Oxide Coatings
on Thin Film Polymer Substrates
Introduction
The reliability of novel flexible opto-electronic devices depends
heavily on the resilience of a thin ceramic oxide layer deposited
on a polymer substrate. Currently, one of the most popular
combinations consists of a thin layer of Indium Tin Oxide (ITO)
on a polyester substrate, such as polyethylene terephthalate
(PET). The ITO layer, usually around a few hundred nanometers
in thickness, is very susceptible to cracking. As this layer
experiences cracking and delamination from the substrate,
the resistance of this layer sharply increases and it is rendered
useless.
Characterization of the mechanical properties of this oxide layer
after deposition is very important. The properties of ITO deposited
on glass have been previously investigated, but because the ITO
layer has an amorphous structure, the properties of the ITO can
be quite different than when deposited on glass. A large mismatch
in modulus between the ITO and the polymer substrate can also
affect adhesion to the substrate and the measured hardness
values. For this reason, indentation and scratch testing of the
ITO-coated PET system is very valuable, but straightforward
testing might not always be an option.
There are a number of challenges when performing both
indentation and scratch testing on a system consisting of a thin
hard coating on a soft polymeric substrate. Care must be taken
to ensure substrate effects do not influence the coating data.
Figure 1: Load depth curves for 3 coating thicknesses.
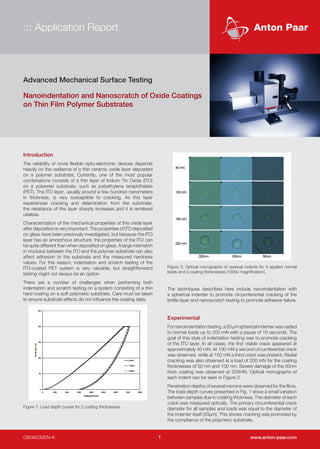
Figure 2: Optical micrographs of residual indents for 4 applied normal
loads and 3 coating thicknesses (1000x magnification).
The techniques described here include nanoindentation with
a spherical indenter to promote circumferential cracking of the
brittle layer and nanoscratch testing to promote adhesive failure.
Experimental
Fornanoindentationtesting,a20μmsphericalindenterwasoaded
to normal loads up to 200 mN with a pause of 10 seconds. The
goal of this style of indentation testing was to promote cracking
of the ITO layer. In all cases, the first visible crack appeared at
approximately 40 mN. At 100 mN a second circumferential crack
was observed, while at 150 mN a third crack was present. Radial
cracking was also observed at a load of 200 mN for the coating
thicknesses of 50 nm and 100 nm. Severe damage of the 50nm
thick coating was observed at 200mN. Optical micrographs of
each indent can be seen in Figure 2.
Penetration depths of several microns were observed for the films.
The load-depth curves presented in Fig. 1 show a small variation
between samples due to coating thickness. The diameter of each
crack was measured optically. The primary circumferential crack
diameter for all samples and loads was equal to the diameter of
the indenter itself (20μm). This shows cracking was promoted by
the compliance of the polymeric substrate.
G80IA030EN-A www.anton-paar.com1
2. 2 www.anton-paar.com
::: Application Report
G80IA030EN-A
Figure 3: Panoramic comparison of scratches on each sample, (500x
magnification). Applied load range was 0.08 - 5 mN.
As the indenter first makes contact and load is increased, a
primary crack is formed. Further loading elastically deforms
the substrate while causing cracking and delamination of the
ceramic coating. Future work will model this contact with the
goal of understanding this failure mechanism in more detail.
Nanoscratch testing was performed using a 5 μm radius
spherical diamond indenter. Samples were adhered to glass
slides for testing. Low-load scratching was performed using the
High Resolution cantilever of the Nano Scratch Tester (NST).
Critical loads were determined using optical methods and were
compared for several coating thicknesses.
Two primary failure mechanisms were observed for all samples.
The first mode of failure during testing was rupture of the ITO layer.
Further failure occurred in the form of spallation of the coating
and scarring of the PET substrate. A panoramic comparison of
a scratch performed on each sample is presented in Figure 3.
Scanning Force Microscopy (SFM) was performed at the critical
failure points of the sample with a coating thickness of 250 nm
and is presented in Figure 4.
Figure 4: Optical and 2-D and 3-D AFM micrographs of the LC1 (a) and
LC2 (b) for the sample with a coating thickness of 250nm.
The load at failure was also plotted against coating thickness and
is shown in Figure 4. This graph shows that the failure mechanism
of spallation of the coating has a greater dependence on coating
thickness than a failure characterized as rupturing. Scratch width
at the critical loads was also measured using optical methods
for each scratch and was plotted against film thickness. This
plot can be seen in Figure 5. Scratch widths at the critical loads
appear to be less dependent on film thickness than the critical
load values themselves.
Figure 5: Plot of the load at failure for each failure mechanism as a
function of film thickness.
Conclusions
When attempting to determine the mechanical properties
of a transparent oxide deposited on a thin polyester film, it is
necessary to adapt indentation and scratch testing methods.
Indentation testing utilizing a spherical indenter to promote
circumferential cracking and low-load scratch testing with a high-
resolution friction table were used to characterize and compare
the mechanical properties of the composite films. Results show
that these methods can accurately characterize differences in
film thickness. Further developments in these testing methods
will allow for a more flexible range of tests that can be conducted
on thin composite films. This will allow correlations to be made
between laboratory sample testing and the actual in-service
performance of devices which utilize ITO technology (e.g.,
touchscreens, flexible solar cells, flexible LED lighting, etc.)
Acknowledgements
Prof. Darran Cairns and Nick Morris of West Virginia University
are acknowledged for providing these interesting results.
References
1) K. Zeng, et al. Thin Solid Films 443 (2003) 60-65
2) B. R. Lawn, Journal of Materials Research, Vol 17, No. 12,
Dec 2002
3) H.Chai et al. Journal of Materials Research, Vol 19, No. 6, Jun
2004
3. 3 www.anton-paar.com
::: Application Report
G80IA030EN-A
Measurement of Acoustic Emission during
Microindentation
Most common microindentation measurements in both bulk
and thin film systems focus on the determination of hardness
and elastic modulus of the material. However, in many material
systems, discontinuities in the load-depth relationship can
often be observed, especially in materials where film failure,
delamination, dislocation movement or phase change may have
occurred. Characterization of certain physical phenomena using
acoustic emission can provide an accurate in-situ measurement
of both the magnitude and type of event.
Previous studies on the acoustic emission behaviour during
indentation of a variety of materials have shown that the
speed at which an event occurs can be correlated to the type
of event which led to the acoustic release of energy. Since
microindentation causes discrete, localized events, the ability to
identify each physical event and correlate them to the acoustic
behaviour allows a direct comparison between the event and the
individual acoustic emission signature.
Acoustic emission is the sudden release of elastic energy into
coustic waves that travel through the material. Traditionally,
such waves have been separated into two types of behaviour:
burst emission and continuous emission. A burst emission is a
discrete packet of waves associated with a single event, whereas
continuous emission tends to be an agglomeration of many
small interlinked events. The Anton Paar Microindentation Tester
(MHT) incorporates an acoustic emission sensor operating with
a frequency of 150 kHz over a dynamic range of 65 dB with
amplification up to 200,000x. Such a wide dynamic response
enables the sensor to resolve acoustic events in most engineering
materials when subjected to instrumented indentation over the
applied load range 0.01 - 30 N. The sensor is mounted directly
on the indenter housing to minimize losses and its signal is
acquired simultaneously with the load and depth signals to give a
complete picture of a compressive fracture event.
One of the distinct advantages of acquiring the acoustic signal
during microindentation is that it provides an indication of when
the acoustic event actually occurs during the experiment.
Fig. 1 shows a range of examples of acoustic signatures for
microindentations made on a Si wafer with a Vickers indenter.
In each case, brittle fracture (cracking) has occurred during the
loading portion only. This is an interesting observation because
cracking can sometimes also occur during the unloading phase
in some materials. In these eight examples, the maximum load
(15 N) has been maintained in each case, but the loading rate has
been varied over the range 1 - 250 N/min. in order to investigate
the influence of loading rate on the severity of cracking.
It can clearly be seen that the fastest loading rate results in the
severest cracking, observed both from the level of the acoustic
signal and subsequent optical microscopy of the residual
indentation. An example of a progressive load multicycle on a
Si wafer is shown in Fig. 2. This confirms that cracking occurs
only during the loading portion even though the material is being
progressively fatigued by increasing the applied load through five
steps. Fracture in brittle materials is usually more significant when
the load is progressively applied than if a single load-unload cycle
(to the same maximum load) was applied.
Figure 1: Typical acoustic emission signatures for microindentations
made on a Si wafer with applied load of 15 N. Loading rates of 1, 10, 20,
40, 100, 150, 200 and 250 N/min. are shown.
4. 4 www.anton-paar.com
::: Application Report
G80IA030EN-A
This is because more energy is being channelled into the material
in the former case. In some cases, the subsequent acoustic
bursts can be stronger than the original burst, and the time
between bursts is much greater than the time in which a sound
wave can travel across the sample. This leads to the conclusion
that the multiple events observed are not merely reflections of
the acoustic waves, but are individual events. It should also be
remembered that only a fraction of the acoustic energy is picked
up by the detector, and only a fraction of the released elastic
energy is converted to acoustic energy. Even though the signal
is limited by the bandwidth of the sensor used, the ability to arrive
at a semiquantitative measurement of event strength makes it an
appealing method of analysis.
Figure 3: Shows the acoustic signature for a microindentation
on a Titanium Nitride thin film of thickness 3 μm. Again, the
main acoustic events are observed during the loading phase
and corresponding cracking is observed around the residual
imprint. In the case of a coating, the acoustic signal may give
an indication of the bond strength between the coating and the
substrate: if the coating is poorly bonded, then little energy may
be released during delamination.
Since the elastic energy released during coating delamination
can be quantitatively measured (from the load-depth curve) it
could be possible to calibrate the energy output of a given sensor
to the elastic energy released.
Figure 2: Progressive load multicycle (5 cycles over range 1 - 10 N) with a
Vickers indenter on a Si wafer. Acoustic signal confirms cracking during
the loading portion of each cycle.
Figure 3: Acoustic signature for a microindentation with applied load
of 10 N on a Titanium Nitride (TiN) coating (thickness 3 μm) on a steel
substrate.
Inanycase,acousticemissionmeasurementshowsgreatpromise
for revealing the relationship between physical phenomena and
the corresponding acoustic emission signal. Such measurement
capability will be able to shed some light on the magnitude of a
brittle failure event as well as the precise moment when it was
initiated.
References
1) D. F. Bahr and W. W. Gerberich, J. Mater. Res., Vol. 13, No.4
(1998) 1065-1074
2) D. F. Bahr, J. W. Hoehn, N. R. Moody and W. W. Gerberich,
Acta Mater., Vol. 45, No.12 (1997) 5163-5175
Author
Dr. Nicholas X. Randall, Anton Paar
Contact Anton Paar
Tel: +41 32 552 1600
Fax: +41 32 552 1610
info.tritec@anton-paar.com
www.anton-paar.com