Data-driven enterprise off your beat - Sarah Cohen - Phoenix NewsTrain - April 7. 2018
•
1 gefällt mir•59 views

This handout on data-driven enterprise reporting was prepared by Steve Doig, professor of journalism, specializing in data reporting, at the Walter Cronkite School of Journalism and Mass Communication at Arizona State University. It was distributed by Sarah Cohen, Knight Chair specializing in data journalism at Cronkite, at Phoenix NewsTrain on April 6-7, 2018. It includes why study data journalism; how to get started; how to find data, including selected data sets to get started; how to avoid errors; and where to get more training. It accompanies Cohen's presentation, "Data-driven enterprise." NewsTrain is a training initiative of Associated Press Media Editors (APME). More info; http://bit.ly/NewsTrain

Empfohlen
Empfohlen
Weitere ähnliche Inhalte
Was ist angesagt?
Was ist angesagt? (20)
Ähnlich wie Data-driven enterprise off your beat - Sarah Cohen - Phoenix NewsTrain - April 7. 2018
Ähnlich wie Data-driven enterprise off your beat - Sarah Cohen - Phoenix NewsTrain - April 7. 2018 (20)
Mehr von News Leaders Association's NewsTrain
Mehr von News Leaders Association's NewsTrain (20)
Kürzlich hochgeladen
Kürzlich hochgeladen (20)
Data-driven enterprise off your beat - Sarah Cohen - Phoenix NewsTrain - April 7. 2018
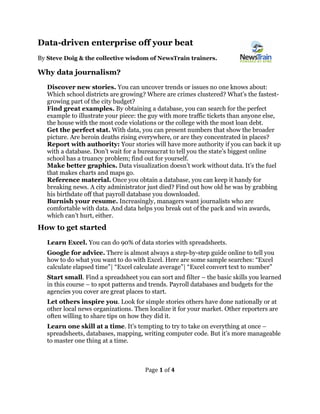
- 1. Page 1 of 4 Data-driven enterprise off your beat By Steve Doig & the collective wisdom of NewsTrain trainers. Why data journalism? Discover new stories. You can uncover trends or issues no one knows about: Which school districts are growing? Where are crimes clustered? What’s the fastest- growing part of the city budget? Find great examples. By obtaining a database, you can search for the perfect example to illustrate your piece: the guy with more traffic tickets than anyone else, the house with the most code violations or the college with the most loan debt. Get the perfect stat. With data, you can present numbers that show the broader picture. Are heroin deaths rising everywhere, or are they concentrated in places? Report with authority: Your stories will have more authority if you can back it up with a database. Don’t wait for a bureaucrat to tell you the state’s biggest online school has a truancy problem; find out for yourself. Make better graphics. Data visualization doesn’t work without data. It’s the fuel that makes charts and maps go. Reference material. Once you obtain a database, you can keep it handy for breaking news. A city administrator just died? Find out how old he was by grabbing his birthdate off that payroll database you downloaded. Burnish your resume. Increasingly, managers want journalists who are comfortable with data. And data helps you break out of the pack and win awards, which can’t hurt, either. How to get started Learn Excel. You can do 90% of data stories with spreadsheets. Google for advice. There is almost always a step-by-step guide online to tell you how to do what you want to do with Excel. Here are some sample searches: “Excel calculate elapsed time”| “Excel calculate average”| “Excel convert text to number” Start small. Find a spreadsheet you can sort and filter – the basic skills you learned in this course – to spot patterns and trends. Payroll databases and budgets for the agencies you cover are great places to start. Let others inspire you. Look for simple stories others have done nationally or at other local news organizations. Then localize it for your market. Other reporters are often willing to share tips on how they did it. Learn one skill at a time. It’s tempting to try to take on everything at once – spreadsheets, databases, mapping, writing computer code. But it’s more manageable to master one thing at a time.
- 2. Page 2 of 4 Use it or lose it. Find ways to use Excel or another data tool. Use it for a Rolodex. Make a list of your records requests. Enter court cases or legislation or anything else you need to keep track of. Find someone who can help. Find someone in the newsroom who uses data. Join NICAR-L, an email list of journalists interested in data. If you get stuck, someone on NICAR-L can probably help you within hours. bit.ly/subscribeNICAR-L Finding data Ask. Finance directors, auditors, human-resource managers and many others on your beat know where the data is, and some of them will share it willingly. Others will treat you like you just asked to date their sister. But ask anyway. Use Google. You can easily find interesting data by searching websites for agencies you cover or doing a broader search of the web. Go to google.com/advanced_search where you can search by file type: XLS = old Excel; XLSX = new Excel; CSV = comma-separated value, which Excel can open (this is increasingly common); TSV = tab-separated value (same idea). You can also limit searches to .gov or .edu sites or the domain of an agency you cover. Use a government data portal. Some states have gathered their data in one place, such as Washington’s data.wa.gov. There is a good federal site, data.gov, where you can search for data sets on almost any topic. Check IRE tip sheets. IRE members have access to a library of hundreds of tip sheets, many of which include suggestions on data. Use the NICAR data library. IRE members can download copies of dozens of federal databases at modest cost from ire.org/nicar/database-library/. NICAR will even extract a state slice for you. Examine the records-retention schedule for government agencies you cover. The schedules list every record the agency is required to keep and for how long. Sometimes, they forget to throw out the old stuff, though. Read annual reports. See a stat? See a table? That means the agency probably has a database that generated it. Ask for the data. Look at forms. Most agencies enter every box of a form into a database. That means you can probably obtain the database with a records request. FOIA/Public Disclosure Act. Don’t be afraid to file a public-records request for data you can’t get another way. Use Washington’s Public Disclosure Act, Ch. 42.56, for state and local requests (atg.wa.gov/obtaining-records) and the Freedom of Information Act (FOIA) for federal requests: foia.gov. Build your own. Sometimes, you just can’t find the data you need. Or it’s only in paper form. In that case, it might be worth the effort to enter the data into a spreadsheet so you can analyze it.
- 3. Page 3 of 4 Here are data to get you started Education: Washington’s Office of the Superintendent of Public Instruction has data on performance, finances, enrollment, teachers and many other things you might want to know about the schools and districts you cover: k12.wa.us/DataAdmin/PerformanceIndicators/DataAnalytics.aspx Property and property taxes: County assessors and treasurers in all 39 Washington counties (dor.wa.gov/Content/FindTaxesAndRates/PropertyTax/Links.aspx) keep property value and taxation data on every parcel in their county, including tax rates, tax breaks and the condition and value of the property. If not downloadable online, their data should be available in a spreadsheet on request. Census: The U.S. Census Bureau’s American Factfinder site gives access to demographic information about places throughout the U.S. It includes income, racial, education, age and more from the national level to a city block: factfinder.census.gov Campaign finance: The Washington Public Disclosure Commission keeps a database of campaign-finance reports for state and local elections: pdc.wa.gov Federal campaign-finance data is similarly easy to access at the Federal Elections Commission: classic.fec.gov/finance/disclosure/disclosure_data_search.shtml Purchasing data: Once you’ve got a good campaign-finance database, grab your city or county or school district purchasing database and search it to see if contracts are going to donors. Crime and courts: Fire and police run databases can provide lots of information on what the agencies are doing and how fast they do it. Court case records can show trends in charging, sentencing and plea bargains. Washington Courts keeps data on all cases in state and county courts: dw.courts.wa.gov. Payroll: Get the payroll database for your agency at least annually. Not only can you do the standard “who makes the most” story, but you can, depending on what’s in there, quickly look up a salary when some bureaucrat gets arrested or fired, confirm an age and/or check for nepotism. Budgets: As with payroll, get it at budget time and keep it for use all year and beyond. Having several years of budgets easily accessible for comparison is a great way to track the priorities of the agency you cover. For databases on other beats: bit.ly/otherbeats
- 4. Page 4 of 4 Don’t run with scissors! Data is a powerful tool, but proceed carefully if you are unfamiliar with the data or the skills you need to analyze it. Watch out for dirty data. Typos. Mistakes. Missing data. If something in the data seems crazy, it just might be an error. So, verify it with the original documents or with sources. Double-check your calculations. It’s almost always a good idea to run them by the agency or another trusted source before publication. Or ask a colleague to check your math. Data is the beginning, not the end. Data provides great examples and powerful numbers. But you still have to do reporting to make sure the data is reliable and confirm what it means. Don’t overload stories with numbers. A temptation with data stories is to jam in every cool stat you find. But your stories will be stronger if you use only the numbers that matter most and instead tell the stories through people, anecdotes, quotes and traditional storytelling. Beware of working with new data on deadline. Every database has quirks. Sometimes codes don’t mean what you think they mean. Sometimes databases are incomplete. Try to avoid working with databases for the first time on deadline. Where can you learn more ¡ IRE/NICAR conferences/workshops/tip sheets. IRE costs $70 ($25 for students) a year: bit.ly/joinire. Membership gives you access to thousands of tip sheets and stories. Plus, you can listen to recordings of past conferences. IRE is holding two major conferences in 2018 – The NICAR data one in Chicago in March, and a second in Orlando in June. It offers fellowships to the conferences and to its workshops. ire.org/events-and-training/ ¡ Join the NICAR-L email list, where hundreds of experienced and novice data journalists read posts and answer questions: bit.ly/subscribeNICAR-L ¡ Whether you cover education or anything else, this online guide to Excel from the Education Writers Association will teach you everything you need to know: ewa.org/reporter-guide/reporters-guide-excel ¡ The Data Journalism Handbook from the European Journalism Centre and Open Knowledge Foundation is free to read online: bit.ly/datajbook ¡ Knight Science Journalism at MIT has a fantastic resource for data work that covers basics to programming. Check it out: ksj.mit.edu/data-journalism-tools ¡ And again, remember: Someone has tried to do the exact thing you want to do with Excel. Just get yourself in the ballpark with a good Google search and/or a good NICAR-L question, and you’ll find step-by-step instructions. (Credits: Thanks to Doug Caruso and Todd Wallack, fellow NewsTrain trainers, for a lot of the wording and ideas in this handout.)