1. Reducing false positive incidental findings with ensemble
genotyping and logistic regression-based variant filtering
methods
Kyu-Baek Hwang1,2,†, In-Hee Lee1,†, Jin-Ho Park1,3,†, Tina Hambuch4, Yongjoon Choi1,
MinHyeok Kim5, Kyungjoon Lee6, Taemin Song2, Matthew B. Neu1, Neha Gupta1, Isaac S.
Kohane1,6, Robert C. Green7, and Sek Won Kong1,*
1Children's Hospital Informatics Program at the Harvard-MIT Division of Health Sciences and
Technology, Boston Children's Hospital, Boston, MA 02115, USA
2School of Computer Science and Engineering, Soongsil University, Seoul 156-743, South Korea
3Department of Family Medicine, Seoul National University Hospital, Seoul 110-744, South Korea
4Illumina, Inc, San Diego, CA 92122, USA
5Department of Computer Science and Engineering, Seoul National University, Seoul 150-742,
South Korea
6Center for Biomedical Informatics, Harvard Medical School, Boston, MA 02115, USA
7Division of Genetics, Department of Medicine, Brigham and Women's Hospital, Boston, MA
02115, USA
Abstract
As whole genome sequencing (WGS) uncovers variants associated with rare and common
diseases, an immediate challenge is to minimize false positive findings due to sequencing and
variant calling errors. False positives can be reduced by combining results from orthogonal
sequencing methods, but costly. Here we present variant filtering approaches using logistic
regression (LR) and ensemble genotyping to minimize false positives without sacrificing
sensitivity. We evaluated the methods using paired WGS datasets of an extended family prepared
using two sequencing platforms and a validated set of variants in NA12878. Using LR or
ensemble genotyping based filtering, false negative rates were significantly reduced by 1.1- to
17.8-fold at the same levels of false discovery rates (5.4% for heterozygous and 4.5% for
homozygous SNVs; 30.0% for heterozygous and 18.7% for homozygous insertions; 25.2% for
heterozygous and 16.6% for homozygous deletions) compared to the filtering based on genotype
quality scores. Moreover, ensemble genotyping excluded > 98% (105,080 of 107,167) of false
positives while retaining > 95% (897 of 937) of true positives in de novo mutation (DNM)
discovery, and performed better than a consensus method using two sequencing platforms. Our
*
Correspondence should be addressed. Tel: +1 617 919 2689; Fax: +1 617 730 0817; sekwon.kong@childrens.harvard.edu.
†These authors are regarded as joint first authors.
Conflict of Interest The authors declare no conflict of interest.
NIH Public Access
Author Manuscript
Hum Mutat. Author manuscript; available in PMC 2015 August 01.
Published in final edited form as:
Hum Mutat. 2014 August ; 35(8): 936–944. doi:10.1002/humu.22587.
NIH-PAAuthorManuscriptNIH-PAAuthorManuscriptNIH-PAAuthorManuscript
2. proposed methods were effective in prioritizing phenotype-associated variants, and ensemble
genotyping would be essential to minimize false positive DNM candidates.
Keywords
whole-genome sequencing; ensemble genotyping; logistic regression; false positive; incidental
finding; de novo mutation discovery
Introduction
Whole genome and exome sequencings (WGS and WES) are effective in identifying
disease-associated variants for both rare and common diseases (Boycott, et al., 2013; Cirulli
and Goldstein, 2010; Lohmueller, et al., 2013) and are being deployed in clinical practice
(Ley, et al., 2010; Pleasance, et al., 2010; Rehm, 2013; Worthey, et al., 2011; Yang, et al.,
2013). Discovering disease-associated variants such as known Mendelian disease-causing
and loss of function (LoF) variants or de novo mutations (DNMs) using next-generation
sequencing (NGS) requires accuracy and precision in identifying genomic variants as well
as sufficient coverage for the sequenceable human genome (Gargis, et al., 2012); however,
many sources of false positives and false negatives have been identified. The comparison of
sequencing platforms and library preparation methods showed significant bias (Fuentes
Fajardo, et al., 2012; Lam, et al., 2012; Ross, et al., 2013), and alignment and variant calling
procedures result in false positives and false negatives as well (Bao, et al., 2011; O'Rawe, et
al., 2013; Pabinger, et al., 2013; Yu, et al., 2012). The differences due to sequencing
platforms, alignment methods, and variant calling procedures are more significant for
INDELs compared to SNVs (Lam, et al., 2012; O'Rawe, et al., 2013; Zook, et al., 2014).
Moreover, erroneous annotations, incorrect penetrance estimates, and multiple hypothesis
testing could result in additional incidental findings (Kohane, et al., 2012).
The current consensus is to validate a few selected variants using an orthogonal method such
as Sanger sequencing or to use two or more sequencing platforms when a high level of
specificity is required (1000 Genomes Project Consortium, 2010; Lam, et al., 2012; Ratan,
et al., 2013; Reumers, et al., 2012). The latter approach has been effective for DNM
discovery (Conrad, et al., 2011), but using multiple platforms to sequence a family is not
practical due, in part, to the cost (> $5,000 per genome as of October 2013) (Wetterstrand,
2013). O'Rawe and colleagues compared 5 different alignment and variant calling pipelines
using an Illumina WES dataset, and found low concordance rates for both SNVs (57.4%)
and INDELs (26.8%). As pipeline-specific variants also present true positives, they
suggested to use multiple pipelines to minimize false negatives at the cost of increasing false
positives (O'Rawe, et al., 2013). Various measures such as genotype quality score (GQ),
read depth, and strand bias help to prioritize the variants from a single platform (DePristo, et
al., 2011; Reumers, et al., 2012). To reduce false positives in DNM discovery using a single
platform, joint variant calling of family members (Conrad, et al., 2011; Iossifov, et al., 2012;
Neale, et al., 2012) and machine learning techniques such as random forest-based filtering
using genomic context (Jiang, et al., 2013; Michaelson, et al., 2012) were developed;
however, it is not clear whether one specific tool or approach is more effective or efficient.
Hwang et al. Page 2
Hum Mutat. Author manuscript; available in PMC 2015 August 01.
NIH-PAAuthorManuscriptNIH-PAAuthorManuscriptNIH-PAAuthorManuscript
3. Thus, challenges still remain, including determining the optimal cut-off value in variant
filtering, estimating the impact of variant filtering on false negatives and downstream
functional analysis, and choosing the best way to reduce the large number of false positive
DNMs.
To reduce false positive genomic variants in WGS/WES, we developed two variant
prioritization techniques: a logistic regression (LR) based filtering method that can be
applied to variant call files and an ensemble genotyping approach that requires aligned
short-reads files. The LR filter calculates the probability of a variant being true positive by
fitting models with various variant quality measures. The ensemble genotyping aims to
reduce the false positives due to erroneous variant calling by integrating multiple variant
calling algorithms (VCAs). Both methods were developed to reduce false positives while
minimizing the increase in the number of false negatives. To test the performance of
proposed approaches, we used a WGS dataset prepared with lymphoblastic cell lines from
17 members of CEPH/Utah Pedigree 1463. Each sample was sequenced using two most
widely used NGS based WGS platforms: Illumina and Complete Genomics (CG). The effect
of false positive filtering on false negatives was investigated using gold standard variant
calls from the Genome in a Bottle Consortium (Zook, et al., 2014). We then evaluated the
downstream consequences of variant filtering on discovering disease-associated variants for
the ensemble genotyping approach. Finally, we demonstrated the performance of the
proposed methods and other approaches using validated DNMs from a trio (Conrad, et al.,
2011). Based on the comprehensive evaluation of the proposed and other filtering
approaches in diverse aspects, we provide insights into variant filtering for WGS and WES.
Materials and Methods
Whole-genome sequencing data of an extended family and annotation
We used two WGS datasets prepared using the CG Standard Sequencing Service (Mountain
View, CA) (Drmanac, et al., 2010) and the Illumina Clinical Service Laboratory (San Diego,
CA). Each dataset consisted of 17 WGS from an extended family (Coriell ID: NA12877–
NA12893 from CEPH/Utah Pedigree 1463 of the Coriell Institute, Camden, NJ), therefore
we were able to compare CG and Illumina WGS results for each of the 17 individuals and
across the family members. The CG dataset that was prepared using the CGA Tools (version
2.0.0.26) was downloaded from the company's public ftp repository (ftp://
ftp2.completegenomics.com). The Illumina dataset was generated using a HiSeq 2000
system with > 40x on average, and genotyped using the Illumina CASAVA pipeline
(version 1.9.0) (Ajay, et al., 2011). Both datasets were prepared with the UCSC hg19
reference human genome.
We focused on autosomal variants because zygosity calling strategies in sex chromosomes
and reference mitochondrial genomes differed for the two platforms. CG called all variants
in chromosome Y (except pseudo-autosomal regions) as homozygous while Illumina called
the variants in the same region as homozygous or heterozygous. For the mitochondrial
genome sequence, CG used the Cambridge Reference Sequence (Public Genome Data
Repository Service Note, ftp://ftp2.completegenomics.com/
Hwang et al. Page 3
Hum Mutat. Author manuscript; available in PMC 2015 August 01.
NIH-PAAuthorManuscriptNIH-PAAuthorManuscriptNIH-PAAuthorManuscript
4. Public_Genomes_Dataset_Service_Note.pdf), whereas Illumina used the mitochondrial
sequence included in UCSC hg19.
We converted the variant call files from CG and Illumina platforms to Genome Variation
Format (GVF) files (Reese, et al., 2010) and then annotated variants using the dbSNP
database (Build ID: 131) (Sherry, et al., 2001), RepeatMasker (Smit, et al., 1996–2010),
RefSeq Genes, and the Human Gene Mutation Database (variants marked as `Disease
causing Mutations (DM)' in HGMD Professional version 2013.2) (Stenson, et al., 2009).
Possible functional impacts of variants were analyzed using snpEff version 3.2 (Cingolani,
et al., 2012) according to the Ensembl transcript model version 37.70. We classified
nonsense, splice-site disrupting, and frameshift variants as LoF.
Logistic regression based variant filtering
We developed a LR-based filtering method for variant call files without the need for
reprocessing raw short reads. The probability of a variant being true positive was modeled
using LR with genomic context and GQ. Separate LR models were trained for different
variant types (i.e., SNVs, insertions, and deletions), zygosity, and platform. For SNVs, we
fitted a model using 6 factors: 1) GQ reported by each platform (CG or Illumina), 2)
reported in dbSNP database (Build ID: 131) (Sherry, et al., 2001), 3) overlap with the
RepeatMasker (Smit, et al., 1996–2010) 4) present in the other family members (parents and
children), 5) genic vs. intergenic elements by RefSeq, and 6) substitution type. We used GQ
as a continuous variable, and the others were categorical variables. For INDELs, we
excluded the substitution type and added the INDEL lengths in bps as a continuous variable.
A LR model was trained using the annotated variant call files from the CEPH/Utah pedigree.
We labeled variants that were concordantly called by both CG and Illumina as true positive
since these variants had a higher validation rate of > 90% compared to platform-specific
ones (61.9% for CG-specific and 64.3% for Illumina-specific SNVs) (Lam, et al., 2012).
Alternatively, one can use a different set of gold standard variants such as those from the
Genome in a Bottle Consortium to train LR models. We filtered variants based on their
probability of being true positive predicted by trained LR models. All statistical analysis was
performed using glm function with binomial family and logit link in the R statistical
language and the model performances were evaluated using leave-one-out cross validations.
The variant call file of a single individual was used to evaluate the LR model that was
trained using the variant call files from the other 16 individuals as illustrated in Supp. Figure
S1. The software package for training and application of LR filters is available for download
at http://ml.ssu.ac.kr/LRFilter.
Ensemble approach using multiple variant calling methods
Several alignment and VCAs have been developed for the Illumina sequencing data;
however, CG raw sequence reads can only be processed with the proprietary alignment and
VCA. We used 6 independently developed VCAs for Illumina dataset. Binary sequence
alignment/map (BAM) files were sorted, marked for duplicated reads, locally realigned, and
recalibrated for base quality using the Picard tools (version 1.84), SAMtools (version
0.1.18), and Genome Analysis Tool Kit (GATK, version 2.3–4) as described in Supp.
Hwang et al. Page 4
Hum Mutat. Author manuscript; available in PMC 2015 August 01.
NIH-PAAuthorManuscriptNIH-PAAuthorManuscriptNIH-PAAuthorManuscript
5. Methods. The processed BAM files were processed using the GATK UnifiedGenotyper
(McKenna, et al., 2010), SAMtools (Li, et al., 2009), glfSingle (last accessed: March 15,
2013) (1000 Genomes Project Consortium, 2010), FreeBayes (version 0.9.9) (Garrison and
Marth, 2012), Atlas2 (version 1.4.3) (Challis, et al., 2012), and VarScan2 (version 2.3.5)
(Koboldt, et al., 2009). The parameters for each VCA are described in Supp. Methods, and
the whole analysis script is available per request. We combined the results from 6 VCAs by
simply counting concordant calls matched for both genotype and zygosity. Then, we filtered
the variants identified by the Illumina CASAVA pipeline using the number of concordant
calls from 6 VCAs. For SNVs, the number of concordant calls can vary from 0 (called only
by Illumina CASAVA pipeline) to 6 (consistently called by CASAVA and 6 VCAs). For
INDELs, we used 5 tools because glfSingle did not call INDELs. The variant filtering by n
or more concordant calls from multiple VCAs was depicted as nVCA+.
Lastly, we combined LR filters with multiple VCAs for Illumina dataset. GQs reported by
each VCA were used as an additional independent variable for LR in addition to the six
independent variables of the LR filter described above. We excluded VarScan2 since it did
not report valid GQs for all variants. Thus, 5 additional independent variables for SNVs and
4 additional independent variables for INDELs were included in the LR models combined
with multiple VCAs (LR_nVCA).
Discovering de novo mutations
We set up a mother and her parents, a father and his parents, and each of 11 children with
their parents as 13 trios, and performed DNM analysis. For each trio, Mendelian inheritance
errors (MIEs) were identified by comparing the parents' and offspring's variant call files
using gSearch (Song, et al., 2012). Briefly, a heterozygous variant of an offspring was
designated as an MIE if none of its parents' genomes contained the same variant.
We filtered MIEs – DNM candidates – obtained using a single sequencing platform by LR.
Separate LR models for CG (LR_CG) and Illumina (LR_ILL) platforms were constructed.
We used six quality measures for DNM candidates as independent variables of LR for DNM
candidate filtering: 1) GQ, 2) reported in dbSNP (Build ID: 131) (Sherry, et al., 2001), 3)
overlap with RepeatMasker (Smit, et al., 1996–2010), 4) present as the same variant in
offspring's children, 5) genic vs. intergenic elements by RefSeq, and 6) SNV type or INDEL
length. For training LR models, DNM candidates concordantly called by CG and Illumina
(2CON) were labeled as true positive, and the others as false positive. Thus, a LR model for
DNM candidate filtering was trained to calculate the probability of a DNM candidate
discovered by a single sequencing platform being platform-concordant.
We applied nVCA+ to DNM discovery by comparing DNM candidates between VCAs. The
number of VCAs (1 to 6) that identified the same DNM candidate was assigned to each
candidate and used for prioritization. Further, nVCA+ for DNM discovery was combined
with the Illumina CASAVA pipeline (ILL & nVCA+) and consensus calls between CG and
Illumina (2CON & nVCA+) respectively. We also compared PolyMutt – a pedigree aware
genotyping and DNM discovery method (Li, et al., 2012) – with proposed DNM
identification methods.
Hwang et al. Page 5
Hum Mutat. Author manuscript; available in PMC 2015 August 01.
NIH-PAAuthorManuscriptNIH-PAAuthorManuscriptNIH-PAAuthorManuscript
6. Performance comparison of filtering approaches
As true positive variants, we used the variants concordantly called by CG and Illumina as
well as the NIST-GIAB high-confidence benchmark calls for NA12878 (GIAB12878) that
were compiled by the Genome in a Bottle Consortium (Zook, et al., 2014). The benchmark
set was generated by integrating 14 datasets obtained using 5 different sequencing platforms,
and covered > 80% of the human reference genome (hg19). To assess the performance of a
variant filter, we used false discovery rate (FDR = FP / (TP + FP)) and false negative rate
(FNR = FN / (TP + FN)), and the Matthew's Correlation Coefficient (MCC). We first
compared FNRs of different filters at the same or similar FDR levels. Then, the optimized
performance of each filter was assessed using MCC, which is calculated as
and represents the correlation between
benchmark and filtering results. MCC ranges from −1 (total disagreement) to 0 (random) to
1 (perfect correlation).
For DNM, we used a validated set of 49 germline and 952 non-germline DNMs in NA12878
obtained from the study by Conrad and colleagues (Conrad, et al., 2011) as gold standards
after lifting-over to hg19 loci. We used positive predictive value (PPV = TP / (TP + FP)),
sensitivity (= TP / (TP + FN)), and F1 score – harmonic mean of PPV and sensitivity,
ranging from 0 to 1 – to assess the performance of each DNM identification method. PPV of
a DNM identification method denotes the proportion of true DNMs out of all DNMs
identified by that method. Sensitivity of a DNM identification method means the proportion
of true DNMs identified by that method out of all true DNMs.
Results
Comparison of two whole genome sequencing platforms
The fraction of the hg19 reference genome covered by ≥ 10 reads exceeded 95% in both
platforms. Table 1 and Supp. Table S1 summarize the WGS results on CEPH/Utah Pedigree
1463 obtained using CG and Illumina platforms. The mean concordance rates between the
two platforms were significantly lower for heterozygous variants than homozygous variants:
78.9% vs. 87.3% for SNVs; 42.4% vs. 56.0% for insertions; 45.0% vs. 58.0% for deletions
(P < 1.4 × 10⁻¹⁸; paired t-test) (Supp. Figure S2).
To compare the qualities of platform-concordant and platform-specific variants, we
compared Ti/Tv ratio, proportion of known variants, and overlap with repetitive DNA
elements (Supp. Table S2). The Ti/Tv ratios of CG-specific (1.72) and Illumina-specific
SNVs (1.47) were slightly lower than the generally observed value of ~2 (DePristo, et al.,
2011) and that of platform-concordant variants (2.15). The proportion of known SNVs and
INDELs in dbSNP (Build ID: 131) was significantly higher in platform-concordant variants
(84% for SNVs and > 47% for INDELs) than platform-specific ones (< 67% for SNVs and <
29% for INDELs). The overlap of platform-concordant variants with repetitive DNA
elements – 51.5% for SNVs, 51.6% for insertions, and 56.4% for deletions – was not
different from the genome-wide average (51.3% in hg19). However, significantly higher
proportions (> 61%) of platform-specific variants were found in the RepeatMasker regions.
Hwang et al. Page 6
Hum Mutat. Author manuscript; available in PMC 2015 August 01.
NIH-PAAuthorManuscriptNIH-PAAuthorManuscriptNIH-PAAuthorManuscript
7. In both platforms, the GQs of platform-concordant SNVs were significantly higher
compared to those of platform-specific SNVs (Supp. Figures S3(A) and S3(B) and Supp.
Tables S3 and S4). We observed the same trend for INDELs; however the difference
between platform-concordant and platform-specific ones was not as significant as that of
SNVs (Supp. Figures S3(C)–S3(F)). Overall, the platform-concordant variants had higher
quality than platform-specific variants as indicated by a Ti/Tv ratio closer to the generally
observed value, a higher proportion of known variants in dbSNP, less overlap with repetitive
DNA elements, and higher GQs.
Reducing false positives with a single whole-genome sequencing platform
The performance of false positive filtering methods on the CEPH/Utah pedigree was
evaluated using the platform-concordant variants. The evaluation results on the Illumina
dataset are summarized in Table 2. We compared each method by FNR at the same or
similar FDR levels: 5.4% for heterozygous SNVs and 4.5% for homozygous SNVs; 30.0%
for heterozygous insertions and 18.7% for homozygous insertions; 25.2% for heterozygous
deletions and 16.6% for homozygous deletions. Overall, nVCA+ and LR_nVCA performed
better than LR and GQ based filtering for all variant types and zygosities, suggesting that the
use of multiple VCAs could be effective for removing false positives while minimizing the
increase in the number of false negatives. Interestingly, the performances of nVCA+ and
LR_nVCA were different according to zygosity. nVCA+ performed better than LR_nVCA
for homozygous variants, and we observed the opposite for heterozygous ones. LR_nVCA
reduced FNR by 6.0- to 10.0-fold compared to GQ for heterozygous variants. For
homozygous variants, nVCA+ showed 2.7- to 17.8-fold lower FNRs than GQ. When
multiple VCAs were not applied, LR performed better than GQ for all variant types and
zygosities on the Illumina dataset (1.1- to 2.5-fold decrease in FNR) as well as on the CG
dataset (1.1- to 2.4-fold decrease in FNR; see Supp. Table S5).
Since FDR and FNR changed with varying cut-off thresholds for filtering, we also compared
the optimized performance of each filtering method using MCC (see Materials and
Methods). For the Illumina dataset, LR_nVCA was the best for all heterozygous variants
and homozygous deletions, followed by nVCA+, LR, and GQ (Table 2). For homozygous
SNVs and insertions, nVCA+ showed slightly higher or similar MCCs compared to
LR_nVCA (0.661 vs. 0.657 for SNVs; 0.591 vs. 0.591 for insertions), followed by LR and
GQ. For the CG dataset, MCCs of LR were always higher than those of GQ (Supp. Table
S5). Our results demonstrated that both ensemble genotyping and LR were effective in
reducing false positives in WGS datasets from a single platform.
To investigate the effect of each independent variable in LR models, we checked the degree
of contribution of each factor on the final models (Supp. Tables S6 and S7). For all variant
types and zygosities except for homozygous deletions, `reported in dbSNP', `present in
parents/children', and `in genic elements' had significant positive effects on the probability
of a variant being true positive (P < 10−5; Wald test). For SNVs, `reported in dbSNP' had the
largest positive effect (odds ratios (ORs) 3.6 for heterozygous and 5.3 for homozygous
SNVs). For INDELs, `present in parents/children' showed the largest effect (ORs 2.2 for
heterozygous and 10.8 for homozygous insertions; 2.2 for heterozygous and 3.8 for
Hwang et al. Page 7
Hum Mutat. Author manuscript; available in PMC 2015 August 01.
NIH-PAAuthorManuscriptNIH-PAAuthorManuscriptNIH-PAAuthorManuscript
8. homozygous deletions). `overlap with RepeatMasker' had negative coefficients for all
variant types. For `SNV type', transitions except for homozygous G>A and C>T had
positive coefficients and transversions had negative coefficients. INDEL length – `length in
bps' – had negative coefficients, suggesting that longer INDELs might be more difficult to
detect. The utility of GQ seemed to be limited since the GQs reported by multiple VCAs had
either positive or negative coefficients according to different variant types and zygosities.
The performance of nVCA+ measured by MCC varied according to cut-off thresholds
(Supp. Figure S4). For SNVs, 6VCA+ had the highest performance compared to 4VCA+
and 5VCA+ for homozygous insertions and deletions, respectively. Heterozygous INDEL
detection was less concordant between VCAs since the MCC decreased when n was greater
than 3.
Impact of variant filtering on false negatives
When identifying disease-associated variants in WGS or WES data, the highest sensitivity is
required while minimizing false positives (Gargis, et al., 2012). To investigate impacts of
the proposed variant filtering methods on false negatives, we used a set of validated variants
in NA12878 (GIAB12878; see Materials and Methods). We trained LR and LR_nVCA
using 16 individual's WGSs excluding NA12878 in our dataset, and compared the filtered
list of NA12878 variants to the high quality variants of GIAB12878. Among 1,597,857
heterozygous and 1,064,964 homozygous SNVs in GIAB12878, 98.6% (1,574,846) and
98.9% (1,053,563) were accurately genotyped by the Illumina CASAVA pipeline.
CASAVA found 72.5% (14,622/20,164) of heterozygous and 89.2% (57,226/64,168) of
homozygous insertions, and 74.2% (13,506/18,209) of heterozygous and 86.9%
(57,823/66,531) of homozygous deletions in the benchmark dataset. These variants were
used as total true positives for our analysis.
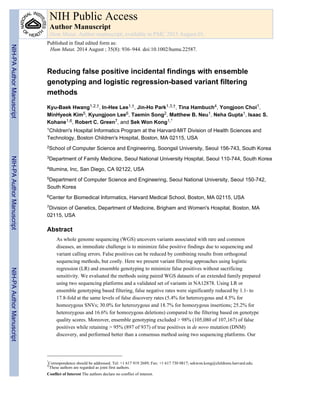
Figure 1 shows the change of FDR and FNR according to varying cut-off values for variant
filtering. For all variant types and zygosities except for heterozygous SNVs, nVCA+ showed
lower FNRs than the other filtering methods at the same FDR regardless of cut-off values.
Both LR and LR_5VCA performed better than nVCA+ in detecting true positive
heterozygous SNVs when n of nVCA+ changed from 1 to 5. However, the FNR for
heterozygous SNVs was the lowest with 6VCA+ at the FDR of 0.0004. Our results suggest
that nVCA+ is especially effective when high level of PPV (see Materials and Methods) is
required. For SNVs, the increase in FNR by nVCA+ was the largest when n changed from 5
to 6. For heterozygous INDELs, change from 3VCA+ to 4VCA+ resulted in the largest FNR
increase. FNRs for homozygous INDELs increased the most when 4VCA+ changed to
5VCA+.
Impact of variant filtering on downstream functional analysis
It is important to retain variants with functional impacts when filtering false positives for
disease-associated variant discovery. We checked the consequence of nVCA+ on
downstream interpretation by examining the proportion of remaining functional variants
after filtering. Increasing n by 1 resulted in 1 to 8% decrease in the SNVs that were
identified by CASAVA with the largest change from 5 to 6 (Figures 2(A) and (B)). A total
of 82.8% heterozygous and 89.9% homozygous SNVs were concordantly called by 6 VCAs
Hwang et al. Page 8
Hum Mutat. Author manuscript; available in PMC 2015 August 01.
NIH-PAAuthorManuscriptNIH-PAAuthorManuscriptNIH-PAAuthorManuscript
9. compared to the ones detected by CASAVA. The numbers of known disease-causing, LoF
(see Materials and Methods), misstart, and nonstop SNVs decreased with filtering; however,
the proportions of these SNVs were always larger than the proportion of total SNVs. The
proportion of retained SNVs after filtering by 6VCA+ was the highest for misstart (93.2%
for heterozygous SNVs and 93.8% for homozygous SNVs). For heterozygous SNVs, 87.1%
of LoF and 92.4% of disease-causing mutations remained after filtering by 6VCA+ when >
17% of heterozygous SNVs were excluded overall. Heterozygous disrupting and
homozygous nonsense variants were less preserved compared to the other functional
categories; however, the retained proportions (84.7% for heterozygous disrupting and 90.5%
for homozygous nonsense SNVs) were significantly higher than the total retained (82.8% for
heterozygous SNVs (P = 0.00035; paired t-test) and 89.9% for homozygous SNVs (P =
0.012; paired t-test)).
INDEL detection was less consistent between different VCAs as previously reported
(O'Rawe, et al., 2013). For heterozygous INDELs, we observed the biggest drop in the
proportion of retained variants after 3VCA+ (Figures 2(C) and 2(E)). Until 3VCA+, 70.5%
(insertions) and 68.8% (deletions) of Illumina calls were retained, but 24.9% (insertions) and
29.0% (deletions) of Illumina calls remained when 5 VCAs were compared. The proportion
of concordant homozygous INDELs to all retained INDELs, on the other hand, decreased
gradually. On average, 48.5% (insertions) and 59.5% (deletions) of CASAVA calls were
also found by 5VCA+ (Figures 2(D) and 2(F)). Importantly, for heterozygous INDELs,
73.5% (insertions) and 74.4% (deletions) of LoF variants were retained while ~30% of
INDELs filtered by 3VCA+ (Figures 2(C) and 2(E)). We observed the same trend for
homozygous INDELs. Overall, > 40% of INDELs were filtered by 5VCA+; but 62.1%
(insertions) and 69.7% (deletions) of homozygous LoF INDELs remained.
Reducing false positive de novo mutation candidates
Screening whole genomes to find DNMs implicated in rare Mendelian and common
disorders is one of the important applications of NGS (Ku, et al., 2013; Veltman and
Brunner, 2012). A large number of DNM candidates might present due to sequencing and
variant calling errors and incomplete coverage compared to the expected germline mutation
rates (Conrad, et al., 2011; Kong, et al., 2012). For all 13 trios (see Materials and Methods),
167,056 (CG) and 155,977 (Illumina) heterozygous variants not attributable to Mendelian
inheritance, including 92,282 (CG) and 99,703 (Illumina) SNVs per trio, were found on
average. A majority of those MIEs were not true DNMs as the concordance rates of MIEs
between CG and Illumina ranged from 1.8 to 5.3% (1.9% for heterozygous SNVs), and the
mean of platform-concordant de novo SNV candidates was 3,565 (Supp. Figure S5). Thus,
the use of multiple sequencing platforms seemed to reduce the number of false positive
DNM candidates significantly. We explored whether our filtering approaches could reduce
false positives in DNM discovery using the validated set of 1,001 DNMs (including 937
autosomal variations) in NA12878 from the study by Conrad and colleagues (Conrad, et al.,
2011). The concordance rate between these validated DNMs and GIAB12878 was > 99.4%
(750 of 754 DNMs in the genomic region covered by GIAB12878), ascertaining the validity
of the two benchmark sets.
Hwang et al. Page 9
Hum Mutat. Author manuscript; available in PMC 2015 August 01.
NIH-PAAuthorManuscriptNIH-PAAuthorManuscriptNIH-PAAuthorManuscript
10. Without any filtering, MIEs in NA12878 contained 86,869 and 108,095 heterozygous SNVs
in CG and Illumina CASAVA variant call files, respectively. Considering the per-generation
mutation rate in human and the fact that the number of validated DNMs in autosomal
regions of that individual's genome was 937, more than 98.8% (CG) and 99.1% (Illumina)
of these MIEs were possible false positive DNM candidates without further filtering. In fact,
the MIEs found by comparing trio variant call files from CG and Illumina platforms
contained 892 and 928 true DNMs, respectively.
Figure 3 summarizes the performance of the proposed DNM discovery methods measured
by PPV and sensitivity with the contours representing iso-F1 scores (see Materials and
Methods). The sensitivities of all proposed approaches were greater than 0.9 except for LR-
based filtering methods: LR_CG (0.35) and LR_ILL (0.60). These sensitivity values were
obtained at the maximum F1 score of the LR filters. Therefore, LR_CG could remove ~65%
of true positive DNMs. Among the filters with high sensitivity values (> 0.9), `2CON &
6VCA+' achieved the highest PPV (0.44). For a single platform, `ILL & 6VCA+' achieved
the highest PPV (0.30). Interestingly, PolyMutt did not perform well (PPV 0.09) compared
to our proposed methods. It should be noted that `ILL & 6VCA+' showed higher PPV and
sensitivity compared to 2CON (0.30 vs. 0.24 and 0.96 vs. 0.95, respectively). Our results
suggest that DNMs could be more effectively identified by ensemble genotyping with a
single sequencing platform compared to simply intersecting the results from two sequencing
platforms.
Discussion
The ability to characterize genome sequences and structural variants accurately and reliably
using NGS technology has improved greatly over the last decade, and WGS/WES are being
integrated into clinical settings. Clinical utility and validity will be tested in coming years;
however, reducing false positive and false negative findings is an immediate concern. In the
current study, we explored the options to reduce false positives due to algorithmic
differences in variant calling methods and platform-specific sequencing errors. Although the
proportion of those false positives might be small, the absolute number could be substantial
considering the size of sequenceable human genome. Using paired WGS datasets of 17
individuals prepared with CG and Illumina sequencing platforms, we developed a LR model
to predict platform-concordant variants from variant call files, and an ensemble genotyping
approach for Illumina BAM files. The proposed LR-based filtering approach outperformed
the simple GQ-based filtering in terms of identifying platform-concordant variants, though
the best performance was achieved by the use of multiple VCAs for ensemble genotyping or
LR. We found that filtering based on GQ was not sufficient in reducing false positives since
other genomic contexts such as repetitive DNA elements and dbSNP annotation were also
important clues for identifying possible false positives. A variant in training data for LR
filtering was labeled as true positive if it was called by the two sequencing platforms. Thus,
two sequencing platforms or highly-confident variants are required for building a LR model.
Once a LR model is trained, it can be applied to any number of genomes obtained using a
single sequencing platform. The main modules of the software application developed for LR
modeling and filtering were written in the C and R languages. Once trained, the scoring of
all 3–5 millions of variants takes no more than 2 minutes. Therefore, LR model based
Hwang et al. Page 10
Hum Mutat. Author manuscript; available in PMC 2015 August 01.
NIH-PAAuthorManuscriptNIH-PAAuthorManuscriptNIH-PAAuthorManuscript
11. filtering approach is highly scalable to thousands of WGS. For the ensemble genotyping
approach, computational cost can be prohibitive for a large dataset. The ensemble
genotyping filter integrates multiple VCAs to reduce false positives due to variant calling
errors, differing from joint variant calling for DNM prioritization which depends on a
specific variant calling strategy (Conrad, et al., 2011; Iossifov, et al., 2012; Neale, et al.,
2012). It also differs from existing variant filtering methods based on the use of various
variant quality measures (DePristo, et al., 2011; Reumers, et al., 2012) and machine learning
techniques (Jiang, et al., 2013; Michaelson, et al., 2012) in that it does not need a set of gold
standard variants for optimizing the filtering performance.
We found that our methods could greatly improve PPV without loss of sensitivity for DNM
discovery. PPV of DNM discovery using a single platform can be as low as 1% given the
low per-generation mutation rate (Conrad, et al., 2011; Kong, et al., 2012). Because the cost
and effort entailed in validating a single DNM candidate are substantial, a measure for
filtering false positives and prioritizing candidates is critically needed. Our ensemble
genotyping approach using a single WGS platform was able to remove > 98% (105,080 of
107,167) of false positives while retaining > 95% (897 of 937) of true positives. This
method, therefore, increased PPV in DNM identification more than a 30-fold (0.30 vs 0.01),
and produced better results than simply focusing on the concordant variants between two
sequencing platforms. It is interesting to note that a pedigree-aware joint calling method
showed the highest sensitivity with a low PPV. Therefore, the ensemble genotyping
approach seems to be more efficient in DNM discovery than machine learning-based
filtering, using multiple sequencing platforms, or pedigree-aware genotyping methods. In
the current study, we limited the DNM analysis for trio, however, DNM candidates across
family members can be easily compared to reduce false positives significantly. In the
supplementary website (http://ml.ssu.ac.kr/LRFilter), we provide the script for comparing
multiple variant call files with different conditions.
There were few limitations in our analysis. Although platform-specific variants generally
have lower quality than platform-concordant ones, they can nevertheless be true positives
(Lam, et al., 2012; Ratan, et al., 2013). For instance, read depth of a specific region in one
platform could be too low to reliably call variants. Also, platform-concordant variants could
be false positives due to the same systematic bias of different WGS platforms (Fuentes
Fajardo, et al., 2012; Lam, et al., 2012; Ross, et al., 2013). Those phenomena should have
influenced training of the LR filter and validation of the proposed filtering methods in
variant prioritization. Thus, the filtering criteria that maximize the performance in our
experiments should serve as a guideline and be adapted according to a given situation. To
evaluate the filters for DNM detection, we used a validated set of DNMs from a study that
was carried out on DNA derived from lymphoblastoid cell lines (Conrad, et al., 2011).
Although we used the same CEPH/Utah pedigree for our comparative analyses, the paired
WGS datasets of the 17 individuals may have been generated from different passage
numbers of the cell lines. If our WGS dataset was generated from the cell lines with more
passages than the ones used in Conrad and colleagues' study (Conrad, et al., 2011), the
actual PPV values would have been higher than reported here. Lastly, we did not
systematically evaluate the discordant calls due to different short read mapping algorithms
(Dohm, et al., 2008; Li and Homer, 2010; Yu, et al., 2012). Bao and colleagues
Hwang et al. Page 11
Hum Mutat. Author manuscript; available in PMC 2015 August 01.
NIH-PAAuthorManuscriptNIH-PAAuthorManuscriptNIH-PAAuthorManuscript
12. comprehensively evaluated available short read mapping tools, and found that most of the
Burrows–Wheeler Transform based algorithms performed comparably well (Bao, et al.,
2011). However, complex variants including short INDELs can be differently represented
according to mapping policy of each alignment algorithm as demonstrated in Figure 2 from
Zook and colleagues' work (Zook, et al., 2014). We checked the effect of mapping
algorithms on variant calling using two different methods – BWA-MEM (Li, 2013) and
ELAND (version 2e) included in the Illumina CASAVA pipeline – while using exactly the
same variant calling pipeline using GATK. The concordance rate between the variants
detected with two mapping methods was 92.1% for heterozygous SNVs, 98.7% for
homozygous SNVs, 80.1% for heterozygous insertions, 88.2% for homozygous insertions,
84.9% for heterozygous deletions, and 93.2% for homozygous deletions (Supp. Figure S6).
Compared to previous results on the concordance rate between two different VCAs (GATK
vs. SAMtools) with a same alignment algorithm (bwa-short (Li and Durbin, 2009)): 77% for
SNVs (Altmann, et al., 2012; O'Rawe, et al., 2013) and 44% for INDELs (O'Rawe, et al.,
2013), the choice of mapping algorithm did not change the variant calls significantly. Future
studies are required to determine the best practice of the combinations of different aligners
and VCAs for each sequencing platform.
To summarize, we successfully reduced false positive variants with a WGS study using a
LR-based variant prioritization and ensemble genotyping approaches. The ensemble
genotyping approach, which showed better performance for most cases, can only be used
when the raw alignment is available in standard BAM format, although it is supported by
most widely used sequencing platforms: SOLiD and Ion Torrent from Life Technologies;
HiSeq, MiSeq, and GAIIx from Illumina; GS from 454 Life Sciences; PacBio RS. For CG
WGS data, for instance, no alternative alignment and variant calling methods are available,
making it impractical to use the ensemble genotyping approach. In those cases, our LR-
based prioritization method, which requires only final variant calls annotated with various
genomic contexts, can be deployed (available for download at http://ml.ssu.ac.kr/LRFilter).
The ensemble genotyping method is easily applicable to WGS results in the standard BAM
format with the provided scripts.
Supplementary Material
Refer to Web version on PubMed Central for supplementary material.
Acknowledgments
Funding: This work was supported by the NHGRI U01HG006500 to R.C.G., I.S.K., and S.W.K., NIMH
P50MH094267 to S.W.K. and I.S.K., NRF-2012R1A1A2039822 to T.S. and K.-B.H., NRF-2012M3A9D1054705
to K.-B.H., and UF-HHMI Science for Life Program to M.B.N.
References
1000 Genomes Project Consortium. A map of human genome variation from population-scale
sequencing. Nature. 2010; 467(7319):1061–73. [PubMed: 20981092]
Ajay SS, Parker SC, Abaan HO, Fajardo KV, Margulies EH. Accurate and comprehensive sequencing
of personal genomes. Genome Res. 2011; 21(9):1498–505. [PubMed: 21771779]
Hwang et al. Page 12
Hum Mutat. Author manuscript; available in PMC 2015 August 01.
NIH-PAAuthorManuscriptNIH-PAAuthorManuscriptNIH-PAAuthorManuscript
13. Altmann A, Weber P, Bader D, Preuss M, Binder EB, Muller-Myhsok B. A beginners guide to SNP
calling from high-throughput DNA-sequencing data. Hum Genet. 2012; 131(10):1541–54.
[PubMed: 22886560]
Bao S, Jiang R, Kwan W, Wang B, Ma X, Song YQ. Evaluation of next-generation sequencing
software in mapping and assembly. J Hum Genet. 2011; 56(6):406–14. [PubMed: 21525877]
Boycott KM, Vanstone MR, Bulman DE, MacKenzie AE. Rare-disease genetics in the era of next-
generation sequencing: discovery to translation. Nat Rev Genet. 2013; 14(10):681–91. [PubMed:
23999272]
Challis D, Yu J, Evani US, Jackson AR, Paithankar S, Coarfa C, Milosavljevic A, Gibbs RA, Yu F. An
integrative variant analysis suite for whole exome next-generation sequencing data. BMC
Bioinformatics. 2012; 13:8. [PubMed: 22239737]
Cingolani P, Platts A, Wang le L, Coon M, Nguyen T, Wang L, Land SJ, Lu X, Ruden DM. A
program for annotating and predicting the effects of single nucleotide polymorphisms, SnpEff:
SNPs in the genome of Drosophila melanogaster strain w1118; iso-2; iso-3. Fly (Austin). 2012;
6(2):80–92. [PubMed: 22728672]
Cirulli ET, Goldstein DB. Uncovering the roles of rare variants in common disease through whole-
genome sequencing. Nat Rev Genet. 2010; 11(6):415–25. [PubMed: 20479773]
Conrad DF, Keebler JE, DePristo MA, Lindsay SJ, Zhang Y, Casals F, Idaghdour Y, Hartl CL, Torroja
C, Garimella KV, et al. Variation in genome-wide mutation rates within and between human
families. Nat Genet. 2011; 43(7):712–4. [PubMed: 21666693]
DePristo MA, Banks E, Poplin R, Garimella KV, Maguire JR, Hartl C, Philippakis AA, del Angel G,
Rivas MA, Hanna M, et al. A framework for variation discovery and genotyping using next-
generation DNA sequencing data. Nat Genet. 2011; 43(5):491–8. [PubMed: 21478889]
Dohm JC, Lottaz C, Borodina T, Himmelbauer H. Substantial biases in ultra-short read data sets from
high-throughput DNA sequencing. Nucleic Acids Res. 2008; 36(16):e105. [PubMed: 18660515]
Drmanac R, Sparks AB, Callow MJ, Halpern AL, Burns NL, Kermani BG, Carnevali P, Nazarenko I,
Nilsen GB, Yeung G, et al. Human genome sequencing using unchained base reads on self-
assembling DNA nanoarrays. Science. 2010; 327(5961):78–81. [PubMed: 19892942]
Fuentes Fajardo KV, Adams D, Program NCS, Mason CE, Sincan M, Tifft C, Toro C, Boerkoel CF,
Gahl W, Markello T. Detecting false-positive signals in exome sequencing. Hum Mutat. 2012;
33(4):609–13. [PubMed: 22294350]
Gargis AS, Kalman L, Berry MW, Bick DP, Dimmock DP, Hambuch T, Lu F, Lyon E, Voelkerding
KV, Zehnbauer BA, et al. Assuring the quality of next-generation sequencing in clinical laboratory
practice. Nat Biotechnol. 2012; 30(11):1033–6. [PubMed: 23138292]
Garrison, E.; Marth, G. Haplotype-based variant detection from short-read sequencing. 2012.
Iossifov I, Ronemus M, Levy D, Wang Z, Hakker I, Rosenbaum J, Yamrom B, Lee YH, Narzisi G,
Leotta A, et al. De novo gene disruptions in children on the autistic spectrum. Neuron. 2012;
74(2):285–99. [PubMed: 22542183]
Jiang YH, Yuen RK, Jin X, Wang M, Chen N, Wu X, Ju J, Mei J, Shi Y, He M, et al. Detection of
Clinically Relevant Genetic Variants in Autism Spectrum Disorder by Whole-Genome
Sequencing. Am J Hum Genet. 2013
Koboldt DC, Chen K, Wylie T, Larson DE, McLellan MD, Mardis ER, Weinstock GM, Wilson RK,
Ding L. VarScan: variant detection in massively parallel sequencing of individual and pooled
samples. Bioinformatics. 2009; 25(17):2283–5. [PubMed: 19542151]
Kohane IS, Hsing M, Kong SW. Taxonomizing, sizing, and overcoming the incidentalome. Genet
Med. 2012; 14(4):399–404. [PubMed: 22323072]
Kong A, Frigge ML, Masson G, Besenbacher S, Sulem P, Magnusson G, Gudjonsson SA, Sigurdsson
A, Jonasdottir A, Wong WS, et al. Rate of de novo mutations and the importance of father's age to
disease risk. Nature. 2012; 488(7412):471–5. [PubMed: 22914163]
Ku CS, Polychronakos C, Tan EK, Naidoo N, Pawitan Y, Roukos DH, Mort M, Cooper DN. A new
paradigm emerges from the study of de novo mutations in the context of neurodevelopmental
disease. Mol Psychiatry. 2013; 18(2):141–53. [PubMed: 22641181]
Hwang et al. Page 13
Hum Mutat. Author manuscript; available in PMC 2015 August 01.
NIH-PAAuthorManuscriptNIH-PAAuthorManuscriptNIH-PAAuthorManuscript
14. Lam HY, Clark MJ, Chen R, Chen R, Natsoulis G, O'Huallachain M, Dewey FE, Habegger L, Ashley
EA, Gerstein MB, et al. Performance comparison of whole-genome sequencing platforms. Nat
Biotechnol. 2012; 30(1):78–82. [PubMed: 22178993]
Ley TJ, Ding L, Walter MJ, McLellan MD, Lamprecht T, Larson DE, Kandoth C, Payton JE, Baty J,
Welch J, et al. DNMT3A mutations in acute myeloid leukemia. N Engl J Med. 2010; 363(25):
2424–33. [PubMed: 21067377]
Li B, Chen W, Zhan X, Busonero F, Sanna S, Sidore C, Cucca F, Kang HM, Abecasis GR. A
likelihood-based framework for variant calling and de novo mutation detection in families. PLoS
Genet. 2012; 8(10):e1002944. [PubMed: 23055937]
Li H. Aligning sequence reads, clone sequences and assembly contigs with BWA-MEM. ArXiv e-
prints. 2013:3997.
Li H, Durbin R. Fast and accurate short read alignment with Burrows-Wheeler transform.
Bioinformatics. 2009; 25(14):1754–60. [PubMed: 19451168]
Li H, Handsaker B, Wysoker A, Fennell T, Ruan J, Homer N, Marth G, Abecasis G, Durbin R,
Genome Project Data Processing S. The Sequence Alignment/Map format and SAMtools.
Bioinformatics. 2009; 25(16):2078–9. [PubMed: 19505943]
Li H, Homer N. A survey of sequence alignment algorithms for next-generation sequencing. Brief
Bioinform. 2010; 11(5):473–83. [PubMed: 20460430]
Lohmueller KE, Sparso T, Li Q, Andersson E, Korneliussen T, Albrechtsen A, Banasik K, Grarup N,
Hallgrimsdottir I, Kiil K, et al. Whole-exome sequencing of 2,000 Danish individuals and the role
of rare coding variants in type 2 diabetes. Am J Hum Genet. 2013; 93(6):1072–86. [PubMed:
24290377]
McKenna A, Hanna M, Banks E, Sivachenko A, Cibulskis K, Kernytsky A, Garimella K, Altshuler D,
Gabriel S, Daly M, et al. The Genome Analysis Toolkit: a MapReduce framework for analyzing
next-generation DNA sequencing data. Genome Res. 2010; 20(9):1297–303. [PubMed: 20644199]
Michaelson JJ, Shi Y, Gujral M, Zheng H, Malhotra D, Jin X, Jian M, Liu G, Greer D, Bhandari A, et
al. Whole-genome sequencing in autism identifies hot spots for de novo germline mutation. Cell.
2012; 151(7):1431–42. [PubMed: 23260136]
Neale BM, Kou Y, Liu L, Ma'ayan A, Samocha KE, Sabo A, Lin CF, Stevens C, Wang LS, Makarov
V, et al. Patterns and rates of exonic de novo mutations in autism spectrum disorders. Nature.
2012; 485(7397):242–5. [PubMed: 22495311]
O'Rawe J, Jiang T, Sun G, Wu Y, Wang W, Hu J, Bodily P, Tian L, Hakonarson H, Johnson WE, et al.
Low concordance of multiple variant-calling pipelines: practical implications for exome and
genome sequencing. Genome Med. 2013; 5(3):28. [PubMed: 23537139]
Pabinger S, Dander A, Fischer M, Snajder R, Sperk M, Efremova M, Krabichler B, Speicher MR,
Zschocke J, Trajanoski Z. A survey of tools for variant analysis of next-generation genome
sequencing data. Brief Bioinform. 2013
Pleasance ED, Stephens PJ, O'Meara S, McBride DJ, Meynert A, Jones D, Lin ML, Beare D, Lau KW,
Greenman C, et al. A small-cell lung cancer genome with complex signatures of tobacco exposure.
Nature. 2010; 463(7278):184–90. [PubMed: 20016488]
Ratan A, Miller W, Guillory J, Stinson J, Seshagiri S, Schuster SC. Comparison of sequencing
platforms for single nucleotide variant calls in a human sample. PLoS One. 2013; 8(2):e55089.
[PubMed: 23405114]
Reese MG, Moore B, Batchelor C, Salas F, Cunningham F, Marth GT, Stein L, Flicek P, Yandell M,
Eilbeck K. A standard variation file format for human genome sequences. Genome Biol. 2010;
11(8):R88. [PubMed: 20796305]
Rehm HL. Disease-targeted sequencing: a cornerstone in the clinic. Nat Rev Genet. 2013; 14(4):295–
300. [PubMed: 23478348]
Reumers J, De Rijk P, Zhao H, Liekens A, Smeets D, Cleary J, Van Loo P, Van Den Bossche M,
Catthoor K, Sabbe B, et al. Optimized filtering reduces the error rate in detecting genomic variants
by short-read sequencing. Nat Biotechnol. 2012; 30(1):61–8. [PubMed: 22178994]
Ross MG, Russ C, Costello M, Hollinger A, Lennon NJ, Hegarty R, Nusbaum C, Jaffe DB.
Characterizing and measuring bias in sequence data. Genome Biol. 2013; 14(5):R51. [PubMed:
23718773]
Hwang et al. Page 14
Hum Mutat. Author manuscript; available in PMC 2015 August 01.
NIH-PAAuthorManuscriptNIH-PAAuthorManuscriptNIH-PAAuthorManuscript
15. Sherry ST, Ward MH, Kholodov M, Baker J, Phan L, Smigielski EM, Sirotkin K. dbSNP: the NCBI
database of genetic variation. Nucleic Acids Res. 2001; 29(1):308–11. [PubMed: 11125122]
Smit, AFA.; Hubley, R.; Green, P. RepeatMasker Open-3.0. 1996–2010. http://www.repeatmasker.org
Song T, Hwang KB, Hsing M, Lee K, Bohn J, Kong SW. gSearch: a fast and flexible general search
tool for whole-genome sequencing. Bioinformatics. 2012; 28(16):2176–7. [PubMed: 22730434]
Stenson PD, Mort M, Ball EV, Howells K, Phillips AD, Thomas NS, Cooper DN. The Human Gene
Mutation Database: 2008 update. Genome Med. 2009; 1(1):13. [PubMed: 19348700]
Veltman JA, Brunner HG. De novo mutations in human genetic disease. Nat Rev Genet. 2012; 13(8):
565–75. [PubMed: 22805709]
Wetterstrand, K. DNA Sequencing Costs: Data from the NHGRI Genome Sequencing Program (GSP).
2013.
Worthey EA, Mayer AN, Syverson GD, Helbling D, Bonacci BB, Decker B, Serpe JM, Dasu T,
Tschannen MR, Veith RL, et al. Making a definitive diagnosis: successful clinical application of
whole exome sequencing in a child with intractable inflammatory bowel disease. Genet Med.
2011; 13(3):255–62. [PubMed: 21173700]
Yang Y, Muzny DM, Reid JG, Bainbridge MN, Willis A, Ward PA, Braxton A, Beuten J, Xia F, Niu
Z, et al. Clinical whole-exome sequencing for the diagnosis of mendelian disorders. N Engl J Med.
2013; 369(16):1502–11. [PubMed: 24088041]
Yu X, Guda K, Willis J, Veigl M, Wang Z, Markowitz S, Adams MD, Sun S. How do alignment
programs perform on sequencing data with varying qualities and from repetitive regions? BioData
Min. 2012; 5(1):6. [PubMed: 22709551]
Zook JM, Chapman B, Wang J, Mittelman D, Hofmann O, Hide W, Salit M. Integrating human
sequence data sets provides a resource of benchmark SNP and indel genotype calls. Nat
Biotechnol. 2014
Hwang et al. Page 15
Hum Mutat. Author manuscript; available in PMC 2015 August 01.
NIH-PAAuthorManuscriptNIH-PAAuthorManuscriptNIH-PAAuthorManuscript
16. Figure 1.
Changes in false discovery rate (FDR) and false negative rate (FNR) of four variant filtering
methods for Illumina – genotype quality score (GQ), logistic regression (LR), ensemble
genotyping (nVCA+), and LR combined with multiple VCAs (LR_5VCA for SNVs and
LR_4VCA for INDELs) – according to cut-off values. The performance of each method was
evaluated using a set of benchmark variants in NA12878 compiled by the Genome in a
Bottle Consortium. Results are separately shown for heterozygous SNVs (A), homozygous
SNVs (B), heterozygous insertions (C), homozygous insertions (D), heterozygous deletions
(E), and homozygous deletions (F).
Hwang et al. Page 16
Hum Mutat. Author manuscript; available in PMC 2015 August 01.
NIH-PAAuthorManuscriptNIH-PAAuthorManuscriptNIH-PAAuthorManuscript
17. Figure 2.
Changes in proportion of variants retained after filtering by nVCA+ according to cutoff
values (1 to 6VCA+ for SNVs; 1 to 5VCA+ for INDELs). In the x-axis, `Illumina' means
no-filtering. HGMD_DM: disease-causing mutations based on the Human Gene Mutation
Database. LoF: loss of function variants including nonsense, splice-site disrupting, and
frameshift variants. Results are separately shown for heterozygous SNVs (A), homozygous
SNVs (B), heterozygous insertions (C), homozygous insertions (D), heterozygous deletions
(E), and homozygous deletions (F). In (B), HGMD_DM for homozygous SNVs is not
shown because the number of such variants was too low (only 1.65 per individual).
Hwang et al. Page 17
Hum Mutat. Author manuscript; available in PMC 2015 August 01.
NIH-PAAuthorManuscriptNIH-PAAuthorManuscriptNIH-PAAuthorManuscript
18. Figure 3.
Performance comparison of DNM discovery methods: comparison of trio variant call files
from the CG platform (CG); comparison of trio variant call files from the Illumina platform
(ILL); consensus calls between CG and Illumina (2CON); a family-aware DNM caller
(PolyMutt); logistic regression based filtering of DNM candidates in CG (LR_CG); logistic
regression based filtering of DNM candidates in Illumina (LR_ILL); ensemble genotyping
using 6 variant calling algorithms (6VCA+); consensus calls between 6VCA+ and ILL (ILL
& 6VCA+); consensus calls between 2CON and 6VCA+ (2CON & 6VCA+). The
performance of each method was evaluated on a set of validated DNMs in NA12878, using
positive predictive value (PPV) and sensitivity. Contours represent iso-F1 scores.
Hwang et al. Page 18
Hum Mutat. Author manuscript; available in PMC 2015 August 01.
NIH-PAAuthorManuscriptNIH-PAAuthorManuscriptNIH-PAAuthorManuscript
19. NIH-PAAuthorManuscriptNIH-PAAuthorManuscriptNIH-PAAuthorManuscript
Hwang et al. Page 19
Table1
SummaryofgenomicvariantsfoundbyCompleteGenomicsandIlluminanext-generationsequencingplatforms.Meanandstandarddeviation–mean(standarddeviation)–ofthe17individualsofCEPH/
UtahPedigree1463areshownforeachvarianttype.Autosomalvariantsarelistedinthetable.Overall,morevariantswerefoundbyIllumina(P=2.9×10−21,5.4×10−12,and3.7×10−11forSNV,insertion,
anddeletion,respectively;pairedt-test)exceptforcomplexsubstitutions(P=7.6×10⁻²⁸;pairedt-test).
PlatformTotal
bases
(Gb)
CoverageCovered
genome
fraction
(%)with
≥10x
SNVInsertionDeletionComplex
substitution
Total
CompleteGenomics226.7(9.6)x79.6(3.4)98.8(0.003)3,369,107(15,631)239,354(11,107)254,614(11,351)84,033(1,970)3,947,107(33,621)
Illumina112.2(9.4)x39.4(3.3)95.2(0.7)3,718,282(12,604)304,114(8,765)310,359(7,515)1,791(52)4,334,546(24,913)
Hum Mutat. Author manuscript; available in PMC 2015 August 01.
20. NIH-PAAuthorManuscriptNIH-PAAuthorManuscriptNIH-PAAuthorManuscript
Hwang et al. Page 20
Table 2
Performance comparison of variant prioritization in WGS results from the Illumina platform. Variants called
in both Complete Genomics and Illumina platforms were considered as “probable true positives.”
Variant type Zygosity Filter %Reduced FDR (%) FNR (%) MCC
SNV
Het
GQ 51.0 5.4 45.1 0.57
LR 47.9 5.4 41.6 0.59
nVCA+ 17.2 5.4 7.1 0.62
LR_5VCA 14.8 5.4 4.5 0.68
Hom
GQ 55.1 4.5 51.5 0.53
LR 40.4 4.5 35.7 0.55
nVCA+ 10.1 4.5 2.9 0.66
LR_5VCA 10.7 4.5 3.6 0.66
Insertion
Het
GQ 79.0 30.1 74.1 0.16
LR 43.6 30.0 30.2 0.33
nVCA+ 29.5 30.0 12.5 0.42
LR_4VCA 27.4 30.0 10.0 0.46
Hom
GQ 55.6 18.7 38.0 0.49
LR 43.6 18.7 21.3 0.54
nVCA+ 38.6 18.7 14.2 0.59
LR_4VCA 40.0 18.7 16.3 0.59
Deletion
Het
GQ 71.4 25.2 63.8 0.22
LR 46.7 25.2 32.4 0.35
nVCA+ 31.2 25.2 12.5 0.48
LR_4VCA 29.6 25.2 10.6 0.54
Hom
GQ 86.3 17.2 81.5 0.30
LR 56.4 16.6 40.9 0.41
nVCA+ 40.5 16.6 19.1 0.51
LR_4VCA 41.4 16.6 20.6 0.54
GQ: filtering by genotype quality score reported by Illumina. LR: filtering by logistic regression. nVCA+: filtering by ensemble genotyping.
LR_nVCA: logistic regression with multiple VCAs (n = 5 for SNVs and 4 for INDELs). %Reduced: proportion of variants removed by filtering.
FDR: false discovery rate. FNR: false negative rate. MCC: Matthew's Correlation Coefficient, of which values range from −1 (total disagreement)
to 0 (random) to 1 (perfect correlation). Mean for the 17 individuals is shown.
Hum Mutat. Author manuscript; available in PMC 2015 August 01.