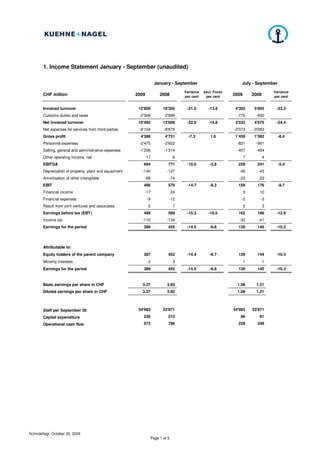
1. 1. Income Statement January - September (unaudited)
Invoiced turnover 12'800 16'305 -21.5 -13.6 4'302 5'605 -23.2
Customs duties and taxes -2'308 -2'699 -770 -930
Net invoiced turnover 10'492 13'606 -22.9 -14.8 3'532 4'675 -24.4
Net expenses for services from third parties -6'104 -8'875 -2'073 -3'083
Gross profit 4'388 4'731 -7.3 1.6 1'459 1'592 -8.4
Personnel expenses -2'475 -2'652 -831 -901
Selling, general and administrative expenses -1'236 -1'314 -407 -454
Other operating income, net 17 6 7 4
EBITDA 694 771 -10.0 -3.8 228 241 -5.4
Depreciation of property, plant and equipment -140 -127 -46 -43
Amortisation of other intangibles -68 -74 -23 -22
EBIT 486 570 -14.7 -9.3 159 176 -9.7
Financial income 17 24 3 10
Financial expenses -9 -12 -2 -3
Result from joint ventures and associates 5 7 2 3
Earnings before tax (EBT) 499 589 -15.3 -10.0 162 186 -12.9
Income tax -110 -134 -32 -41
Earnings for the period 389 455 -14.5 -9.8 130 145 -10.3
Attributable to:
Equity holders of the parent company 387 452 -14.4 -9.7 129 144 -10.4
Minority interests 2 3 1 1
Earnings for the period 389 455 -14.5 -9.8 130 145 -10.3
Basic earnings per share in CHF 3.27 3.83 1.08 1.21
Diluted earnings per share in CHF 3.27 3.82 1.08 1.21
Staff per September 30 54'983 53'871 54'983 53'871
Capital expenditure 230 212 66 81
Operational cash flow 673 786 228 248
2009 2008
Variance
per cent
July - SeptemberJanuary - September
excl. Forex
per cent
Variance
per cent
CHF million 2009 2008
Schindellegi, October 20, 2009
Page 1 of 5
2. Assets
Property, plant and equipment 1'325 955 1'006
Goodwill 681 540 598
Other intangibles 307 202 234
Investments in joint ventures 11 10 12
Deferred tax assets 197 157 149
Non-current assets 2'521 1'864 1'999
Prepayments 124 88 173
Work in progress 200 269 320
Trade receivables 1'927 2'143 2'532
Other receivables 186 152 282
Cash and cash equivalents 817 1'039 1'097
Assets held for sale - - 42
Current assets 3'254 3'691 4'446
Total assets 5'775 5'555 6'445
Liabilities and equity
Share capital 120 120 120
Reserves and retained earnings 1'724 1'359 1'854
Earnings for the period 387 585 452
Total equity attributable to the equity holders of the parent company 2'231 2'064 2'426
Minority interests 9 9 11
Total equity 2'240 2'073 2'437
Provisions for pension plans and severance payments 261 268 302
Deferred tax liabilities 234 111 129
Bank liabilities 7 12 57
Finance lease obligations 167 32 51
Non-current liabilities 669 423 539
Bank and other interest bearing liabilities 20 65 33
Trade payables 930 1'129 1'189
Accrued trade expenses/deferred income 851 873 1'115
Current tax liabilities 99 152 248
Provisions 123 111 94
Other liabilities 843 729 790
Current liabilities 2'866 3'059 3'469
Total liabilities and equity 5'775 5'555 6'445
Sep. 30,
2008
Dec. 31,
2008
2. Balance Sheet (unaudited)
CHF million
Sep. 30,
2009
Schindellegi, October 20, 2009
Page 2 of 5
3. 3. Statement of Changes in Equity January - September (unaudited)
Balance as of January 1 2'073 2'367
Foreign exchange differences 8 -153
Actuarial gains/(losses) on defined benefit plans, net 18 -1
Net income recognised directly in equity, net of tax 26 -154
Earnings for the period 387 452
Total recognised income and expense for the period 413 298
Purchase of treasury shares - -29
Disposal of treasury shares 21 12
Dividend paid -274 -224
Expenses for employee share purchase and option plan 7 11
Changes in minority interests - 2
Balance as of September 30 2'240 2'437
4. Condensed Cash Flow Statement January - September (unaudited)
Operational cash flow 673 786 -113 228 248
Changes in working capital 98 -143 241 50 66
Income taxes paid -167 -134 -33 -59 -61
Cash flow from operating activities 604 509 95 219 253
Cash flow from investing activities -481 72 -553 -56 -72
Cash flow from financing activities -353 -288 -65 1 -12
Exchange difference on cash and cash equivalents 9 -41 50 -6 -2
Increase/(decrease) in cash and cash equivalents -221 252 -473 158 167
Cash and cash equivalents at the beginning of the period, net 1'018 812 206 639 897
Cash and cash equivalents at the end of the period, net 797 1'064 -267 797 1'064
CHF million . 2009 . 2008
July - SeptemberJanuary - September
CHF million 2009 2008 Variance 2009 2008
Schindellegi, October 20, 2009
Page 3 of 5
4. 5. Segment Reporting January - September (unaudited)
a) Primary reporting
CHF million
Invoiced turnover (external customers) 12'800 16'305 5'619 7'475 2'029 2'936 1'836 2'217 3'227 3'581 4 4 85 92 12'800 16'305 - -
Invoiced inter-segment turnover - - 1'068 1'423 1'021 1'759 681 568 60 115 63 69 43 49 2'936 3'983 -2'936 -3'983
Customs duties and taxes -2'308 -2'699 -1'684 -2'014 -381 -462 -107 -119 -136 -104 - - - - -2'308 -2'699 - -
Net invoiced turnover 10'492 13'606 5'003 6'884 2'669 4'233 2'410 2'666 3'151 3'592 67 73 128 141 13'428 17'589 -2'936 -3'983
Net expenses for services from third parties -6'104 -8'875 -4'095 -5'870 -2'187 -3'683 -1'807 -2'213 -788 -914 - - -100 -109 -8'977 -12'789 2'873 3'914
Gross profit 4'388 4'731 908 1'014 482 550 603 453 2'363 2'678 67 73 28 32 4'451 4'800 -63 -69
Total expenses -3'694 -3'960 -613 -688 -341 -381 -570 -431 -2'212 -2'496 -7 -17 -14 -16 -3'757 -4'029 63 69
EBITDA 694 771 295 326 141 169 33 22 151 182 60 56 14 16 694 771 - -
Depreciation of property, plant and
equipment -140 -127 -14 -15 -9 -9 -34 -10 -66 -76 -17 -17 - - -140 -127 - -
Amortisation of other intangibles -68 -74 -11 -15 -5 -9 -22 -15 -30 -34 - -1 - - -68 -74 - -
EBIT (Segment profit/(loss)) 486 570 270 296 127 151 -23 -3 55 72 43 38 14 16 486 570 - -
Financial income 17 24
Financial expenses -9 -12
Result from joint ventures and associates 5 7 2 3 - - 2 1 1 3 - - - - 5 7 - -
Earnings before tax (EBT) 499 589
Income tax -110 -134
Earnings for the period 389 455
Attributable to:
Equity holders of the parent company 387 452
Minority interests 2 3
Earnings for the period 389 455
Contract Logistics
2009 2008 2009 2008
TOTAL GROUP Seafreight Airfreight Road & Rail Logistics
2009
Real Estate Insurance Brokers Eliminations
2008 2009 2008 2009 2009 2008 2009 20082008 2008 2009
Total Reportable
Segments
2009 2008
Schindellegi, October 20, 2009
4 of 5
5. 5. Segment Reporting January - September (unaudited)
a) Secondary reporting
CHF million
Invoiced turnover (external customers) 12'800 16'305 8'534 10'868 2'364 3'120 1'034 1'387 868 930 - -
Invoiced inter-region turnover - - 1'755 2'386 405 541 615 866 98 121 -2'873 -3'914
Customs duties and taxes -2'308 -2'699 -1'376 -1'655 -461 -517 -143 -169 -328 -358 - -
Net invoiced turnover 10'492 13'606 8'913 11'599 2'308 3'144 1'506 2'084 638 693 -2'873 -3'914
Net expenses for services from third parties -6'104 -8'875 -5'551 -8'008 -1'716 -2'477 -1'185 -1'729 -525 -575 2'873 3'914
Gross profit 4'388 4'731 3'362 3'591 592 667 321 355 113 118 - -
Total expenses -3'694 -3'960 -2'926 -3'103 -484 -543 -197 -222 -87 -92 - -
EBITDA 694 771 436 488 108 124 124 133 26 26 - -
Depreciation of property, plant and equipment -140 -127 -112 -99 -17 -16 -7 -8 -4 -4 - -
Amortisation of other intangibles -68 -74 -59 -66 -5 -4 -3 -3 -1 -1 - -
EBIT (Segment profit/(loss)) 486 570 265 323 86 104 114 122 21 21 - -
Financial income 17 24
Financial expenses -9 -12
Result from joint ventures and associates 5 7 5 6 - - - - - 1 - -
Earnings before tax (EBT) 499 589
Income tax -110 -134
Earnings for the period 389 455
Attributable to:
Equity holders of the parent company 387 452
Minority interests 2 3
Earnings for the period 389 455
2009 2008
TOTAL GROUP Europe Americas
2009 2008 2009 2008
Asia Pacific
Middle East, Central Asia and
Africa
Eliminations
2009 2008 2009 2008 2009 2008
Schindellegi, October 20, 2009
5 of 5