Percent of employed persons who work at home
•
0 gefällt mir•810 views

Percent of employed persons who worked at home

Empfohlen
Weitere ähnliche Inhalte
Andere mochten auch
Andere mochten auch (7)
Ähnlich wie Percent of employed persons who work at home
Ähnlich wie Percent of employed persons who work at home (7)
Mehr von Nar Res
Mehr von Nar Res (20)
Kürzlich hochgeladen
Kürzlich hochgeladen (20)
Percent of employed persons who work at home
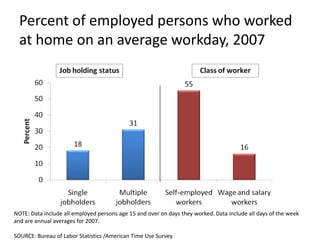
- 1. Percent of employed persons who worked at home on an average workday, 2007 NOTE: Data include all employed persons age 15 and over on days they worked. Data include all days of the week and are annual averages for 2007. SOURCE: Bureau of Labor Statistics /American Time Use Survey
- 2. Percent of employed persons who worked at home on an average workday, 2008 Job holding status Class of worker 60 55 50 40 36 Percent 30 19 17 20 10 0 Single Multiple Self-employed Wage and salary jobholders jobholders workers workers NOTE: Data include all employed persons age 15 and over on days they worked. Data include all days of the week and are annual averages for 2008. SOURCE: Bureau of Labor Statistics /American Time Use Survey
- 3. Percent of employed persons who worked at home on an average workday, 2011 Job holding Class of worker 60 status 55.9 50 40 Percent 30.6 30 20.2 18.2 20 10 0 Single Multiple Self-employed Wage and salary jobholders jobholders workers workers NOTE: Data include all employed persons age 15 and over on days they worked. Data include all days of the week and are annual averages for 2011. SOURCE: Bureau of Labor Statistics /American Time Use Survey; Tables 6 and 7
- 4. Percent of employed persons who worked at home on an average workday Job holding status Class of worker 60 55 55 56 50 40 36 Percent 31 31 30 20 18 19 20 16 17 18 2007 2008 2007 2008 2007 2008 2007 2011 2011 2008 2011 2011 10 0 Single jobholders Multiple Self-employed Wage and salary jobholders workers workers NOTE: Data include all employed persons age 15 and over on days they worked. Data include all days of the week and are annual averages for 2007, 2008, and 2011 respectively. SOURCE: Bureau of Labor Statistics /American Time Use Survey; Tables 6 and 7
- 5. Higher Earning Individuals are More Likely to Work from Home, 2008 Percent Working at Home and Hours Worked at Home by Usual Weekly Earnings 35 31 30 25 20 16 15 10 8 8 5 1.77 1.97 2.46 0 0 - $500 $501 - $780 $781 - $1,210 $1,211 and higher Usual Weekly Earnings NOTE: Data include all employed persons age 15 and over on days they worked. Data include all days of the week and are annual averages for 2008. SOURCE: Bureau of Labor Statistics /American Time Use Survey
- 6. Higher Earning Individuals are More Likely to Work from Home, 2011 Percent Working at Home and Hours Worked at Home by Usual Weekly Earnings Percent Working at Home Hours 35 30 30 25 20 20 15 11 10 7 5 2.05 2.47 2.68 0 0 - $520 $521 - $810 $811 - $1,240 $1,241 and higher Usual Weekly Earnings NOTE: Data include all employed persons age 15 and over on days they worked. Data include all days of the week and are annual averages for 2011. SOURCE: Bureau of Labor Statistics /American Time Use Survey; Table 7
- 7. Professional Workers are More Likely to Work from Home, 2008 Percent Working at Home and Hours Worked at Home by Occupation Average Hours of Work at Home Percent Working at Home Transportation and material moving 7 Production 6 Installation, maintenance, and repair 9 Construction and extraction 6 Office and administrative support 2.11 12 Sales and related 2.84 24 Services 3.67 13 Professional and related 2.54 32 Management, business, and financial… 3.18 30 0 5 10 15 20 25 30 35 NOTE: Data include all employed persons age 15 and over on days they worked. Data include all days of the week and are annual averages for 2008. SOURCE: Bureau of Labor Statistics /American Time Use Survey
- 8. Professional Workers are More Likely to Work from Home, 2011 Percent Working at Home and Hours Worked at Home by Occupation Average Hours of Work at Home Percent Working at Home Transportation and material moving 5 Production 5 Installation, maintenance, and repair 11 Construction and extraction 10 Office and administrative support 2.97 13 Sales and related 3.15 20 Services 3.88 10 Professional and related 2.34 34 Management, business, and financial… 3.16 34 0 5 10 15 20 25 30 35 40 NOTE: Data include all employed persons age 15 and over on days they worked. Data include all days of the week and are annual averages for 2011. SOURCE: Bureau of Labor Statistics /American Time Use Survey; Table 7
- 9. More Educated Workers are More Likely to Work from Home, 2011 Percent Working at Home and Hours Worked at Home by Educational Attainment Average Hours of Work at Home Percent Working at Home Bachelor's degree and higher 36 Some college or associate degree 20 High school graduates, no college 11 Less than a high school diploma 11 0 5 10 15 20 25 30 35 40 NOTE: Data include all employed persons age 25 and over on days they worked. Data include all days of the week and are annual averages for 2011. SOURCE: Bureau of Labor Statistics /American Time Use Survey; Table 7