Influencing policy (training slides from Fast Track Impact)
polymer testing-22.ppt
1. Gel Permeation Chromatography
This is a type of liquid chromatography (also called size exclusion chromatography).
The main advantage of the gel permeation chromatography is that the whole molecular
mass distribution of the polymer sample can be measured in these experiments,
contrary to the other methods which allow measurement of the mean values only.
• one uses a different type of column for separation
• not the affinity but rather the residence time in different
sized pores of the packing material matters
•the beads are usually made from styrene and divinyl
benzene copolymer of controllable diameters
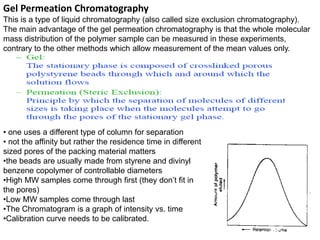
•High MW samples come through first (they don’t fit in
the pores)
•Low MW samples come through last
•The Chromatogram is a graph of intensity vs. time
•Calibration curve needs to be calibrated.
2. 1. Reciprocating piston pump delivers eluent (solvent)
from reservoir at a constant volumetric flow rate.
2.Injection valve permits introduction of
sample solution. GPC tends to use larger injection
volumes than HPLC (typically up to 200µl).
3.GPC columns perform a separation based on the
molecular size of polymer molecules in solution.
Resolution and/or resolving range is increased by use of
multiple column systems.
4. Detector responds to concentration of polymer
molecules eluting from the GPC columns (i.e.,
Concentration detectors: UV, IR etc. and
Molecular weight sensitive detectors: Viscometry, Light
scattering
3. GPC is based on the behaviour of polymer molecules in solution
In the solid state polymers can be considered like spaghetti – a confusing mass of
intertwined chains.
In solution, polymer molecules are discrete entities.
Due to entropic effects the most rigid of polymer chains curls up in solution to form a
ball like shape.
GPC columns are packed with cross-linked,
insoluble beads, typically co-polymers of styrene and
divinyl benzene for organic GPC. These beads are
low swelling product with a well-defined pore
structure in the presence of solvent.
4. Polymer coils in solution can
permeate into the pores on GPC
packing materials.
Exclusion, partial permeation
and total permeation are possible.
5. Polymer is prepared as a dilute solution in the
eluent and injected into the system
The GPC column is packed with porous
beads of controlled porosity and particle size
Large molecules are not able to permeate all
of the pores and have a shorter residence
time in the column
Small molecules permeate deep into the
porous matrix and have a long residence time
in the column
Polymer molecules are separated according
to molecular size, eluting largest first,
smallest last. The separation is purely a
physical partitioning, there is no interaction or
binding.
The calibration curve describes how different
size molecules elute from the column
6. Intensity or signal hi is proportional
to the concentration ci of polymer in
the aliquot of volume ΔV.
ci = Ni Mi / ΔV
wi = hi / Ʃhi (mass fraction)
The elution (retention) volume ΔVi
is related to the molecular mass Mi.
ΔV= ΔV(i+1) - ΔVi
.
7. Exclusion volume (Vo) - Upper MW limit (also known as void volume)
Total permeation volume (Vt) – Lower MW limit
Ve - elution volume for given size
V0 - interstitial volume (between particles
of column packing)
Vt - total available volume of column
(interstitial and pore volumes)
Kd - partition coefficient 0 Kd 1
solute excluded
solute permeated
)
( 0
0 V
V
K
V
V t
d
e
8. sign
al
elution volume
detector
sign
al
elution volume
sign
al
elution volume
detector
elution volume
log
M
calibration curve
elution volume
log
M
elution volume
log
M
calibration curve molecular weight distribution
log M
signal
separation
exclusion
permeation
• Several types of calibration
1. Narrow distributed standards of the same polymer
1.1
2. Universal calibration
[]1 M1 = []2 M2 ~ size of coil ~ Velution (Benoit et al, 1966)
note: a) Mark-Houwink equations is related to MW range
b) careful in low MW range where a ~ 0.5 [J.Polym.Sci. 6, 1759 (1968)]
3. Absolute molecular weight detectors (LS, viscosity)
4. Effective calibration (no match between standards and analyzed
polymer)
9.
10. Chromatograph a series of well characterised, narrow
polydispersity polymer standards
Plot peak retention time (RT) versus peak log
molecular weight (logM)
Most commonly used polymer calibrants
Polystyrene - THF, toluene, chloroform, TCB
Polymethyl methacrylate - MEK, ethyl acetate, acetone,
DMF
Polyethylene oxide/glycol - aqueous eluents, DMF, DMSO
11. Calibration curve:
•Polymers having the same hydrodynamic
volume i.e. [η] M, elute at the same time
(or same elution volume)
• It will be a perfectly linear calibration chart
for MW from 0 to 100,000,000. However, it
curves up at high MW because all of the
large polymers are excluded from the
pores and curves down at low MW
because to all of the small molecules.
•Need to do a calibration curve for each
polymer/solvent combination
•Gives Polystyrene (or Poly(vinyl alcohol))
Equivalent MWs
Universal calibration curve
All or almost all polymers fit on the
same curve.
12. There are few well characterised polymer standards for GPC calibration. Therefore
“unknown” polymer molecular weight can be derived from a GPC calibration curve
obtained using polymer standards and applying the following theory:
Molecular size = hydrodynamic volume (HV)
HV = M [n], where M is molecular weight and [n] is intrinsic viscosity
In GPC molecules with the same HV elute at the same retention time
Therefore for different polymer types M1 [n]1=M2 [n]2
For a given polymer system Mark-Houwink equation applies : [n] = K M
Rearranging these relationships
logM2 = log(K1/K2) + (1+ 1) logM1
(1+ 2) (1+ 2)
where K1, 1 for polymer standards and K2, 2 for polymer under investigation are
known
13. Interpreting Chromatograms
The data obtained in a GPC experiment will be in the form of a
chromatogram showing detector response as a function of retention time
There are fundamental parameters that are present on all chromatograms
15. Peak separation in GPC is dependent upon resolution and on molecular size
If two samples have different molecular sizes, then they will be separated to
baseline assuming there is sufficient resolution
However, if samples are the same molecular size, then they cannot be
separated by GPC as the mechanism of SEC is based upon size
Peak Separation
16.
17. Atomic Force Microscope (AFM)
Atomic force microscopy (AFM) was developed to investigate the electrically
non-conductive materials, like proteins.
•AFM is very useful to image polymers and enables examination of even single
polymer molecules, suitable for polymers, polymer blends, polymer composites.
•Used to establish structure-property relationships.
•Lateral resolution is ~10nm.
•Information obtained includes morphology, dispersion, domain size, internal
structure .
•Phase imaging is excellent method for contrast where contrast is based on
material/mechanical properties such as stiffness and adhesion.
Block copolymer Polymer blend
18. Analysis and Testing of Polymers
The technique
A schematic representation of the basic AFM setup is shown. Using atomic force microscopy
(AFM), a tip attached to a flexible cantilever will move across the sample surface to measure
the surface morphology on the atomic scale. The forces between the tip and the sample are
measured during scanning, by monitoring the deflection of the cantilever. This force is a
function of tip sample separation and the material properties of the tip and the sample.
19. Analysis and Testing of Polymers
Force between the sample and the tip
For a quantitative analysis of the interaction between the tip and the substrate all the
contributing forces will take into account. The forces between the tip and the substrate have
short- and long-range contributions. When measurements are performed, it is crucial to
separate the contributions of various forces and eliminate the undesired ones. This ensures the
measurement of desired sample properties only and makes further quantitative analysis
possible.
•In vacuum, chemical forces of very short range (less than 1 nm), electrostatic, magnetic and
Van der Waals forces can be determined
•While in air forces with longer range (up to100 nm) make the measurements mostly
qualitative.
•At room conditions water moisture can condense on the tip, which is a source of capillary
force. Capillary forces are relatively big and can cover the contributions of other forces;
therefore they have to be avoided if possible. The latter is possible by measuring in
special, water free conditions, like in a N2 or Ar atmosphere or in liquid environments.
20. Analysis and Testing of Polymers
AFM modes
1. Contact mode
Contact mode was the first developed mode of atomic force microscopy. In this mode, the tip is
Moving across the surface and deflects according to its profile. Two types of contact mode
measurements are known, the constant force and the constant height mode.
In the constant force type, a feedback loop is used to move the sample or the tip up and down
and keep its deflection constant. The value of z-movement is equal to the height changes of the
sample’s surface. The result of such measurement is the information about the
surfacetopography.
At the constant height, while the forces are changing, the cantilever deflection is measured
directly and the deflection force on the tip is used to calculate the distance from the surface.
Since no feedback loop is required for this type of measurement, it is appropriate for quick
scans of samples with small height differences (if height differences are big, the tip will very
likely crash into the surface, by which it gets destroyed or damages the samples’ surface). With
this type of measurements atomic resolution was achieved at low temperatures and in high
vacuum. Such measurements are often used for quick examination of fast changes in
biological structures.
21. Analysis and Testing of Polymers
2. Noncontact mode
In noncontact mode, the sample’s surface is
investigated using big spring constant
cantilevers. The tip attached to the cantilever
is hovering very close to the surface (at a
distance of approximately 5-10 nm), but never
gets into contact with it, hence the name
noncontact mode.
A major advantage of this mode is negligible
friction forces, making this mode capable for
measurements of biological and polymeric
samples without alteration of their surface.
The biggest drawbacks of this mode are low
lateral and z-resolution when compared to the
contact mode. Recently it was used for
characterization of single polymer chains.
22. Analysis and Testing of Polymers
3.Amplitude, modulation mode or dynamic
force mode
This mode is often called the intermittent-
contact or tapping mode and it eliminates
major weaknesses of the noncontact mode
(such as the low lateral and z-resolution).
Instead of hovering above the sample, the
cantilever vibrates above the surface and
moves through the force gradient above the
surface, during which it might momentarily
touch the surface.
Due to interactions of the AFM tip with the
sample surface, the amplitude of vibrations
decreases and a phase shift occurs. Amplitude
or phase shift either of these parameters
can choose and keep it constant through the
feedback loop by moving either the sample or
the tip in z-direction. This gives us information
about the surface topography similar to the
contact mode.
23. Analysis and Testing of Polymers
Sample Preparation
AFM imaging requires flat surfaces for imaging. However, polymer samples may require
additional sample preparation beyond this. If there is a sample with a "skin", or a sample
that has been processed and only the inner bulk material needs to be imaged, it will need to be
cryomicrotomed for AFM imaging. Cryomicrotoming is a process by which a very smooth surface
is cut and prepared at cold temperatures on a cryomicrotome. Many samples such as thin films
or coated films can be imaged as it is without this preparation.
Atomically flat surfaces are free of surface roughness and proper choice of an inert material for
their preparation makes it possible to gather reliable high resolution data after desired sample
attachment. Prior to any preparation steps, all used laboratory accessories were cleaned in a
multi-step procedure, combining different chemicals, to assure extreme cleanliness. In the next
step, high-grade mica was coated with gold of high purity. A two stage heating/annealing step
was introduced afterwards, which yielded atomically flat gold terraces of sizes in the range from
a couple hundred nm to 2 microns.
24. Analysis and Testing of Polymers
Tip functionalization
Mapping chemical functional groups and examining their interactions with different materials is
of significant importance for problems ranging from lubrication and adhesion, to the recognition
of biological systems, composites, and pharmacy. At the moment, one of the most promising
AFM related techniques for polymer examination is surely the chemical force microscopy (CFM).
CFM enables the measurement of interactions appearing between polymer molecules or
polymers, and different surfaces. A CFM experiment has to be conducted with specially
designed tips, which for themselves act as chemical sensors. Success of such measurements is
impossible without proper tips, so choosing the right ones is crucial in this regard.