2017 Trends in Moving - MyMovingReviews Annual data Report
•Als PPTX, PDF herunterladen•
2 gefällt mir•3,404 views

As the 6th edition of our annual moving industry trends infographic, we present to you the household moving stats for 2017. Find out interesting moving trends and statistics for 2017. Did you know that more than 60% of all moves happen during the spring? Or that 27% of all moves in 2017 were one-bedroom households? Curious to learn more? You will also read about average prices per route, top net inbound and outbound states and more home moving stats. Enjoy our 2017 moving stats and feel free to use them in your next piece!
Melden
Teilen
Melden
Teilen

Empfohlen
Empfohlen
Saudi Arabia [ Abortion pills) Jeddah/riaydh/dammam/+966572737505☎️] cytotec tablets uses abortion pills 💊💊
How effective is the abortion pill? 💊💊 +966572737505) "Abortion pills in Jeddah" how to get cytotec tablets in Riyadh " Abortion pills in dammam*💊💊
The abortion pill is very effective. If you’re taking mifepristone and misoprostol, it depends on how far along the pregnancy is, and how many doses of medicine you take:💊💊 +966572737505) how to buy cytotec pills
At 8 weeks pregnant or less, it works about 94-98% of the time. +966572737505[ 💊💊💊
At 8-9 weeks pregnant, it works about 94-96% of the time. +966572737505)
At 9-10 weeks pregnant, it works about 91-93% of the time. +966572737505)💊💊
If you take an extra dose of misoprostol, it works about 99% of the time.
At 10-11 weeks pregnant, it works about 87% of the time. +966572737505)
If you take an extra dose of misoprostol, it works about 98% of the time.
In general, taking both mifepristone and+966572737505 misoprostol works a bit better than taking misoprostol only.
+966572737505
Taking misoprostol alone works to end the+966572737505 pregnancy about 85-95% of the time — depending on how far along the+966572737505 pregnancy is and how you take the medicine.
+966572737505
The abortion pill usually works, but if it doesn’t, you can take more medicine or have an in-clinic abortion.
+966572737505
When can I take the abortion pill?+966572737505
In general, you can have a medication abortion up to 77 days (11 weeks)+966572737505 after the first day of your last period. If it’s been 78 days or more since the first day of your last+966572737505 period, you can have an in-clinic abortion to end your pregnancy.+966572737505
Why do people choose the abortion pill?
Which kind of abortion you choose all depends on your personal+966572737505 preference and situation. With+966572737505 medication+966572737505 abortion, some people like that you don’t need to have a procedure in a doctor’s office. You can have your medication abortion on your own+966572737505 schedule, at home or in another comfortable place that you choose.+966572737505 You get to decide who you want to be with during your abortion, or you can go it alone. Because+966572737505 medication abortion is similar to a miscarriage, many people feel like it’s more “natural” and less invasive. And some+966572737505 people may not have an in-clinic abortion provider close by, so abortion pills are more available to+966572737505 them.
+966572737505
Your doctor, nurse, or health center staff can help you decide which kind of abortion is best for you.
+966572737505
More questions from patients:
Saudi Arabia+966572737505
CYTOTEC Misoprostol Tablets. Misoprostol is a medication that can prevent stomach ulcers if you also take NSAID medications. It reduces the amount of acid in your stomach, which protects your stomach lining. The brand name of this medication is Cytotec®.+966573737505)
Unwanted Kit is a combination of two medicinAbortion pills in Jeddah | +966572737505 | Get Cytotec
Abortion pills in Jeddah | +966572737505 | Get CytotecAbortion pills in Riyadh +966572737505 get cytotec
Weitere ähnliche Inhalte
Kürzlich hochgeladen
Saudi Arabia [ Abortion pills) Jeddah/riaydh/dammam/+966572737505☎️] cytotec tablets uses abortion pills 💊💊
How effective is the abortion pill? 💊💊 +966572737505) "Abortion pills in Jeddah" how to get cytotec tablets in Riyadh " Abortion pills in dammam*💊💊
The abortion pill is very effective. If you’re taking mifepristone and misoprostol, it depends on how far along the pregnancy is, and how many doses of medicine you take:💊💊 +966572737505) how to buy cytotec pills
At 8 weeks pregnant or less, it works about 94-98% of the time. +966572737505[ 💊💊💊
At 8-9 weeks pregnant, it works about 94-96% of the time. +966572737505)
At 9-10 weeks pregnant, it works about 91-93% of the time. +966572737505)💊💊
If you take an extra dose of misoprostol, it works about 99% of the time.
At 10-11 weeks pregnant, it works about 87% of the time. +966572737505)
If you take an extra dose of misoprostol, it works about 98% of the time.
In general, taking both mifepristone and+966572737505 misoprostol works a bit better than taking misoprostol only.
+966572737505
Taking misoprostol alone works to end the+966572737505 pregnancy about 85-95% of the time — depending on how far along the+966572737505 pregnancy is and how you take the medicine.
+966572737505
The abortion pill usually works, but if it doesn’t, you can take more medicine or have an in-clinic abortion.
+966572737505
When can I take the abortion pill?+966572737505
In general, you can have a medication abortion up to 77 days (11 weeks)+966572737505 after the first day of your last period. If it’s been 78 days or more since the first day of your last+966572737505 period, you can have an in-clinic abortion to end your pregnancy.+966572737505
Why do people choose the abortion pill?
Which kind of abortion you choose all depends on your personal+966572737505 preference and situation. With+966572737505 medication+966572737505 abortion, some people like that you don’t need to have a procedure in a doctor’s office. You can have your medication abortion on your own+966572737505 schedule, at home or in another comfortable place that you choose.+966572737505 You get to decide who you want to be with during your abortion, or you can go it alone. Because+966572737505 medication abortion is similar to a miscarriage, many people feel like it’s more “natural” and less invasive. And some+966572737505 people may not have an in-clinic abortion provider close by, so abortion pills are more available to+966572737505 them.
+966572737505
Your doctor, nurse, or health center staff can help you decide which kind of abortion is best for you.
+966572737505
More questions from patients:
Saudi Arabia+966572737505
CYTOTEC Misoprostol Tablets. Misoprostol is a medication that can prevent stomach ulcers if you also take NSAID medications. It reduces the amount of acid in your stomach, which protects your stomach lining. The brand name of this medication is Cytotec®.+966573737505)
Unwanted Kit is a combination of two medicinAbortion pills in Jeddah | +966572737505 | Get Cytotec
Abortion pills in Jeddah | +966572737505 | Get CytotecAbortion pills in Riyadh +966572737505 get cytotec
Kürzlich hochgeladen (20)
Top profile Call Girls In Chandrapur [ 7014168258 ] Call Me For Genuine Model...
Top profile Call Girls In Chandrapur [ 7014168258 ] Call Me For Genuine Model...
Top profile Call Girls In Hapur [ 7014168258 ] Call Me For Genuine Models We ...
Top profile Call Girls In Hapur [ 7014168258 ] Call Me For Genuine Models We ...
Top profile Call Girls In Satna [ 7014168258 ] Call Me For Genuine Models We ...
Top profile Call Girls In Satna [ 7014168258 ] Call Me For Genuine Models We ...
Top profile Call Girls In bhavnagar [ 7014168258 ] Call Me For Genuine Models...
Top profile Call Girls In bhavnagar [ 7014168258 ] Call Me For Genuine Models...
Top profile Call Girls In Bihar Sharif [ 7014168258 ] Call Me For Genuine Mod...
Top profile Call Girls In Bihar Sharif [ 7014168258 ] Call Me For Genuine Mod...
5CL-ADBA,5cladba, Chinese supplier, safety is guaranteed
5CL-ADBA,5cladba, Chinese supplier, safety is guaranteed
Abortion pills in Jeddah | +966572737505 | Get Cytotec
Abortion pills in Jeddah | +966572737505 | Get Cytotec
Top profile Call Girls In Purnia [ 7014168258 ] Call Me For Genuine Models We...
Top profile Call Girls In Purnia [ 7014168258 ] Call Me For Genuine Models We...
Jual Obat Aborsi Surabaya ( Asli No.1 ) 085657271886 Obat Penggugur Kandungan...
Jual Obat Aborsi Surabaya ( Asli No.1 ) 085657271886 Obat Penggugur Kandungan...
Empfohlen
More than Just Lines on a Map: Best Practices for U.S Bike Routes
This session highlights best practices and lessons learned for U.S. Bike Route System designation, as well as how and why these routes should be integrated into bicycle planning at the local and regional level.
Presenters:
Presenter: Kevin Luecke Toole Design Group
Co-Presenter: Virginia Sullivan Adventure Cycling AssociationMore than Just Lines on a Map: Best Practices for U.S Bike Routes
More than Just Lines on a Map: Best Practices for U.S Bike RoutesProject for Public Spaces & National Center for Biking and Walking
Empfohlen (20)
Content Methodology: A Best Practices Report (Webinar)
Content Methodology: A Best Practices Report (Webinar)
How to Prepare For a Successful Job Search for 2024
How to Prepare For a Successful Job Search for 2024
Social Media Marketing Trends 2024 // The Global Indie Insights
Social Media Marketing Trends 2024 // The Global Indie Insights
Trends In Paid Search: Navigating The Digital Landscape In 2024
Trends In Paid Search: Navigating The Digital Landscape In 2024
5 Public speaking tips from TED - Visualized summary
5 Public speaking tips from TED - Visualized summary
Google's Just Not That Into You: Understanding Core Updates & Search Intent
Google's Just Not That Into You: Understanding Core Updates & Search Intent
The six step guide to practical project management
The six step guide to practical project management
Beginners Guide to TikTok for Search - Rachel Pearson - We are Tilt __ Bright...
Beginners Guide to TikTok for Search - Rachel Pearson - We are Tilt __ Bright...
Unlocking the Power of ChatGPT and AI in Testing - A Real-World Look, present...
Unlocking the Power of ChatGPT and AI in Testing - A Real-World Look, present...
More than Just Lines on a Map: Best Practices for U.S Bike Routes
More than Just Lines on a Map: Best Practices for U.S Bike Routes
Ride the Storm: Navigating Through Unstable Periods / Katerina Rudko (Belka G...
Ride the Storm: Navigating Through Unstable Periods / Katerina Rudko (Belka G...
Hinweis der Redaktion
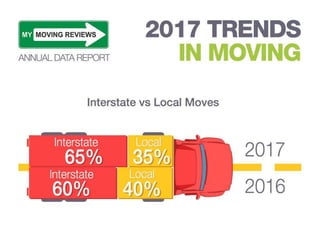
- In 2017 we are seeing an increase by 5% in the interstate moves, compared to 2016. Whereas the exact reasons behind those moves may be unclear, one thing we can say for sure - whether it is a new job or home, or family, Americans are not afraid to go the extra miles in pursuit of happiness.
- These have been the busiest routes in 2017 based on inquiries we have received from people looking for full service movers. The busiest moving route of 2017 is California - Texas.
- More than 60% of the moves happened during the spring, summer and until mid fall. Between spring and fall, it turns out that Americans prefer to postpone the move and wait for the fall season. June is the busiest month for moving, whereas December, January and February are slow.
- Most of the moves this year have been small moves, with 1-bedroom being the most common home size. It shouldn’t come as a surprise that Americans choose to move less of their furniture, because with brands like IKEA becoming more and more popular, it is not profitable to ship all of your furniture any more.
- Average price for a move with the longest route – from Florida to California is $4047. Based on the reviews we have received over the year, a move from New York to Florida and vice versa will be around $3500. It seems that the length of the route is a less determining factor as we see a higher average price for a shorter route – New Jersey to Florida - $3618. Same trend applies for the shortest route as well. The economic environment of the region can be a greater factor in pricing.
- Top net in-bound migration indicates that there are more people entering than leaving an area, while out-bound migration indicates the reverse trend. The state of Florida and the city of Denver, CO are the current leaders in positive net in-bound migration, as opposed to New York State with the first place in state net out-bound migration.
- Top net in-bound migration indicates that there are more people entering than leaving an area, while out-bound migration indicates the reverse trend. The state of Florida and the city of Denver, CO are the current leaders in positive net in-bound migration, as opposed to New York State with the first place in state net out-bound migration.
- It seems logical to start your move in Friday and utilize the weekend at its best. That is why we shouldn't be surprised that most of the moves have started on Friday. This day accounts for almost 20% of the moves in 2017.
- Data is based on quotes and reviews submitted to MyMovingReviews.com and its network. Sources: 118.611 quotes provided from www.MyMovingLoads.com 19.570 moving reviews submitted to www.MyMovingReviews.com