SlideShare a Scribd company logo
1 of 6
Download to read offline
Using Google Fusion Tables to make interactive maps

   1. Google Fusion Tables can work with tabular data (excel / csv files) as well as KML files. For
      this exercise we’ll use a KML file. If the KML file you wish to display in your map is in your
      Google Earth “My Places” folder, you may right-click on it and export it using “Save Place
      As…”.


   2. Now open a web browser and navigate to www.google.com/fusiontables. You will need to
      log in to Google using a gmail account or a google account. Click on “Create a new table” and
      this dialog box will appear:
3. Click “Choose File” and select the KML file. Then click “Next>>”. Depending on the size of
   your file, this might take a few minutes. Once the file has loaded, you can check the few
   rows to make sure things look right.


4. Click “Next>>” to name the file or change some of the default settings, and click “Finish”.
   The next screen will display a table of all the features in your KML file.


5. If you click on “Map of Geography” the KML file will display on a google map.
6. You may check to see how attribute data are interactively displayed by clicking on any of the
   features.


7. You may change the map’s symbology by clicking “Tools”  “Change map styles…”. You may
   also change the layout of the dialog boxes that appear when a user clicks on features in the
   “Tools”  “Change info window layout…” box.
8. You may view your edits:


9. If you are satisfied with how the map looks and functions, may prepare it for publishing by
   making it public. Click on the blue “Share” button. Click “Change…” next to the “Private…”
   row, and set to “Public on the web”. Then click “Save”.
10. Now you may export the map by clicking “Tools”  “Publish”. Then copy the code below
    “Paste HTML to embed…”.


11. This next step requires that you have administrative access to a website. If you don’t, a good
    option is to set up a google “sites” website. Using an html editor, paste the code you copied
    in the previous step into the editing frame.
12. You map will appear, embedded in the web page. It also has the interactive functionality you
    gave it in steps 6 and 7.

More Related Content

More from International Centre for Integrated Mountain Development (ICIMOD)

More from International Centre for Integrated Mountain Development (ICIMOD) (7)

DYNAMICS OF APPLE ORCHARDS IN RESPONSE TO ENVIRONMENTAL CHANGE: A CASE STUDY ...
DYNAMICS OF APPLE ORCHARDS IN RESPONSE TO ENVIRONMENTAL CHANGE: A CASE STUDY ...DYNAMICS OF APPLE ORCHARDS IN RESPONSE TO ENVIRONMENTAL CHANGE: A CASE STUDY ...
DYNAMICS OF APPLE ORCHARDS IN RESPONSE TO ENVIRONMENTAL CHANGE: A CASE STUDY ...
 
Study of Tsho Rolpa Glacial Lake and Trakarding Glacier, Using Remote Sensing
Study of Tsho Rolpa Glacial Lake and Trakarding Glacier, Using Remote SensingStudy of Tsho Rolpa Glacial Lake and Trakarding Glacier, Using Remote Sensing
Study of Tsho Rolpa Glacial Lake and Trakarding Glacier, Using Remote Sensing
 
Climate change vulnerability in mountain agriculture
Climate change vulnerability in mountain agricultureClimate change vulnerability in mountain agriculture
Climate change vulnerability in mountain agriculture
 
Assessing the Effect of Climate Change on Frequency of Flood Events in Koshi ...
Assessing the Effect of Climate Change on Frequency of Flood Events in Koshi ...Assessing the Effect of Climate Change on Frequency of Flood Events in Koshi ...
Assessing the Effect of Climate Change on Frequency of Flood Events in Koshi ...
 
GLACIER RESPONSE TO CLIMATE CHANGE IN WESTERN AND NEPAL HIMALAYAS
GLACIER RESPONSE TO CLIMATE CHANGE IN WESTERN AND NEPAL HIMALAYASGLACIER RESPONSE TO CLIMATE CHANGE IN WESTERN AND NEPAL HIMALAYAS
GLACIER RESPONSE TO CLIMATE CHANGE IN WESTERN AND NEPAL HIMALAYAS
 
Women Health, Vulnerability and Adaptation to Climate Change: A Study of The ...
Women Health, Vulnerability and Adaptation to Climate Change: A Study of The ...Women Health, Vulnerability and Adaptation to Climate Change: A Study of The ...
Women Health, Vulnerability and Adaptation to Climate Change: A Study of The ...
 
Climate Change Science in the Hindu-Kush-Himalayas-Tibet
Climate Change Science in the Hindu-Kush-Himalayas-TibetClimate Change Science in the Hindu-Kush-Himalayas-Tibet
Climate Change Science in the Hindu-Kush-Himalayas-Tibet
 

High res using google fusion tables to make interactive maps

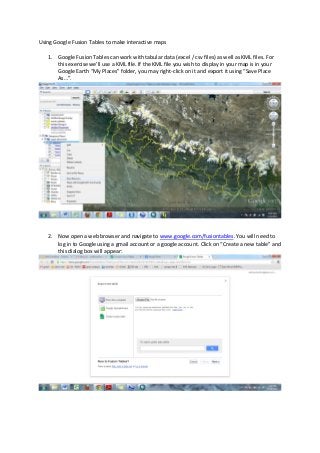
  • 1. Using Google Fusion Tables to make interactive maps 1. Google Fusion Tables can work with tabular data (excel / csv files) as well as KML files. For this exercise we’ll use a KML file. If the KML file you wish to display in your map is in your Google Earth “My Places” folder, you may right-click on it and export it using “Save Place As…”. 2. Now open a web browser and navigate to www.google.com/fusiontables. You will need to log in to Google using a gmail account or a google account. Click on “Create a new table” and this dialog box will appear:
  • 2. 3. Click “Choose File” and select the KML file. Then click “Next>>”. Depending on the size of your file, this might take a few minutes. Once the file has loaded, you can check the few rows to make sure things look right. 4. Click “Next>>” to name the file or change some of the default settings, and click “Finish”. The next screen will display a table of all the features in your KML file. 5. If you click on “Map of Geography” the KML file will display on a google map.
  • 3. 6. You may check to see how attribute data are interactively displayed by clicking on any of the features. 7. You may change the map’s symbology by clicking “Tools”  “Change map styles…”. You may also change the layout of the dialog boxes that appear when a user clicks on features in the “Tools”  “Change info window layout…” box.
  • 4. 8. You may view your edits: 9. If you are satisfied with how the map looks and functions, may prepare it for publishing by making it public. Click on the blue “Share” button. Click “Change…” next to the “Private…” row, and set to “Public on the web”. Then click “Save”.
  • 5. 10. Now you may export the map by clicking “Tools”  “Publish”. Then copy the code below “Paste HTML to embed…”. 11. This next step requires that you have administrative access to a website. If you don’t, a good option is to set up a google “sites” website. Using an html editor, paste the code you copied in the previous step into the editing frame.
  • 6. 12. You map will appear, embedded in the web page. It also has the interactive functionality you gave it in steps 6 and 7.