Chapter 26 battery sizing and discharge analysis norestriction
•Download as PPT, PDF•
0 likes•1,754 views

etap elearning

Recommended
Recommended
More Related Content
What's hot
What's hot (20)
Viewers also liked
Viewers also liked (15)
Similar to Chapter 26 battery sizing and discharge analysis norestriction
Similar to Chapter 26 battery sizing and discharge analysis norestriction (20)
Recently uploaded
Recently uploaded (20)
Chapter 26 battery sizing and discharge analysis norestriction
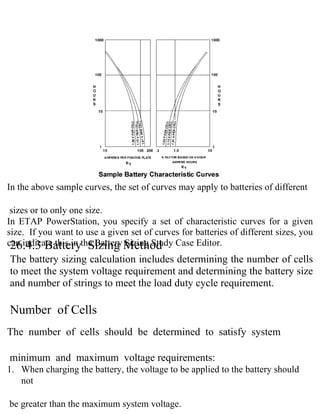
- 1. In the above sample curves, the set of curves may apply to batteries of different sizes or to only one size. In ETAP PowerStation, you specify a set of characteristic curves for a given size. If you want to use a given set of curves for batteries of different sizes, you can indicate this in the Battery Method Case Editor. 26.4.3 Battery Sizing Sizing Study The battery sizing calculation includes determining the number of cells to meet the system voltage requirement and determining the battery size and number of strings to meet the load duty cycle requirement. Number of Cells The number of cells should be determined to satisfy system minimum and maximum voltage requirements: 1. When charging the battery, the voltage to be applied to the battery should not be greater than the maximum system voltage.
- 2. Let N be the number of cells. The voltage requirements can be given in the following equation V sys, ≤N≤ V sys, V mincell, V cell, max disch ch Where Vsys,min is the minimum system voltage that is equal to the nominal voltage of the battery terminal bus multiplied by the minimum system voltage deviation Vsys,max is the maximum system voltage that is equal to the nominal voltage of the entered in the Battery Sizing Study Case Editor. battery terminal bus multiplied by the maximum system voltage deviation Vcell,disch is the battery discharge voltage in V/Cell entered in the Battery Sizing Study Case Editor. entered in the Battery Sizing Study Case Editor. It is clear that the number of cells of the battery is dependent on the four values for voltage requirement entered in the Battery Sizing Study Case Editor. It can happen that for some incompatible values, we cannot determine a value for N to satisfy the above equation. When this situation occurs, ETAP will display a message indicating that it cannot determine the number of cells. In practical cases, there is often a range of values that N can take to satisfy the above equation. In this case, ETAP will select the value for N that results in the battery rated voltage being closest to its terminal bus nominal voltage.
- 3. Cell Size In determining the battery size, ETAP will find the smallest size that can provide sufficient power for the specified duty cycle. The capacity of a battery can be increased either by using a larger size or by adding more strings. Since ETAP allows you to enter different characteristic curves for different sizes of batteries, in the battery sizing calculation, the program starts with one string and the smallest size available for the calculation. If it fails to meet the load requirement, the program first increases the size and performs calculations with the characteristic curves for the new size. When no available sizes can meet the load requirement for the given number of strings, it then increases the string number and performs the calculation with the smallest size again. This process continues until a battery size and a string number are found to meet the load requirement. Load Sections in Battery Duty Cycle A battery duty cycle generally can be represented as a square waveform. It consists of a number of time periods, with a constant current value during a period. The figure below shows a sample duty i S i a= ∑ It P j cycle for battery.1 consists of six periods, designated as P1, P2, j= … P6. A load section Si is a combination of a number of load periods, defined as:
- 4. In the sample duty cycle there are six load sections. Load Sections for A Sample Battery Duty Cycle Determination of Cell Size Based on Battery Characteristic Curves Based on a given set of battery characteristic curves, we can determine the required battery size for a specified duty cycle. Let F represent cell size. It is F= Max Fi i=1,..Sm equal to: where Sm is the total number of load sections and Fi is the size calculated for the ith load section. The calculation of Fi depends on the where Ap is the load current value in period P. RT is the value obtained from the type of characteristic curve, which is the number of amperes that each positive battery battery library curves.
- 5. Random Load and Non-Random Load In general, the duty cycle for a battery consists of random loads and non-random loads. The program determines the cells for random and non-random loads separately in the same way as described in the previous section. The sum of the two cell size values is the uncorrected cell size for the given duty cycle. Adjusting Factors In the Battery Sizing Study Case Editor, you can select several adjusting factors to be considered in calculating battery size. These factors include temperature factor, design margin factor, aging Calculation Cycle It is clear from the equations for determining cell size that the cell size is calculated based on a given set of battery characteristic curves, which is for a given cell size. If the calculated cell size is different from the one corresponding to the characteristic curves used. We have to do the calculation
- 6. 26.4.4 Battery Discharging Calculation Method The purpose of battery discharge calculation is to determine battery performance for a specified duty cycle. One of the key parameters for battery performance is the battery terminal voltage. When the battery is supplying the load as the sole source, it should be able to maintain voltage level for the whole period of the specified duty cycle. Battery Characteristic Curves for Voltage Interpolation The terminal voltage of a battery is dependent on the current drawing from the battery and the ampere-hour capacity contained in the battery. This relationship is described by the battery characteristic curve and is very nonlinear. In ETAP, the battery characteristics are described in the battery library as discrete points. Because no closed form equation is available to describe the battery characteristics, numerical interpolation methods have to Battery Combined Duty Cycle be used to find the points missing in the curves. Apparently, the more curves When the load powered by the battery includes random load, the random load are entered in the battery library, the more accurate the calculated results will should be added to the non- random load at the worst point, which is the time the battery has the lowest be. voltage value when only the non-random load is considered. To identify this time moment, the program first performs battery discharge calculation excluding the random load. It then determine the worst point, add the random load to the non-random load and perform discharge calculation from the time when the random load takes effect all the way to the end of battery duty cycle.
- 7. Battery Voltage Calculation An iterative process is conducted to calculated battery discharge voltage values. A battery voltage value is reported at each time step specified in the battery sizing study case and at each moment when there is a change in the load duty cycle. By changing the step size from the battery sizing study case, the user can adjust the level of detail information on discharge calculation to be reported. If the battery duty cycle is calculated by the load current summation method, the battery current will change only when there is a change in any load duty cycle. When the load flow method is selected in the study case, even if there is no change in the load duty cycle, the battery current will change due to decrease in the battery voltage. In this case the battery current is calculated by a full load flow calculation, considering different types of loads and system losses. In this load flow calculation, the battery is modeled as a constant voltage source with the voltage calculated in the previous step. The calculated battery current will be used in the current step for battery voltage calculation. Along with battery voltage and current, the battery discharge program also calculates battery discharge capacity. When there is change in the load current, two values of voltage When the battery is calculated using load flow method, the battery and current are calculated, at t – discharge calculation also provides a and t+, one for before the load change and one for after the load change.
- 8. 26.5Required Data 26.5.1 Source In battery sizing calculation, the only source is the battery to be sized. Batteries may only besized/discharged one at a time as specified in the study case. A UPS may be considered as a load to the Battery system when its input bus is not connected to an energized bus. •ID •Bus connection data •Battery library type data. This information is used to retrieve library data for calculations. If only the battery discharge calculation is conducted, the following additional information is also •Battery number of plates and Capacity. required: •Number of cells •Number of Strings •SC page battery external resistance.
- 9. 26.5.2 Load UPS When a UPS is not connected to an energized input AC bus, it is considered a load in battery sizing calculations. •ID •Bus connection data •DC rated voltage kW and kVA. Duty Cycle Page •If no duty cycle data is entered, this load will be assumed to be zero. DC Motor •ID •Bus connection data •Quantity •Rated voltage •kW or HP and Efficiency. Duty Cycle Page
- 10. Lumped Load •ID •Bus connection data •Rated voltage kW Rating •Duty Cycle Page •If no duty cycle data is entered, this load will be assumed to be zero. Static Load •ID •Bus connection data kW Rating. •Rated voltage •Duty Cycle Page •If no duty cycle data is entered, this load will be assumed to be zero. Elementary Diagram (ED) Load •ID •Bus connection data •Rated voltage kW Rating. •Duty Cycle Page •If no duty cycle data is entered, this load will be assumed to be zero.
- 11. Inverter •ID •Bus connection data •DC rated voltage •kVA, PF, DC kW rating •Duty Cycle Page •If no duty cycle data is entered, this load will be assumed to be zero. 26.5.3 Branch DC Cable •ID •Bus connection data •Cable length •Resistance and Inductance and cable length units DC Impedance •ID •Bus connection data •Resistance and inductance impedance information.
- 12. Tie PD (CB, Fuse, & Single-Throw & Double-ThrowSwitches) •ID •Bus connection data DC Converter •ID •Bus connection data •kW Rating and Rated kV Input and output. Library •Library type data •Battery characteristic curve data Study Case When you initiate a battery sizing calculation, PowerStation uses the study case currently selected from the Study Case Toolbar. Every field in the Study Case Editor is set to its default value. However, it is important to set the values in the study case correctly to meet your calculation requirements.
- 13. The battery sizing calculation results are reported graphically on the one-line diagram, in plots and in the Crystal Reports format. The graphical one-line display shows the number of cells, number of strings, cell size, etc. You can use the Display Options Editor to specify the content to be displayed. 26.6 Output Reports The Crystal Reports format provides you with detailed information for a battery sizing study. You can utilize the Battery Sizing Report Manager to help you view the output 26.6.1 Battery Sizing Report Manager report. To open the Battery Sizing Report Manager, simply click on the View Output File button on the Battery Sizing Study Toolbar. The editor includes four pages (Complete, Input, Result, and Summary) representing different sections of the output report. The Report Manager allows you to select formats available for different portions of the report and view it via Crystal Reports. There are several fields and buttons common to every page, as described below.
- 14. Output Report Name This field displaysName to the output report you want to view. Project File the name This field displays the name of the project file based on which report was Help generated, along with the directory where the project file is located. Click on this button to access Help. OK / Cancel Click on the OK button to dismiss the editor and bring up the Crystal Reports view to show the selected portion of the output report. If no selection is made, it will simply dismiss the editor. Click on the Cancel Complete Report Page button to dismiss the editor without viewing the report. In this page there is only one format available, Complete, which brings up the complete report for the battery sizing study. The complete report includes input data, results, and summary reports.
- 15. Input Page This page allows you to select formats to view different input data, grouped according to type. They include the following available formats: •Battery Characteristics •Branch Connection •Bus and Connected Load •Cable •Cover •DC Converter Impedance Inverter •Load Duty Cycle •UPS
- 16. Result Page This page allows you to select formats to view the result portion of the output report, including Calculation Results, Battery Load Profile, and Battery Characteristics. The Calculation Results portion prints the uncorrected cell size for each load section in non-random load and random load. The Battery Load Profile is the battery duty cycle generated based on load duty cycles. The Battery Characteristic s are mostly data entered by the user