SlideShare ist ein Scribd-Unternehmen logo
1 von 1
ASSESSING THE DEMOGRAPHIC CHARACTERISTICS AND ADVERSE HEALTH OUTCOMES
OF DIABETIC PATIENTS AT NJMS - UNIVERSITY HOSPITAL THROUGH A GIS MAP
Monishka Pierre
Jeannie Garmon, MPH; Iris Herrera, MD, Assistant Professor and Medical Director of University Hospital Primary Care Clinic
Background
•Create a GIS map with data from the UH Diabetes
Registry to identify areas with clusters of patients who
exhibit comorbidities of six clinical variables
•Understand how neighborhood residential patterns
play a vital role in the accessibility and affordability of
health-related resources
•Identify associations and research questions for future
investigation
•To identify concentrations of addresses within minority
zip codes, potential health disparity zones, for
targeting disease prevention and management
interventions
Statistics are for 2000-2004, age-adjusted to the 2000 U.S. standard million population, and represent the number of new cases of invasive cancer and deaths per year per 100,000 women.*Statistics are for 2000-2004, age-adjusted to the 2000 U.S. standard million population, and represent the number of new cases of invasive cancer and deaths per year per 100,000 women.*Statistics are for 2000-2004, age-adjusted to the 2000 U.S. standard million population, and represent the number of new cases of invasive cancer and deaths per year per 100,000 women.*Statistics are for 2000-2004, age-adjusted to the 2000 U.S. standard million population, and represent the number of new cases of invasive cancer and deaths per year per 100,000 women.*Statistics are for 2000-2004, age-adjusted to the 2000 U.S. standard million population, and represent the number of new cases of invasive cancer and deaths per year per 100,000 women.*Statistics are for 2000-2004, age-adjusted to the 2000 U.S. standard million population, and represent the number of new cases of invasive cancer and deaths per year per 100,000 women.*Statistics are for 2000-2004, age-adjusted to the 2000 U.S. standard million population, and represent the number of new cases of invasive cancer and deaths per year per 100,000 women.*
•Black and Hispanic populations are more likely to live
in neighborhoods characterized by poverty and limited
access to physical activity, healthy food, safety, and
educational resources1
•Residents of socioeconomically deprived
neighborhoods are more likely to engage in high-risk
health behaviors and have poorer health outcomes
•NJ overall prevalence of diabetes is 6.5%2, with non-
Hispanic Blacks and Hispanics at 11.8% and 6.6%,3
respectively; at University Hospital (UH) the prevalence
is 16%4
•Geographic Information System (GIS) maps help
elucidate the complex interrelationships between
neighborhood resources and residents
•Understanding neighborhood/street level factors
affecting Diabetic patients will be beneficial in
developing effective public health programs and policies
_____________________________________________________________________________________________________________________________________________
1.Kershaw, K. N., & Albrecht, S. S. (2015). Racial/ethnic residential
segregation and cardiovascular disease risk. Current cardiovascular risk reports, 9(3), 1-12.
2.The Burden of Diabetes in New Jersey: A Surveillance Report. Healthy NJ. October 2010.
www.healthynj.org/dis-con/diabetes/nj.html. Last accessed January 14, 2010.
3.National Diabetes Statistics 2007. http://diabetes.niddk.nih.gov/dm/pubs/statistics/#race. Last
accessed January 14, 2010.
4.Herrera,I. (2012). Reducing Cardiovascular Risk in Latinos by reducing key CVD risk factors with
a focus on diabetes education. American Heart Association Grant Proposal.
•Original data set was a de-identified list of 6,477 diagnosed
diabetic patients in the UH system
•After removal of invalid addresses, final data set included 6,422
patients and 9 variables of interest: 3 demographic: address, age,
gender; 6 clinical: BMI, LDL, Blood Pressure, HbA1C test,
smoking history, and comorbid coronary artery disease
•Variables were classified and coded based on standard diagnosis
criteria (e.g. male,16 years old, BMI =35, BMI Code: OB (Obese)
•Addresses were geocoded into latitude and longitude by using
batch geocoder software, then randomly checked for accuracy
•Geographic distribution of variables of interest were examined
individually and in combinations to identify “hot spots”
•Google Earth was used to view neighborhood/street level
demographics
•Analysis was done down to the zip code level to assess for
possible associations of adverse health outcomes with immediate
surroundings
•Tableau Public was the primary GIS mapping software used for
all images
.
•No area was found with a cluster of patients exhibiting
comorbidities of all 6 clinical variables
•Areas were found with clusters of patients exhibiting a
single comorbidity
•Public Health programs may be considered for the 10
minority zip codes with large clusters of diabetic patients
•Further investigation of demographic and neighborhood
level data is required
•Most addresses were located in Essex and Hudson County.
Closer analysis revealed that the majority of patients (74.6%)
lived in Essex County; Newark, Irvington, and East Orange
•Possible inaccuracies in geocoding due to inability to
validate all addresses
• Difficult to explore city and neighborhood level
demographics because of inability to set county as basemap
•Limited availability of demographic variables on diabetes
registry
Objectives/Goals
Methods
Results
Limitations
Conclusion

Weitere ähnliche Inhalte

Was ist angesagt?

presentation on mortality and morbidity rate.
presentation on mortality and morbidity rate.presentation on mortality and morbidity rate.
presentation on mortality and morbidity rate.SonaliKatoch5
 
Medical and social problems of demographic processes
Medical and social problems of demographic processesMedical and social problems of demographic processes
Medical and social problems of demographic processesEneutron
 
Mortality and mobidity indicators
Mortality and mobidity indicatorsMortality and mobidity indicators
Mortality and mobidity indicatorsPriyamadhaba Behera
 
Measurement Epidemiology
Measurement EpidemiologyMeasurement Epidemiology
Measurement EpidemiologyKailash Nagar
 
2007 aids epidemic update
2007 aids epidemic update2007 aids epidemic update
2007 aids epidemic updatePim Piepers
 
Hsa 535 week 11 final exam part 2
Hsa 535 week 11 final exam part 2Hsa 535 week 11 final exam part 2
Hsa 535 week 11 final exam part 2adrienneagat2
 
Mortality measurement
Mortality measurementMortality measurement
Mortality measurementAbino David
 
Global Medical Cures™| New York Arthritis Prevalence
 Global Medical Cures™| New York Arthritis Prevalence Global Medical Cures™| New York Arthritis Prevalence
Global Medical Cures™| New York Arthritis PrevalenceGlobal Medical Cures™
 
Measuring the Vital Events in the Communities of Africa
Measuring the Vital Events in the Communities of AfricaMeasuring the Vital Events in the Communities of Africa
Measuring the Vital Events in the Communities of AfricaMEASURE Evaluation
 
From Discovery to Delivery: Benchwork to Global Health: Corey Casper
From Discovery to Delivery: Benchwork to Global Health: Corey CasperFrom Discovery to Delivery: Benchwork to Global Health: Corey Casper
From Discovery to Delivery: Benchwork to Global Health: Corey CasperUWGlobalHealth
 
Métodos de investigación en epidemiología ambiental
Métodos de investigación en epidemiología ambientalMétodos de investigación en epidemiología ambiental
Métodos de investigación en epidemiología ambientalSalud en todas
 

Was ist angesagt? (20)

16
1616
16
 
Social autopsy
Social autopsySocial autopsy
Social autopsy
 
presentation on mortality and morbidity rate.
presentation on mortality and morbidity rate.presentation on mortality and morbidity rate.
presentation on mortality and morbidity rate.
 
Mortality
MortalityMortality
Mortality
 
Medical and social problems of demographic processes
Medical and social problems of demographic processesMedical and social problems of demographic processes
Medical and social problems of demographic processes
 
Mortality and mobidity indicators
Mortality and mobidity indicatorsMortality and mobidity indicators
Mortality and mobidity indicators
 
Tubrculoza la rromi
Tubrculoza la rromiTubrculoza la rromi
Tubrculoza la rromi
 
Measurement Epidemiology
Measurement EpidemiologyMeasurement Epidemiology
Measurement Epidemiology
 
2016HIV_STI_SurveillanceReport
2016HIV_STI_SurveillanceReport2016HIV_STI_SurveillanceReport
2016HIV_STI_SurveillanceReport
 
2007 aids epidemic update
2007 aids epidemic update2007 aids epidemic update
2007 aids epidemic update
 
Vital Records: Vital input for population health measurement
Vital Records: Vital input for population health measurementVital Records: Vital input for population health measurement
Vital Records: Vital input for population health measurement
 
Hsa 535 week 11 final exam part 2
Hsa 535 week 11 final exam part 2Hsa 535 week 11 final exam part 2
Hsa 535 week 11 final exam part 2
 
maternal mortality sri lanka data sources for measuring maternal mortality_lo...
maternal mortality sri lanka data sources for measuring maternal mortality_lo...maternal mortality sri lanka data sources for measuring maternal mortality_lo...
maternal mortality sri lanka data sources for measuring maternal mortality_lo...
 
Mortality measurement
Mortality measurementMortality measurement
Mortality measurement
 
Mwj2014 5 9
Mwj2014 5 9Mwj2014 5 9
Mwj2014 5 9
 
Global Medical Cures™| New York Arthritis Prevalence
 Global Medical Cures™| New York Arthritis Prevalence Global Medical Cures™| New York Arthritis Prevalence
Global Medical Cures™| New York Arthritis Prevalence
 
Measuring the Vital Events in the Communities of Africa
Measuring the Vital Events in the Communities of AfricaMeasuring the Vital Events in the Communities of Africa
Measuring the Vital Events in the Communities of Africa
 
From Discovery to Delivery: Benchwork to Global Health: Corey Casper
From Discovery to Delivery: Benchwork to Global Health: Corey CasperFrom Discovery to Delivery: Benchwork to Global Health: Corey Casper
From Discovery to Delivery: Benchwork to Global Health: Corey Casper
 
Mortality
MortalityMortality
Mortality
 
Métodos de investigación en epidemiología ambiental
Métodos de investigación en epidemiología ambientalMétodos de investigación en epidemiología ambiental
Métodos de investigación en epidemiología ambiental
 

Ähnlich wie Poster Presentation 07_08 (2)

Epidemiology of cancer in patients seeking palliative care by l.w. cushny
Epidemiology of cancer in patients seeking palliative care by l.w. cushnyEpidemiology of cancer in patients seeking palliative care by l.w. cushny
Epidemiology of cancer in patients seeking palliative care by l.w. cushnyKesho Conference
 
Running Head OBESITY EPIDEMIC IN SOUTH U. S STATES1.docx
Running Head OBESITY EPIDEMIC IN SOUTH U. S STATES1.docxRunning Head OBESITY EPIDEMIC IN SOUTH U. S STATES1.docx
Running Head OBESITY EPIDEMIC IN SOUTH U. S STATES1.docxtoltonkendal
 
Leveraging Assets to Improve Health and Equity in Rural Communities
Leveraging Assets to Improve Health and Equity in Rural CommunitiesLeveraging Assets to Improve Health and Equity in Rural Communities
Leveraging Assets to Improve Health and Equity in Rural Communitiesnado-web
 
ESRI user conference presentation
ESRI user conference presentationESRI user conference presentation
ESRI user conference presentationSuzanne McGuire
 
Annual Arizona Conference for Tribal BCCEDP Collaboration, Flagstaff, AZ
Annual Arizona Conference for Tribal BCCEDP Collaboration, Flagstaff, AZAnnual Arizona Conference for Tribal BCCEDP Collaboration, Flagstaff, AZ
Annual Arizona Conference for Tribal BCCEDP Collaboration, Flagstaff, AZjamieritchey
 
Spatial Inequities and Health Disparities among American Indians and Alaska N...
Spatial Inequities and Health Disparities among American Indians and Alaska N...Spatial Inequities and Health Disparities among American Indians and Alaska N...
Spatial Inequities and Health Disparities among American Indians and Alaska N...UC San Diego AntiViral Research Center
 
Creation of a novel cancer & hiv linked registry by jamilla rajab
Creation of a novel cancer & hiv linked registry by jamilla rajabCreation of a novel cancer & hiv linked registry by jamilla rajab
Creation of a novel cancer & hiv linked registry by jamilla rajabKesho Conference
 
Regional Core Health Data Initiative
Regional Core Health Data InitiativeRegional Core Health Data Initiative
Regional Core Health Data InitiativePAHO_RHO
 
A Public Health Information System For Conducting Community Health Needs Asse...
A Public Health Information System For Conducting Community Health Needs Asse...A Public Health Information System For Conducting Community Health Needs Asse...
A Public Health Information System For Conducting Community Health Needs Asse...Andrew Parish
 
HIV in Emergencies: From research to strategies, policies and results
HIV in Emergencies: From research to strategies, policies and resultsHIV in Emergencies: From research to strategies, policies and results
HIV in Emergencies: From research to strategies, policies and resultsHopkinsCFAR
 
05.07.21 | Not the Same Old Blues: Trails of the Efforts to Improve PrEP Upta...
05.07.21 | Not the Same Old Blues: Trails of the Efforts to Improve PrEP Upta...05.07.21 | Not the Same Old Blues: Trails of the Efforts to Improve PrEP Upta...
05.07.21 | Not the Same Old Blues: Trails of the Efforts to Improve PrEP Upta...UC San Diego AntiViral Research Center
 
Health Seeking Behaviors following Diabetes Mellitus of Various Ethnic Groups...
Health Seeking Behaviors following Diabetes Mellitus of Various Ethnic Groups...Health Seeking Behaviors following Diabetes Mellitus of Various Ethnic Groups...
Health Seeking Behaviors following Diabetes Mellitus of Various Ethnic Groups...ijtsrd
 
Quality Data Sources Essay Example Paper.docx
Quality Data Sources Essay Example Paper.docxQuality Data Sources Essay Example Paper.docx
Quality Data Sources Essay Example Paper.docxwrite22
 
Refugee Health, Screening and Data Collection in the Triangle of North Caroli...
Refugee Health, Screening and Data Collection in the Triangle of North Caroli...Refugee Health, Screening and Data Collection in the Triangle of North Caroli...
Refugee Health, Screening and Data Collection in the Triangle of North Caroli...Courtney Hereford
 
Census Tract maps Final 12.07 w. neighborhood maps attached
Census Tract maps Final 12.07 w. neighborhood maps attachedCensus Tract maps Final 12.07 w. neighborhood maps attached
Census Tract maps Final 12.07 w. neighborhood maps attachedAriel Rogers
 
Hepatitis C Risk Assessment, Testing and Referral for Treatment in primary Ca...
Hepatitis C Risk Assessment, Testing and Referral for Treatment in primary Ca...Hepatitis C Risk Assessment, Testing and Referral for Treatment in primary Ca...
Hepatitis C Risk Assessment, Testing and Referral for Treatment in primary Ca...Real Wellness, LLC
 
CA A Cancer J Clinicians - 2021 - Siegel - Cancer Statistics 2021.pdf
CA A Cancer J Clinicians - 2021 - Siegel - Cancer Statistics 2021.pdfCA A Cancer J Clinicians - 2021 - Siegel - Cancer Statistics 2021.pdf
CA A Cancer J Clinicians - 2021 - Siegel - Cancer Statistics 2021.pdfpayecat828
 
POSTER TEMPLATE FOR HC DISPARITIES
POSTER TEMPLATE FOR HC DISPARITIESPOSTER TEMPLATE FOR HC DISPARITIES
POSTER TEMPLATE FOR HC DISPARITIESAshley York
 

Ähnlich wie Poster Presentation 07_08 (2) (20)

Epidemiology of cancer in patients seeking palliative care by l.w. cushny
Epidemiology of cancer in patients seeking palliative care by l.w. cushnyEpidemiology of cancer in patients seeking palliative care by l.w. cushny
Epidemiology of cancer in patients seeking palliative care by l.w. cushny
 
Running Head OBESITY EPIDEMIC IN SOUTH U. S STATES1.docx
Running Head OBESITY EPIDEMIC IN SOUTH U. S STATES1.docxRunning Head OBESITY EPIDEMIC IN SOUTH U. S STATES1.docx
Running Head OBESITY EPIDEMIC IN SOUTH U. S STATES1.docx
 
Leveraging Assets to Improve Health and Equity in Rural Communities
Leveraging Assets to Improve Health and Equity in Rural CommunitiesLeveraging Assets to Improve Health and Equity in Rural Communities
Leveraging Assets to Improve Health and Equity in Rural Communities
 
ESRI user conference presentation
ESRI user conference presentationESRI user conference presentation
ESRI user conference presentation
 
Annual Arizona Conference for Tribal BCCEDP Collaboration, Flagstaff, AZ
Annual Arizona Conference for Tribal BCCEDP Collaboration, Flagstaff, AZAnnual Arizona Conference for Tribal BCCEDP Collaboration, Flagstaff, AZ
Annual Arizona Conference for Tribal BCCEDP Collaboration, Flagstaff, AZ
 
Spatial Inequities and Health Disparities among American Indians and Alaska N...
Spatial Inequities and Health Disparities among American Indians and Alaska N...Spatial Inequities and Health Disparities among American Indians and Alaska N...
Spatial Inequities and Health Disparities among American Indians and Alaska N...
 
Creation of a novel cancer & hiv linked registry by jamilla rajab
Creation of a novel cancer & hiv linked registry by jamilla rajabCreation of a novel cancer & hiv linked registry by jamilla rajab
Creation of a novel cancer & hiv linked registry by jamilla rajab
 
Regional Core Health Data Initiative
Regional Core Health Data InitiativeRegional Core Health Data Initiative
Regional Core Health Data Initiative
 
A Public Health Information System For Conducting Community Health Needs Asse...
A Public Health Information System For Conducting Community Health Needs Asse...A Public Health Information System For Conducting Community Health Needs Asse...
A Public Health Information System For Conducting Community Health Needs Asse...
 
Pat_CAGONT Poster
Pat_CAGONT PosterPat_CAGONT Poster
Pat_CAGONT Poster
 
HIV in Emergencies: From research to strategies, policies and results
HIV in Emergencies: From research to strategies, policies and resultsHIV in Emergencies: From research to strategies, policies and results
HIV in Emergencies: From research to strategies, policies and results
 
05.07.21 | Not the Same Old Blues: Trails of the Efforts to Improve PrEP Upta...
05.07.21 | Not the Same Old Blues: Trails of the Efforts to Improve PrEP Upta...05.07.21 | Not the Same Old Blues: Trails of the Efforts to Improve PrEP Upta...
05.07.21 | Not the Same Old Blues: Trails of the Efforts to Improve PrEP Upta...
 
Carmela
CarmelaCarmela
Carmela
 
Health Seeking Behaviors following Diabetes Mellitus of Various Ethnic Groups...
Health Seeking Behaviors following Diabetes Mellitus of Various Ethnic Groups...Health Seeking Behaviors following Diabetes Mellitus of Various Ethnic Groups...
Health Seeking Behaviors following Diabetes Mellitus of Various Ethnic Groups...
 
Quality Data Sources Essay Example Paper.docx
Quality Data Sources Essay Example Paper.docxQuality Data Sources Essay Example Paper.docx
Quality Data Sources Essay Example Paper.docx
 
Refugee Health, Screening and Data Collection in the Triangle of North Caroli...
Refugee Health, Screening and Data Collection in the Triangle of North Caroli...Refugee Health, Screening and Data Collection in the Triangle of North Caroli...
Refugee Health, Screening and Data Collection in the Triangle of North Caroli...
 
Census Tract maps Final 12.07 w. neighborhood maps attached
Census Tract maps Final 12.07 w. neighborhood maps attachedCensus Tract maps Final 12.07 w. neighborhood maps attached
Census Tract maps Final 12.07 w. neighborhood maps attached
 
Hepatitis C Risk Assessment, Testing and Referral for Treatment in primary Ca...
Hepatitis C Risk Assessment, Testing and Referral for Treatment in primary Ca...Hepatitis C Risk Assessment, Testing and Referral for Treatment in primary Ca...
Hepatitis C Risk Assessment, Testing and Referral for Treatment in primary Ca...
 
CA A Cancer J Clinicians - 2021 - Siegel - Cancer Statistics 2021.pdf
CA A Cancer J Clinicians - 2021 - Siegel - Cancer Statistics 2021.pdfCA A Cancer J Clinicians - 2021 - Siegel - Cancer Statistics 2021.pdf
CA A Cancer J Clinicians - 2021 - Siegel - Cancer Statistics 2021.pdf
 
POSTER TEMPLATE FOR HC DISPARITIES
POSTER TEMPLATE FOR HC DISPARITIESPOSTER TEMPLATE FOR HC DISPARITIES
POSTER TEMPLATE FOR HC DISPARITIES
 

Poster Presentation 07_08 (2)

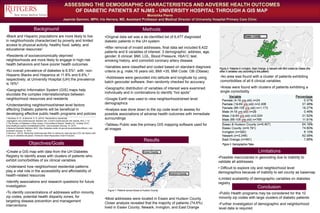
  • 1. ASSESSING THE DEMOGRAPHIC CHARACTERISTICS AND ADVERSE HEALTH OUTCOMES OF DIABETIC PATIENTS AT NJMS - UNIVERSITY HOSPITAL THROUGH A GIS MAP Monishka Pierre Jeannie Garmon, MPH; Iris Herrera, MD, Assistant Professor and Medical Director of University Hospital Primary Care Clinic Background •Create a GIS map with data from the UH Diabetes Registry to identify areas with clusters of patients who exhibit comorbidities of six clinical variables •Understand how neighborhood residential patterns play a vital role in the accessibility and affordability of health-related resources •Identify associations and research questions for future investigation •To identify concentrations of addresses within minority zip codes, potential health disparity zones, for targeting disease prevention and management interventions Statistics are for 2000-2004, age-adjusted to the 2000 U.S. standard million population, and represent the number of new cases of invasive cancer and deaths per year per 100,000 women.*Statistics are for 2000-2004, age-adjusted to the 2000 U.S. standard million population, and represent the number of new cases of invasive cancer and deaths per year per 100,000 women.*Statistics are for 2000-2004, age-adjusted to the 2000 U.S. standard million population, and represent the number of new cases of invasive cancer and deaths per year per 100,000 women.*Statistics are for 2000-2004, age-adjusted to the 2000 U.S. standard million population, and represent the number of new cases of invasive cancer and deaths per year per 100,000 women.*Statistics are for 2000-2004, age-adjusted to the 2000 U.S. standard million population, and represent the number of new cases of invasive cancer and deaths per year per 100,000 women.*Statistics are for 2000-2004, age-adjusted to the 2000 U.S. standard million population, and represent the number of new cases of invasive cancer and deaths per year per 100,000 women.*Statistics are for 2000-2004, age-adjusted to the 2000 U.S. standard million population, and represent the number of new cases of invasive cancer and deaths per year per 100,000 women.* •Black and Hispanic populations are more likely to live in neighborhoods characterized by poverty and limited access to physical activity, healthy food, safety, and educational resources1 •Residents of socioeconomically deprived neighborhoods are more likely to engage in high-risk health behaviors and have poorer health outcomes •NJ overall prevalence of diabetes is 6.5%2, with non- Hispanic Blacks and Hispanics at 11.8% and 6.6%,3 respectively; at University Hospital (UH) the prevalence is 16%4 •Geographic Information System (GIS) maps help elucidate the complex interrelationships between neighborhood resources and residents •Understanding neighborhood/street level factors affecting Diabetic patients will be beneficial in developing effective public health programs and policies _____________________________________________________________________________________________________________________________________________ 1.Kershaw, K. N., & Albrecht, S. S. (2015). Racial/ethnic residential segregation and cardiovascular disease risk. Current cardiovascular risk reports, 9(3), 1-12. 2.The Burden of Diabetes in New Jersey: A Surveillance Report. Healthy NJ. October 2010. www.healthynj.org/dis-con/diabetes/nj.html. Last accessed January 14, 2010. 3.National Diabetes Statistics 2007. http://diabetes.niddk.nih.gov/dm/pubs/statistics/#race. Last accessed January 14, 2010. 4.Herrera,I. (2012). Reducing Cardiovascular Risk in Latinos by reducing key CVD risk factors with a focus on diabetes education. American Heart Association Grant Proposal. •Original data set was a de-identified list of 6,477 diagnosed diabetic patients in the UH system •After removal of invalid addresses, final data set included 6,422 patients and 9 variables of interest: 3 demographic: address, age, gender; 6 clinical: BMI, LDL, Blood Pressure, HbA1C test, smoking history, and comorbid coronary artery disease •Variables were classified and coded based on standard diagnosis criteria (e.g. male,16 years old, BMI =35, BMI Code: OB (Obese) •Addresses were geocoded into latitude and longitude by using batch geocoder software, then randomly checked for accuracy •Geographic distribution of variables of interest were examined individually and in combinations to identify “hot spots” •Google Earth was used to view neighborhood/street level demographics •Analysis was done down to the zip code level to assess for possible associations of adverse health outcomes with immediate surroundings •Tableau Public was the primary GIS mapping software used for all images . •No area was found with a cluster of patients exhibiting comorbidities of all 6 clinical variables •Areas were found with clusters of patients exhibiting a single comorbidity •Public Health programs may be considered for the 10 minority zip codes with large clusters of diabetic patients •Further investigation of demographic and neighborhood level data is required •Most addresses were located in Essex and Hudson County. Closer analysis revealed that the majority of patients (74.6%) lived in Essex County; Newark, Irvington, and East Orange •Possible inaccuracies in geocoding due to inability to validate all addresses • Difficult to explore city and neighborhood level demographics because of inability to set county as basemap •Limited availability of demographic variables on diabetes registry Objectives/Goals Methods Results Limitations Conclusion