1. Incorporating Exposure Factors into a Commuter
Exposure Estimation Modeling System
Mónica Restoa, Ryan Michaelb, Amy L. Stuarta,b
aDepartment of Civil and Environmental Engineering, University of South Florida, Tampa
bDepartment of Environmental and Occupational Health, University of South Florida, Tampa
Motivation
In 2014, the United Nations proclaimed that 54% of the global population was living in urban
areas, and this percentage will continue to increase. Commuting puts humans in contact with
high concentrations of urban air pollution, which increase mortality and morbidity. With the
rise in alternative commute options, such as cycling, it is important to understand the
exposure to and intake of air pollutants.
Objectives
The objective of the overarching project is to estimate exposure and intake during commuting
of the air pollutants CO and PM2.5 black carbon in Fort Collins, Colorado.
Figure 1. Shows examples of input data for the exposure modeling system: a) one hour of
concentration data generated by AERMOD Gaussian dispersion model, b) measured routes of
commute activities for one person in Fort Collins, CO.
The objective of this subproject is to incorporate appropriate exposure factors into the
modeling system that account for differences between each type of activity, route chosen, and
season. Exposure factors include breathing rates (which account for differences in route and
mode) and vehicle ingression rates that account for changes in mode and season..
Methods
In order to find exposure and intake factors, a literature review was conducted. This work is
ongoing, and below are displayed a few factors that are currently utilized in the model. Next,
the exposure modeling system code (in R) was reviewed; this was necessary to find where the
factors would be incorporated. A flow chart is shown below, detailing the functions of each
module in the model. The calculations occur in the module outlined in a bold box.
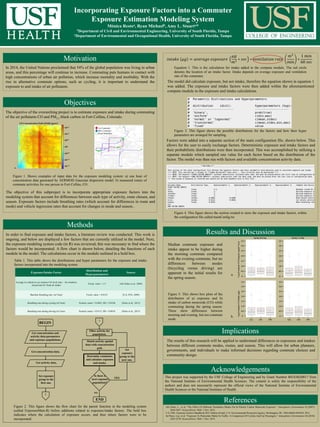
Figure 4. This figure shows the section created to store the exposure and intake factors, within
the configuration file called mainConfig.txt.
The model did calculate exposure, but not intake, therefore the equation shown in equation 1
was added. The exposure and intake factors were then added within the aforementioned
compute module in the exposure and intake calculations.
Results and Discussion
Median commute exposure and
intake appear to be higher during
the morning commute compared
with the evening commute, but no
differences between modes
(bicycling versus driving) are
apparent in the initial results for
the spring season.
Figure 5: This shows box plots of the
distribution of a) exposure and b)
intake of carbon monoxide (CO) while
commuting during the spring season.
These show differences between
morning and evening, but not commute
mode.
Implications
The results of this research will be applied to understand differences in exposures and intakes
between different commute modes, routes, and season. This will allow for urban planners,
governments, and individuals to make informed decisions regarding commute choices and
community design.
Acknowledgements
This project was supported by the USF College of Engineering and by Grant Number R01ES020017 from
the National Institute of Environmental Health Sciences. The content is solely the responsibility of the
authors and does not necessarily represent the official views of the National Institute of Environmental
Health Sciences or the National Institutes of Health.
References
Abi Esber, L., et al. "The Effect Of Different Ventilation Modes On In-Vehicle Carbon Monoxide Exposure." Atmospheric Environment 41.(2007):
3644-3657. ScienceDirect. Web. 1 Nov. 2015.
U.S. EPA. Exposure Factors Handbook 2011 Edition (Final). U.S. Environmental Protection Agency, Washington, DC, EPA/600/R-09/052F, 2011.
Int Panis, Luc, et al. "Exposure To Particulate Matter In Traffic: A Comparison Of Cyclists And Car Passengers." Atmospheric Environment 44.(2010):
2263-2270. ScienceDirect. Web. 1 Nov. 2015.
Table 1. This table shows the distributions and hyper parameters for the exposure and intake
factors incorporated into the modeling system.
Equation 1. This is the calculation for intake added to the compute module. The red circle
denotes the location of an intake factor. Intake depends on average exposure and ventilation
rate of the commuter.
Factors were added into a separate section of the main configuration file, shown below. This
allows for the user to easily exchange factors. Deterministic exposure and intake factors and
their probabilistic distributions were then incorporated. This was accomplished by utilizing a
separate module which sampled one value for each factor based on the distribution of the
factor. The model was then run with factors and available concentration activity data.
Figure 3. This figure shows the possible distributions for the factors and how their hyper
parameters are arranged for sampling.
a.
b.
Figure 2. This figure shows the flow chart for the parent function in the modeling system
(called ExposureMain.R) before additions related to exposure/intake factors. The bold box
indicates where the calculation of exposure occurs, and thus where factors were to be
incorporated.