Go Ahead for F&O Report 30 November 2012-Mansukh Investment and Trading Solution
•
0 likes•116 views

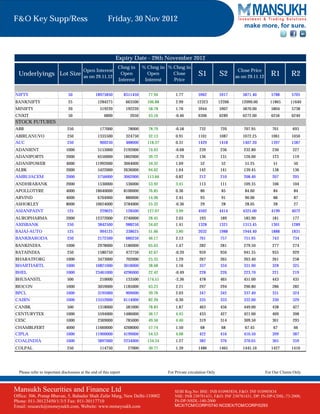
Key Supports & Resistances of F&O scrips with change in open interest on daily basis 30.11.12..

Recommended
Recommended
More Related Content
What's hot
What's hot (20)
Viewers also liked
Viewers also liked (7)
Similar to Go Ahead for F&O Report 30 November 2012-Mansukh Investment and Trading Solution
Similar to Go Ahead for F&O Report 30 November 2012-Mansukh Investment and Trading Solution (20)
More from Mansukh Investment & Trading Solutions
More from Mansukh Investment & Trading Solutions (20)
Go Ahead for F&O Report 30 November 2012-Mansukh Investment and Trading Solution
- 1. F&O Key Supp/Ress Friday, 30 Nov 2012 make more, for sure. Expiry Date - 29th November 2012 Chng in % Chng in % Chng in Open Interest Close Price Underlyings Lot Size as on 29.11.12 Open Open Close S1 S2 as on 29.11.12 R1 R2 Interest Interest Price NIFTY 50 18975850 8311450 77.94 1.77 5962 5917 5871.40 5788 5705 BANKNIFTY 25 1284275 663500 106.88 2.99 12323 12206 12090.00 11865 11640 MINIFTY 20 519220 192220 58.78 1.76 5944 5907 5870.00 5804 5738 CNXIT 50 6800 2050 43.16 -0.46 6306 6289 6272.00 6256 6240 STOCK FUTURES ABB 250 177000 78000 78.79 -0.58 732 720 707.95 701 693 ABIRLANUVO 250 1335500 324750 32.13 0.91 1101 1087 1072.25 1061 1050 ACC 250 900250 488000 118.37 0.31 1429 1418 1407.20 1397 1387 ADANIENT 1000 5153000 2192000 74.03 -0.68 239 236 232.80 230 227 ADANIPORTS 2000 6550000 1862000 39.72 -2.70 136 131 126.00 123 119 ADANIPOWER 4000 11992000 3064000 34.32 1.69 52 52 51.25 51 50 ALBK 2000 5422000 2636000 94.62 1.64 142 141 139.45 138 136 AMBUJACEM 2000 5756000 3062000 113.66 0.82 212 210 208.40 207 205 ANDHRABANK 2000 1530000 536000 53.92 3.45 113 111 109.35 106 104 APOLLOTYRE 4000 18640000 8100000 76.85 0.36 86 85 84.60 84 84 ARVIND 4000 6764000 880000 14.96 2.45 93 91 90.00 88 87 ASHOKLEY 8000 10624000 3784000 55.32 -0.36 29 28 28.05 28 27 ASIANPAINT 125 229625 128500 127.07 3.99 4502 4414 4325.00 4199 4072 AUROPHARMA 2000 12372000 2740000 28.45 2.03 193 189 185.90 181 177 AXISBANK 250 3842500 988250 34.62 1.41 1328 1321 1313.45 1301 1289 BAJAJ-AUTO 125 994125 338625 51.66 3.80 2032 1988 1944.40 1888 1831 BANKBARODA 250 2172500 686250 46.17 2.13 761 757 751.95 743 734 BANKINDIA 1000 2978000 1180000 65.63 1.47 282 281 279.50 277 274 BATAINDIA 250 1580750 472750 42.67 -0.20 959 950 941.35 935 929 BHARATFORG 1000 3473000 702000 25.33 1.29 267 265 263.40 261 258 BHARTIARTL 1000 10821000 3018000 38.68 1.16 337 334 331.90 328 325 BHEL 1000 23461000 4296000 22.42 -0.49 228 226 223.70 221 219 BHUSANSTL 500 210000 133500 174.51 -2.36 478 465 451.00 443 435 BIOCON 1000 3059000 1185000 63.23 2.21 297 294 290.80 286 282 BPCL 1000 3195000 909000 39.76 2.03 347 342 337.40 331 324 CAIRN 1000 13552000 6114000 82.20 0.30 335 333 332.00 330 329 CANBK 500 1318000 581000 78.83 1.87 463 456 449.00 438 427 CENTURYTEX 1000 5594000 1486000 36.17 4.45 433 427 421.00 409 398 CESC 1000 2369000 785000 49.56 4.40 319 314 309.50 301 293 CHAMBLFERT 4000 11660000 4268000 57.74 1.50 68 68 67.45 67 66 CIPLA 1000 11900000 4199000 54.53 4.08 422 416 410.50 399 387 COALINDIA 1000 3897000 2234000 134.34 1.27 382 376 370.05 365 359 COLPAL 250 114750 27000 30.77 1.39 1486 1465 1445.10 1427 1410 Please refer to important disclosures at the end of this report For Private circulation Only For Our Clients Only Mansukh Securities and Finance Ltd SEBI Reg.No: BSE: INB 010985834, F&O: INF 010985834 Office: 306, Pratap Bhavan, 5, Bahadur Shah Zafar Marg, New Delhi-110002 NSE: INB 230781431, F&O: INF 230781431, DP: IN-DP-CDSL-73-2000, Phone: 011-30123450/1/3/5 Fax: 011-30117710 IN-DP-NSDL-140-2000 Email: research@moneysukh.com, Website: www.moneysukh.com MCX/TCM/CORP/0740 NCDEX/TCM/CORP/0293
- 2. F&O Key Supp/Ress make more, for sure. Expiry Date - 29th November 2012 Chng in % Chng in % Chng in Open Interest Close Price Underlyings Lot Size as on 29.11.12 Open Open Close S1 S2 as on 29.11.12 R1 R2 Interest Interest Price CROMPGREAV 2000 6834000 2644000 63.10 -2.35 121 118 114.50 112 110 DABUR 2000 5406000 2190000 68.10 1.35 128 128 127.25 126 125 DENABANK 4000 8972000 3276000 57.51 1.57 112 111 110.00 109 107 DISHTV 4000 21520000 3888000 22.05 0.89 83 81 79.15 78 77 DIVISLAB 250 1242500 717750 136.78 1.40 1228 1216 1203.80 1184 1165 DLF 1000 21873000 6923000 46.31 1.84 214 212 210.75 209 206 DRREDDY 125 830250 295750 55.33 1.56 1857 1841 1826.30 1809 1791 EXIDEIND 2000 1972000 694000 54.30 -0.31 149 147 145.15 143 140 FEDERALBNK 500 1042500 293000 39.09 2.49 487 482 477.75 470 463 FINANTECH 250 1082500 425250 64.70 -2.07 1192 1159 1125.00 1105 1086 GAIL 1000 2355000 1202000 104.25 1.42 352 350 347.25 344 340 GMRINFRA 8000 76552000 23240000 43.59 -1.93 19 18 17.75 17 17 GODREJIND 1000 2278000 726000 46.78 1.74 310 307 304.05 300 295 GRASIM 125 926750 243375 35.61 2.55 3423 3372 3322.00 3259 3196 GSPL 4000 3828000 1716000 81.25 0.96 75 75 73.70 73 71 GUJFLUORO 500 2402500 387500 19.23 4.99 360 351 342.00 330 318 GVKPIL 12000 58116000 12540000 27.51 1.93 14 13 13.20 13 13 HAVELLS 500 627500 276000 78.52 0.66 590 586 583.30 578 572 HCLTECH 500 2917500 754500 34.88 -0.42 660 652 644.90 639 634 HDFC 500 7123500 3528000 98.12 2.84 852 840 828.00 807 786 HDFCBANK 500 9280000 3270500 54.42 2.95 725 715 706.00 689 671 HDIL 4000 26732000 11648000 77.22 7.27 119 116 113.60 109 104 HEROMOTOCO 125 1745000 396875 29.44 -0.65 1897 1864 1831.00 1809 1787 HCLTECH 500 2917500 754500 34.88 -0.42 660 652 644.90 639 634 HINDALCO 2000 31766000 10326000 48.16 1.06 116 115 114.40 114 113 HINDPETRO 1000 5817000 1551000 36.36 2.62 293 290 287.40 282 278 HINDUNILVR 500 6678500 2243500 50.59 1.43 560 557 553.00 547 542 HINDZINC 2000 1738000 776000 80.67 2.00 145 143 139.95 138 135 IBREALEST 4000 32972000 10180000 44.66 4.66 73 72 70.70 69 66 ICICIBANK 250 10230250 3739000 57.60 4.42 1118 1104 1090.10 1065 1040 IDBI 2000 16150000 8348000 107.00 3.50 110 108 106.50 104 101 IDEA 4000 7492000 2088000 38.64 -0.40 104 102 100.35 99 98 IDFC 2000 13410000 5092000 61.22 2.71 173 171 168.75 165 162 IFCI 8000 69520000 17640000 34.00 3.70 32 31 30.80 30 29 IGL 1000 2457000 956000 63.69 0.86 270 266 262.65 259 256 INDHOTEL 4000 8544000 2460000 40.43 1.53 64 63 63.05 62 62 INDIACEM 2000 10540000 3208000 43.75 -0.47 87 86 85.50 85 84 INDUSINDBK 1000 2409000 650000 36.95 4.75 431 422 413.30 400 387 INFY 125 3780500 1083000 40.15 -1.11 2492 2474 2456.00 2440 2423 IOB 4000 3856000 1824000 89.76 2.23 80 79 78.00 76 75 Please refer to important disclosures at the end of this report For Private circulation Only For Our Clients Only Mansukh Securities and Finance Ltd SEBI Reg.No: BSE: INB 010985834, F&O: INF 010985834 Office: 306, Pratap Bhavan, 5, Bahadur Shah Zafar Marg, New Delhi-110002 NSE: INB 230781431, F&O: INF 230781431, DP: IN-DP-CDSL-73-2000, Phone: 011-30123450/1/3/5 Fax: 011-30117710 IN-DP-NSDL-140-2000 Email: research@moneysukh.com, Website: www.moneysukh.com MCX/TCM/CORP/0740 NCDEX/TCM/CORP/0293
- 3. F&O Key Supp/Ress make more, for sure. Expiry Date - 29th November 2012 Chng in % Chng in % Chng in Open Interest Close Price Underlyings Lot Size as on 29.11.12 Open Open Close S1 S2 as on 29.11.12 R1 R2 Interest Interest Price IOC 1000 1178000 351000 42.44 0.82 270 268 265.55 261 257 IRB 2000 7510000 2528000 50.74 6.55 142 139 135.90 131 125 ITC 1000 21960000 9635000 78.17 1.40 305 303 300.40 297 293 IVRCLINFRA 4000 29924000 10700000 55.66 3.75 42 42 41.45 41 40 JINDALSTEL 500 7225500 2725000 60.55 0.56 391 388 385.20 382 379 JISLJALEQS 2000 18944000 6250000 49.24 2.07 68 67 66.70 66 65 JPASSOCIAT 4000 66768000 16220000 32.09 2.75 98 96 95.20 93 92 JPPOWER 8000 8864000 2760000 45.22 3.14 41 40 39.45 39 38 JSWENERGY 4000 21280000 6788000 46.84 -0.90 63 62 60.80 60 59 JSWSTEEL 500 10153500 1096500 12.11 -0.58 762 749 736.10 727 718 JUBLFOOD 250 580250 211250 57.25 -0.39 1292 1274 1255.75 1247 1238 KOTAKBANK 500 2648500 774000 41.29 3.18 676 668 660.00 647 633 KTKBANK 4000 19252000 5640000 41.43 5.28 180 173 165.40 159 152 LICHSGFIN 1000 12384000 4529000 57.66 3.70 267 264 260.75 255 249 LT 250 3101500 1316500 73.75 2.83 1712 1695 1678.00 1647 1615 LUPIN 500 1994500 930000 87.36 0.31 589 585 580.75 577 573 M&M 500 3344000 1425500 74.30 0.47 961 951 941.00 930 919 MARUTI 250 2607000 485750 22.90 -1.18 1567 1530 1492.90 1470 1446 MCDOWELL-N 250 5414500 990500 22.39 -2.42 2207 2122 2038.00 1994 1951 MCLEODRUSS 1000 4259000 389000 10.05 2.65 375 368 361.70 354 347 MPHASIS 500 236000 86500 57.86 -3.00 412 401 389.75 382 374 MRF 125 115250 49125 74.29 5.94 11213 10982 10752.00 10338 9925 NHPC 10000 102100000 39260000 62.48 -3.60 24 24 22.75 22 22 NMDC 2000 1682000 616000 57.79 0.19 168 164 160.60 158 155 NTPC 2000 9882000 2966000 42.89 1.10 165 163 161.25 159 156 OFSS 125 347875 75000 27.49 -1.29 3042 2978 2913.65 2876 2839 ONGC 1000 11262000 5166000 84.74 1.65 259 258 256.00 253 250 OPTOCIRCUI 1000 7551000 2144000 39.65 7.78 112 109 106.70 102 97 ORIENTBANK 1000 1353000 528000 64.00 0.84 332 328 324.55 320 315 PANTALOONR 2000 10768000 1440000 15.44 2.05 215 212 208.65 205 201 PETRONET 2000 2738000 1192000 77.10 -0.68 164 163 160.85 160 158 PFC 2000 7482000 3412000 83.83 4.04 197 194 191.70 187 182 PEL 500 654500 21500 3.40 2.17 513 509 504.40 497 489 PNB 250 2904750 779000 36.65 1.97 788 783 777.95 768 757 POWERGRID 2000 9168000 5002000 120.07 -0.63 121 120 118.90 118 117 PTC 4000 3564000 1044000 41.43 0.63 73 72 71.65 71 70 PUNJLLOYD 4000 27392000 2256000 8.98 5.75 55 54 53.35 52 50 RANBAXY 500 4209000 1836500 77.41 1.81 526 521 516.25 509 502 RAYMOND 1000 4302000 686000 18.97 1.53 469 461 452.50 442 432 RCOM 4000 69616000 15508000 28.66 0.07 72 71 70.15 69 69 Please refer to important disclosures at the end of this report For Private circulation Only For Our Clients Only Mansukh Securities and Finance Ltd SEBI Reg.No: BSE: INB 010985834, F&O: INF 010985834 Office: 306, Pratap Bhavan, 5, Bahadur Shah Zafar Marg, New Delhi-110002 NSE: INB 230781431, F&O: INF 230781431, DP: IN-DP-CDSL-73-2000, Phone: 011-30123450/1/3/5 Fax: 011-30117710 IN-DP-NSDL-140-2000 Email: research@moneysukh.com, Website: www.moneysukh.com MCX/TCM/CORP/0740 NCDEX/TCM/CORP/0293
- 4. F&O Key Supp/Ress make more, for sure. Expiry Date - 29th November 2012 Chng in % Chng in % Chng in Open Interest Close Price Underlyings Lot Size as on 29.11.12 Open Open Close S1 S2 as on 29.11.12 R1 R2 Interest Interest Price RECLTD 1000 4273000 1814000 73.77 4.28 238 235 231.30 225 219 RELCAPITAL 500 9264000 2677500 40.65 3.28 427 423 419.00 411 402 RELIANCE 250 12579250 4589000 57.43 1.16 819 810 800.55 790 779 RELINFRA 500 7506500 2740500 57.50 1.50 490 486 482.55 476 470 RENUKA 8000 45920000 16720000 57.26 0.85 30 30 29.70 29 29 RPOWER 2000 17160000 4740000 38.16 1.66 99 98 97.75 97 96 SAIL 4000 19588000 4972000 34.02 0.63 81 80 79.90 79 79 SBIN 125 5892000 1239000 26.63 1.25 2179 2167 2154.00 2132 2110 SESAGOA 1000 7353000 2641000 56.05 3.07 196 188 179.50 172 165 SIEMENS 500 988500 471000 91.01 0.07 695 687 679.80 672 665 SINTEX 4000 24432000 9940000 68.59 0.81 65 64 62.60 62 61 SRTRANSFIN 500 325500 121000 59.17 2.98 671 665 658.70 647 636 STER 2000 23180000 6546000 39.35 3.07 111 108 105.80 103 100 SUNPHARMA 500 3272000 1318000 67.45 0.96 726 720 713.25 706 699 SUNTV 1000 4008000 1195000 42.48 4.57 432 421 409.95 395 380 SUZLON 8000 116328000 5144000 4.63 10.33 19 19 18.15 17 16 SYNDIBANK 2000 1548000 826000 114.40 2.45 128 127 125.30 123 121 TATACHEM 1000 1282000 415000 47.87 4.61 339 333 328.00 318 308 TATACOMM 1000 2885000 348000 13.72 -0.69 245 241 237.70 234 231 TATAGLOBAL 2000 14738000 5406000 57.93 -0.27 169 166 164.00 163 161 TATAMOTORS 1000 30919000 8730000 39.34 4.01 288 284 279.15 272 265 TATAMTRDVR 2000 6008000 2140000 55.33 2.61 169 167 165.35 162 160 TATAPOWER 2000 8576000 3968000 86.11 2.06 109 108 106.50 105 103 TATASTEEL 500 16704500 4959000 42.22 0.87 387 384 381.10 378 376 TCS 250 4016250 1773250 79.06 0.21 1328 1318 1308.70 1300 1291 TECHM 250 1110000 466500 72.49 -1.94 909 896 882.55 876 869 TITAN 1000 4624000 1326000 40.21 1.18 313 311 308.90 305 301 UCOBANK 4000 11832000 5244000 79.60 2.41 76 75 74.50 73 72 ULTRACEMCO 125 1102000 408125 58.82 1.43 1959 1935 1910.35 1888 1866 ULTRACEMCO 125 1102000 408125 58.82 1.43 1959 1935 1910.35 1888 1866 UNIONBANK 1000 3346000 832000 33.09 0.02 242 239 236.00 233 229 UNIPHOS 2000 8952000 3034000 51.27 1.73 118 116 114.40 112 111 UNITECH 8000 88544000 20200000 29.56 8.08 34 33 32.10 30 29 VIJAYABANK 4000 6024000 2660000 79.07 0.62 57 57 56.60 56 56 VOLTAS 2000 4632000 2064000 80.37 1.79 111 109 108.00 106 105 WELCORP 2000 20144000 3972000 24.56 2.12 109 108 106.20 104 102 WIPRO 500 3421000 1424500 71.35 1.53 399 394 388.45 382 375 YESBANK 1000 7320000 2698000 58.37 1.33 454 448 442.50 437 431 ZEEL 2000 7898000 2796000 54.80 0.77 212 208 203.85 198 193 Note: Scrips denoted in Blue color are Nifty-50 stocks, Chng in OI & Price >3%denoted in Green, Chng in OI & Price <3%denoted in Red, Else rest in Black. Please refer to important disclosures at the end of this report For Private circulation Only For Our Clients Only Mansukh Securities and Finance Ltd SEBI Reg.No: BSE: INB 010985834, F&O: INF 010985834 Office: 306, Pratap Bhavan, 5, Bahadur Shah Zafar Marg, New Delhi-110002 NSE: INB 230781431, F&O: INF 230781431, DP: IN-DP-CDSL-73-2000, Phone: 011-30123450/1/3/5 Fax: 011-30117710 IN-DP-NSDL-140-2000 Email: research@moneysukh.com, Website: www.moneysukh.com MCX/TCM/CORP/0740 NCDEX/TCM/CORP/0293
- 5. F&O Key Supp/Ress make more, for sure. NAME DESIGNATION E-MAIL Varun Gupta Head - Research varungupta@moneysukh.com Pashupati Nath Jha Research Analyst pashupatinathjha@moneysukh.com Vikram Singh Research Analyst vikram_research@moneysukh.com This report is for the personal information of the authorized recipient and does not construe to be any investment, legal or taxation advice to you. Mansukh Securities and Finance Ltd (hereinafter referred as MSFL) is not soliciting any action based on it. This report is not for public distribution and has been furnished to you solely for your information and should not be reproduced or redistributed to any person in any form. The report is based upon information that we consider reliable, but we do not represent that it is accurate or complete. MSFL or any of its affiliates or employees shall not be in any way responsible for any loss or damage that may arise to any person from any inadvertent error in the information contained in this report. MSFL or any of its affiliates or employees do not provide, at any time, any express or implied warranty of any kind, regarding any matter pertaining to this report, including without limitation the implied warranties of merchantability, fitness for a particular purpose, and non- infringement. The recipients of this report should rely on their own investigations. MSFL and/or its affiliates and/or employees may have interests/positions, financial or otherwise in the securities mentioned in this report. This information is subject to change without any prior notice. MSFL reserves the right to make modifications and alterations to this statement as may be required from time to time. Nevertheless, MSFL is committed to providing independent and transparent recommendations to its clients, and would be happy to provide information in response to specific client queries. Please refer to important disclosures at the end of this report For Private circulation Only For Our Clients Only Mansukh Securities and Finance Ltd SEBI Regn No. BSE: INB010985834 / NSE: INB230781431 SEBI Reg.No: BSE: INB 010985834, F&O: INF 010985834 Office: 306, Pratap Bhavan, 5, Bahadur Shah Zafar Marg, New Delhi-110002 PMS Regn No. INP000002387 NSE: INB 230781431, F&O: INF 230781431, DP: IN-DP-CDSL-73-2000, Phone: 011-30123450/1/3/5 Fax: 011-30117710 IN-DP-NSDL-140-2000 Email: research@moneysukh.com, Website: www.moneysukh.com MCX/TCM/CORP/0740 NCDEX/TCM/CORP/0293