Estadísticas Lluvias Máximas Diarias Huancabamba
•Download as DOCX, PDF•
0 likes•192 views

The document analyzes the statistical processing of maximum daily rainfall data from the Huancabamba weather station from 1971-2009. It includes the monthly rainfall values in millimeters for each year. The purpose is to obtain rainfall values for return periods of 2, 5, 10, 25, 50, 100 and 500 years by statistically processing the data on maximum 24-hour rainfall.

Recommended
More Related Content
What's hot
What's hot (20)
Viewers also liked
Viewers also liked (15)
Similar to Estadísticas Lluvias Máximas Diarias Huancabamba
Similar to Estadísticas Lluvias Máximas Diarias Huancabamba (20)
Estadísticas Lluvias Máximas Diarias Huancabamba
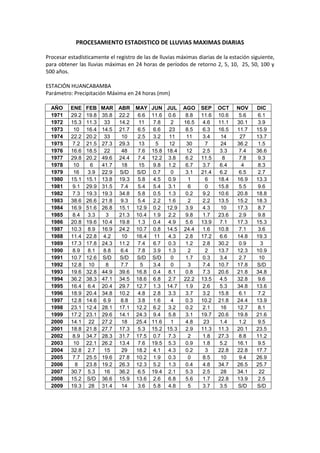
- 1. PROCESAMIENTO ESTADISTICO DE LLUVIAS MAXIMAS DIARIAS Procesar estadísticamente el registro de las de lluvias máximas diarias de la estación siguiente, para obtener las lluvias máximas en 24 horas de períodos de retorno 2, 5, 10, 25, 50, 100 y 500 años. ESTACIÓN HUANCABAMBA Parámetro: Precipitación Máxima en 24 horas (mm) AÑO ENE FEB MAR ABR MAY JUN JUL AGO SEP OCT NOV DIC 1971 29.2 19.8 35.8 22.2 6.6 11.6 0.6 8.8 11.6 10.6 5.6 6.1 1972 15.3 11.3 33 14.2 11 7.8 2 16.5 4.6 11.1 30.1 3.9 1973 10 16.4 14.5 21.7 6.5 6.6 23 8.5 6.3 16.5 11.7 15.9 1974 22.2 20.2 33 10 2.5 3.2 11 11 3.4 14 27 13.7 1975 7.2 21.5 27.3 29.3 13 5 12 30 7 24 36.2 1.5 1976 16.6 18.5 22 48 7.6 15.8 18.4 12 2.5 3.3 7.4 36.6 1977 29.8 20.2 49.6 24.4 7.4 12.2 3.8 6.2 11.5 8 7.8 9.3 1978 10 6 41.7 18 15 9.8 1.2 6.7 3.7 6.4 4 8.3 1979 16 3.9 22.9 S/D S/D 0.7 0 3.1 21.4 6.2 6.5 2.7 1980 15.1 15.1 13.8 19.3 5.8 4.5 0.9 1 6 18.4 16.9 13.3 1981 9.1 29.9 31.5 7.4 5.4 5.4 3.1 6 0 15.8 5.5 9.6 1982 7.3 19.3 19.3 34.8 5.8 0.5 1.3 0.2 9.2 10.6 20.8 18.8 1983 38.6 26.6 21.8 9.3 5.4 2.2 1.6 2 2.2 13.5 15.2 18.3 1984 16.9 51.6 26.8 15.1 12.9 0.2 12.9 3.9 4.3 10 17.3 8.7 1985 8.4 3.3 3 21.3 10.4 1.9 2.2 9.8 1.7 23.6 2.9 9.8 1986 20.8 19.6 10.4 19.8 1.3 0.4 4.9 5.6 13.9 7.1 17.3 15.3 1987 10.3 8.9 16.9 24.2 10.7 0.8 14.5 24.4 1.6 10.8 7.1 3.6 1988 11.4 22.8 4.2 10 16.4 11 4.3 2.8 17.2 6.6 14.8 19.3 1989 17.3 17.8 24.3 11.2 7.4 6.7 0.3 1.2 2.8 30.2 0.9 3 1990 8.9 8.1 8.8 6.4 7.8 3.9 1.3 2 2 13.7 12.3 10.9 1991 10.7 12.6 S/D S/D S/D S/D 0 1.7 0.3 3.4 2.7 10 1992 12.8 10 8 7.7 5 3.4 0 3 7.4 10.7 17.8 S/D 1993 19.6 32.8 44.9 39.6 16.8 0.4 8.1 0.8 7.3 20.6 21.8 34.8 1994 36.2 38.3 47.1 34.5 18.6 6.8 2.7 22.2 13.5 4.5 32.8 9.6 1995 16.4 6.4 20.4 29.7 12.7 1.3 14.7 1.9 2.6 5.3 34.8 13.6 1996 18.9 20.4 34.8 10.2 4.8 2.8 3.3 3.7 3.2 15.8 6.1 7.2 1997 12.8 14.6 6.9 8.8 3.8 1.6 4 0.3 10.2 21.8 24.4 13.9 1998 23.1 12.4 28.1 17.1 12.2 6.2 3.2 0.2 2.1 16 12.7 8.1 1999 17.2 23.1 29.6 14.1 24.3 9.4 5.8 3.1 19.7 20.6 19.8 21.6 2000 14.1 22 27.2 18 25.4 11.6 1 4.8 23 1.4 1.2 9.5 2001 18.8 21.8 27.7 17.3 5.3 15.2 15.3 2.9 11.3 11.3 20.1 23.5 2002 8.9 34.7 28.3 31.7 17.5 0.7 7.3 2 1.8 27.3 8.8 11.2 2003 10 22.1 26.2 13.4 7.6 19.5 5.3 0.9 1.8 5.2 16.1 9.5 2004 32.8 2.7 15 29 18.2 4.1 4.3 0.2 3 22.8 22.8 17.7 2005 7.7 25.5 19.6 27.8 10.2 1.9 0.3 0 8.5 10 9.4 26.9 2006 8 23.8 19.2 26.3 12.3 5.2 1.3 0.4 4.8 34.7 26.5 25.7 2007 30.7 5.3 16 36.2 6.5 19.4 2.1 5.3 2.5 28 34.1 22 2008 15.2 S/D 36.6 15.9 13.6 2.6 6.8 5.6 1.7 22.8 13.9 2.5 2009 19.3 28 31.4 14 3.6 5.8 4.8 5 3.7 3.5 S/D S/D
- 2. Completando datos faltantes por el Método Racional Deductivo AÑO ENE FEB MAR ABR MAY JUN JUL AGO SEP OCT NOV DIC suma de pp pp promedio 1971 29.2 19.8 35.8 22.2 6.6 11.6 0.6 8.8 11.6 10.6 5.6 6.1 168.5 14.04 1972 15.3 11.3 33 14.2 11 7.8 2 16.5 4.6 11.1 30.1 3.9 160.8 13.40 1973 10 16.4 14.5 21.7 6.5 6.6 23 8.5 6.3 16.5 11.7 15.9 157.6 13.13 1974 22.2 20.2 33 10 2.5 3.2 11 11 3.4 14 27 13.7 171.2 14.27 1975 7.2 21.5 27.3 29.3 13 5 12 30 7 24 36.2 1.5 214 17.83 1976 16.6 18.5 22 48 7.6 15.8 18.4 12 2.5 3.3 7.4 36.6 208.7 17.39 1977 29.8 20.2 49.6 24.4 7.4 12.2 3.8 6.2 11.5 8 7.8 9.3 190.2 15.85 1978 10 6 41.7 18 15 9.8 1.2 6.7 3.7 6.4 4 8.3 130.8 10.90 1979 16 3.9 22.9 S/D S/D 0.7 0 3.1 21.4 6.2 6.5 2.7 1980 15.1 15.1 13.8 19.3 5.8 4.5 0.9 1 6 18.4 16.9 13.3 130.1 10.84 1981 9.1 29.9 31.5 7.4 5.4 5.4 3.1 6 0 15.8 5.5 9.6 128.7 10.73 1982 7.3 19.3 19.3 34.8 5.8 0.5 1.3 0.2 9.2 10.6 20.8 18.8 147.9 12.33 1983 38.6 26.6 21.8 9.3 5.4 2.2 1.6 2 2.2 13.5 15.2 18.3 156.7 13.06 1984 16.9 51.6 26.8 15.1 12.9 0.2 12.9 3.9 4.3 10 17.3 8.7 180.6 15.05 1985 8.4 3.3 3 21.3 10.4 1.9 2.2 9.8 1.7 23.6 2.9 9.8 98.3 8.19 1986 20.8 19.6 10.4 19.8 1.3 0.4 4.9 5.6 13.9 7.1 17.3 15.3 136.4 11.37 1987 10.3 8.9 16.9 24.2 10.7 0.8 14.5 24.4 1.6 10.8 7.1 3.6 133.8 11.15 1988 11.4 22.8 4.2 10 16.4 11 4.3 2.8 17.2 6.6 14.8 19.3 140.8 11.73 1989 17.3 17.8 24.3 11.2 7.4 6.7 0.3 1.2 2.8 30.2 0.9 3 123.1 10.26 1990 8.9 8.1 8.8 6.4 7.8 3.9 1.3 2 2 13.7 12.3 10.9 86.1 7.18 1991 10.7 12.6 S/D S/D S/D S/D 0 1.7 0.3 3.4 2.7 10 1992 12.8 10 8 7.7 5 3.4 0 3 7.4 10.7 17.8 S/D 1993 19.6 32.8 44.9 39.6 16.8 0.4 8.1 0.8 7.3 20.6 21.8 34.8 247.5 20.63 1994 36.2 38.3 47.1 34.5 18.6 6.8 2.7 22.2 13.5 4.5 32.8 9.6 266.8 22.23 1995 16.4 6.4 20.4 29.7 12.7 1.3 14.7 1.9 2.6 5.3 34.8 13.6 159.8 13.32 1996 18.9 20.4 34.8 10.2 4.8 2.8 3.3 3.7 3.2 15.8 6.1 7.2 131.2 10.93 1997 12.8 14.6 6.9 8.8 3.8 1.6 4 0.3 10.2 21.8 24.4 13.9 123.1 10.26 1998 23.1 12.4 28.1 17.1 12.2 6.2 3.2 0.2 2.1 16 12.7 8.1 141.4 11.78 1999 17.2 23.1 29.6 14.1 24.3 9.4 5.8 3.1 19.7 20.6 19.8 21.6 208.3 17.36 2000 14.1 22 27.2 18 25.4 11.6 1 4.8 23 1.4 1.2 9.5 159.2 13.27 2001 18.8 21.8 27.7 17.3 5.3 15.2 15.3 2.9 11.3 11.3 20.1 23.5 190.5 15.88 2002 8.9 34.7 28.3 31.7 17.5 0.7 7.3 2 1.8 27.3 8.8 11.2 180.2 15.02 2003 10 22.1 26.2 13.4 7.6 19.5 5.3 0.9 1.8 5.2 16.1 9.5 137.6 11.47 2004 32.8 2.7 15 29 18.2 4.1 4.3 0.2 3 22.8 22.8 17.7 172.6 14.38 2005 7.7 25.5 19.6 27.8 10.2 1.9 0.3 0 8.5 10 9.4 26.9 147.8 12.32 2006 8 23.8 19.2 26.3 12.3 5.2 1.3 0.4 4.8 34.7 26.5 25.7 188.2 15.68 2007 30.7 5.3 16 36.2 6.5 19.4 2.1 5.3 2.5 28 34.1 22 208.1 17.34 2008 15.2 S/D 36.6 15.9 13.6 2.6 6.8 5.6 1.7 22.8 13.9 2.5 2009 19.3 28 31.4 14 3.6 5.8 4.8 5 3.7 3.5 S/D S/D
- 3. AÑO ENE FEB MAR ABR MAY JUN JUL AGO SEP OCT NOV DIC suma % promedio 1971 207.95 141.01 254.96 158.10 47.00 82.61 4.27 62.67 82.61 75.49 39.88 43.44 1200.00 100.00 1972 114.18 84.33 246.27 105.97 82.09 58.21 14.93 123.13 34.33 82.84 224.63 29.10 1200.00 100.00 1973 76.14 124.87 110.41 165.23 49.49 50.25 175.13 64.72 47.97 125.63 89.09 121.07 1200.00 100.00 1974 155.61 141.59 231.31 70.09 17.52 22.43 77.10 77.10 23.83 98.13 189.25 96.03 1200.00 100.00 1975 40.37 120.56 153.08 164.30 72.90 28.04 67.29 168.22 39.25 134.58 202.99 8.41 1200.00 100.00 1976 95.45 106.37 126.50 275.99 43.70 90.85 105.80 69.00 14.37 18.97 42.55 210.45 1200.00 100.00 1977 188.01 127.44 312.93 153.94 46.69 76.97 23.97 39.12 72.56 50.47 49.21 58.68 1200.00 100.00 1978 91.74 55.05 382.57 165.14 137.61 89.91 11.01 61.47 33.94 58.72 36.70 76.15 1200.00 100.00 1979 16 3.9 22.9 154.31 77.88 0.7 0 3.1 21.4 6.2 6.5 2.7 1980 139.28 139.28 127.29 178.02 53.50 41.51 8.30 9.22 55.34 169.72 155.88 122.67 1200.00 100.00 1981 84.85 278.79 293.71 69.00 50.35 50.35 28.90 55.94 0.00 147.32 51.28 89.51 1200.00 100.00 1982 59.23 156.59 156.59 282.35 47.06 4.06 10.55 1.62 74.65 86.00 168.76 152.54 1200.00 100.00 1983 295.60 203.70 166.94 71.22 41.35 16.85 12.25 15.32 16.85 103.38 116.40 140.14 1200.00 100.00 1984 112.29 342.86 178.07 100.33 85.71 1.33 85.71 25.91 28.57 66.45 114.95 57.81 1200.00 100.00 1985 102.54 40.28 36.62 260.02 126.96 23.19 26.86 119.63 20.75 288.10 35.40 119.63 1200.00 100.00 1986 182.99 172.43 91.50 174.19 11.44 3.52 43.11 49.27 122.29 62.46 152.20 134.60 1200.00 100.00 1987 92.38 79.82 151.57 217.04 95.96 7.17 130.04 218.83 14.35 96.86 63.68 32.29 1200.00 100.00 1988 97.16 194.32 35.80 85.23 139.77 93.75 36.65 23.86 146.59 56.25 126.14 164.49 1200.00 100.00 1989 168.64 173.52 236.88 109.18 72.14 65.31 2.92 11.70 27.29 294.39 8.77 29.24 1200.00 100.00 1990 124.04 112.89 122.65 89.20 108.71 54.36 18.12 27.87 27.87 190.94 171.43 151.92 1200.00 100.00 1991 10.7 12.6 178.46 154.31 77.88 46.99 0 1.7 0.3 3.4 2.7 10 1992 12.8 10 8 7.7 5 3.4 0 3 7.4 10.7 17.8 104.59 1993 95.03 159.03 217.70 192.00 81.45 1.94 39.27 3.88 35.39 99.88 105.70 168.73 1200.00 100.00 1994 162.82 172.26 211.84 155.17 83.66 30.58 12.14 99.85 60.72 20.24 147.53 43.18 1200.00 100.00 1995 123.15 48.06 153.19 223.03 95.37 9.76 110.39 14.27 19.52 39.80 261.33 102.13 1200.00 100.00 1996 172.87 186.59 318.29 93.29 43.90 25.61 30.18 33.84 29.27 144.51 55.79 65.85 1200.00 100.00 1997 124.78 142.32 67.26 85.78 37.04 15.60 38.99 2.92 99.43 212.51 237.86 135.50 1200.00 100.00 1998 196.04 105.23 238.47 145.12 103.54 52.62 27.16 1.70 17.82 135.79 107.78 68.74 1200.00 100.00 1999 99.09 133.08 170.52 81.23 139.99 54.15 33.41 17.86 113.49 118.67 114.07 124.44 1200.00 100.00 2000 106.28 165.83 205.03 135.68 191.46 87.44 7.54 36.18 173.37 10.55 9.05 71.61 1200.00 100.00 2001 118.43 137.32 174.49 108.98 33.39 95.75 96.38 18.27 71.18 71.18 126.61 148.03 1200.00 100.00 2002 59.27 231.08 188.46 211.10 116.54 4.66 48.61 13.32 11.99 181.80 58.60 74.58 1200.00 100.00 2003 87.21 192.73 228.49 116.86 66.28 170.06 46.22 7.85 15.70 45.35 140.41 82.85 1200.00 100.00 2004 228.04 18.77 104.29 201.62 126.54 28.51 29.90 1.39 20.86 158.52 158.52 123.06 1200.00 100.00 2005 62.52 207.04 159.13 225.71 82.81 15.43 2.44 0.00 69.01 81.19 76.32 218.40 1200.00 100.00 2006 51.01 151.75 122.42 167.69 78.43 33.16 8.29 2.55 30.61 221.25 168.97 163.87 1200.00 100.00 2007 177.03 30.56 92.26 208.75 37.48 111.87 12.11 30.56 14.42 161.46 196.64 126.86 1200.00 100.00 2008 15.2 143.45 36.6 15.9 13.6 2.6 6.8 5.6 1.7 22.8 13.9 2.5 2009 19.3 28 31.4 14 3.6 5.8 4.8 5 3.7 3.5 117.77 104.59 Suma años completos 4292.01 4877.37 6067.49 5246.56 2647.83 1597.79 1425.95 1509.06 1666.20 3909.41 4004.34 3555.99 Promedio 126.24 143.45 178.46 154.31 77.88 46.99 41.94 44.38 49.01 114.98 117.77 104.59
- 4. ESTACIÓN HUANCABAMBA Datos Completos AÑO ENE FEB MAR ABR MAY JUN JUL AGO SEP OCT NOV DIC 1971 29.2 19.8 35.8 22.2 6.6 11.6 0.6 8.8 11.6 10.6 5.6 6.1 1972 15.3 11.3 33 14.2 11 7.8 2 16.5 4.6 11.1 30.1 3.9 1973 10 16.4 14.5 21.7 6.5 6.6 23 8.5 6.3 16.5 11.7 15.9 1974 22.2 20.2 33 10 2.5 3.2 11 11 3.4 14 27 13.7 1975 7.2 21.5 27.3 29.3 13 5 12 30 7 24 36.2 1.5 1976 16.6 18.5 22 48 7.6 15.8 18.4 12 2.5 3.3 7.4 36.6 1977 29.8 20.2 49.6 24.4 7.4 12.2 3.8 6.2 11.5 8 7.8 9.3 1978 10 6 41.7 18 15 9.8 1.2 6.7 3.7 6.4 4 8.3 1979 16 3.9 22.9 13.30 6.71 0.7 0 3.1 21.4 6.2 6.5 2.7 1980 15.1 15.1 13.8 19.3 5.8 4.5 0.9 1 6 18.4 16.9 13.3 1981 9.1 29.9 31.5 7.4 5.4 5.4 3.1 6 0 15.8 5.5 9.6 1982 7.3 19.3 19.3 34.8 5.8 0.5 1.3 0.2 9.2 10.6 20.8 18.8 1983 38.6 26.6 21.8 9.3 5.4 2.2 1.6 2 2.2 13.5 15.2 18.3 1984 16.9 51.6 26.8 15.1 12.9 0.2 12.9 3.9 4.3 10 17.3 8.7 1985 8.4 3.3 3 21.3 10.4 1.9 2.2 9.8 1.7 23.6 2.9 9.8 1986 20.8 19.6 10.4 19.8 1.3 0.4 4.9 5.6 13.9 7.1 17.3 15.3 1987 10.3 8.9 16.9 24.2 10.7 0.8 14.5 24.4 1.6 10.8 7.1 3.6 1988 11.4 22.8 4.2 10 16.4 11 4.3 2.8 17.2 6.6 14.8 19.3 1989 17.3 17.8 24.3 11.2 7.4 6.7 0.3 1.2 2.8 30.2 0.9 3 1990 8.9 8.1 8.8 6.4 7.8 3.9 1.3 2 2 13.7 12.3 10.9 1991 10.7 12.6 9.95 8.61 4.34 2.62 0 1.7 0.3 3.4 2.7 10 1992 12.8 10 8 7.7 5 3.4 0 3 7.4 10.7 17.8 8.19 1993 19.6 32.8 44.9 39.6 16.8 0.4 8.1 0.8 7.3 20.6 21.8 34.8 1994 36.2 38.3 47.1 34.5 18.6 6.8 2.7 22.2 13.5 4.5 32.8 9.6 1995 16.4 6.4 20.4 29.7 12.7 1.3 14.7 1.9 2.6 5.3 34.8 13.6 1996 18.9 20.4 34.8 10.2 4.8 2.8 3.3 3.7 3.2 15.8 6.1 7.2 1997 12.8 14.6 6.9 8.8 3.8 1.6 4 0.3 10.2 21.8 24.4 13.9 1998 23.1 12.4 28.1 17.1 12.2 6.2 3.2 0.2 2.1 16 12.7 8.1 1999 17.2 23.1 29.6 14.1 24.3 9.4 5.8 3.1 19.7 20.6 19.8 21.6 2000 14.1 22 27.2 18 25.4 11.6 1 4.8 23 1.4 1.2 9.5 2001 18.8 21.8 27.7 17.3 5.3 15.2 15.3 2.9 11.3 11.3 20.1 23.5 2002 8.9 34.7 28.3 31.7 17.5 0.7 7.3 2 1.8 27.3 8.8 11.2 2003 10 22.1 26.2 13.4 7.6 19.5 5.3 0.9 1.8 5.2 16.1 9.5 2004 32.8 2.7 15 29 18.2 4.1 4.3 0.2 3 22.8 22.8 17.7 2005 7.7 25.5 19.6 27.8 10.2 1.9 0.3 0 8.5 10 9.4 26.9 2006 8 23.8 19.2 26.3 12.3 5.2 1.3 0.4 4.8 34.7 26.5 25.7 2007 30.7 5.3 16 36.2 6.5 19.4 2.1 5.3 2.5 28 34.1 22 2008 15.2 18.63 36.6 15.9 13.6 2.6 6.8 5.6 1.7 22.8 13.9 2.5 2009 19.3 28 31.4 14 3.6 5.8 4.8 5 3.7 3.5 14.35 12.74 AMPLITUD DE REGISTRO = 39 años
- 5. A. Cuando la amplitud del registro sea mayor a los períodos de retorno solicitados utilice el criterio de interpolación, empleando la ecuación: 1. Procesamiento de datos: Criterio de Interpolación Períodos de Retorno: 2, 5, 10, 25 años N° Orden Ppmax 24 h Tr log (tr) p*log(tr) (log(tr))^2 p^2 1 22.2 40.00 1.6021 35.62 2.567 494.32 2 20.6 20.00 1.3010 26.83 1.693 425.39 3 17.8 13.33 1.1249 20.06 1.265 318.03 4 17.4 10.00 1.0000 17.39 1.000 302.47 5 17.4 8.00 0.9031 15.68 0.816 301.31 6 17.3 6.67 0.8239 14.29 0.679 300.73 7 15.9 5.71 0.7570 12.02 0.573 252.02 8 15.9 5.00 0.6990 11.08 0.489 251.22 9 15.7 4.44 0.6478 10.16 0.420 245.97 10 15.1 4.00 0.6021 9.06 0.362 226.50 11 15.0 3.64 0.5607 8.42 0.314 225.50 12 14.4 3.33 0.5229 7.52 0.273 206.88 13 14.3 3.08 0.4881 6.96 0.238 203.54 14 14.0 2.86 0.4559 6.40 0.208 197.17 15 13.4 2.67 0.4260 5.71 0.181 179.56 16 13.3 2.50 0.3979 5.30 0.158 177.33 17 13.3 2.35 0.3716 4.93 0.138 176.00 18 13.1 2.22 0.3468 4.55 0.120 172.48 19 13.1 2.11 0.3233 4.22 0.105 170.52 20 13.0 2.00 0.3010 3.91 0.091 168.63 21 12.3 1.90 0.2798 3.45 0.078 151.91 22 12.3 1.82 0.2596 3.20 0.067 151.70 23 12.2 1.74 0.2403 2.93 0.058 148.41 24 11.8 1.67 0.2218 2.61 0.049 138.85 25 11.7 1.60 0.2041 2.40 0.042 137.67 26 11.5 1.54 0.1871 2.15 0.035 131.48 27 11.4 1.48 0.1707 1.94 0.029 129.20 28 11.2 1.43 0.1549 1.73 0.024 124.32 29 10.9 1.38 0.1397 1.53 0.020 119.54 30 10.9 1.33 0.1249 1.36 0.016 118.81 31 10.8 1.29 0.1107 1.20 0.012 117.54 32 10.7 1.25 0.0969 1.04 0.009 115.03 33 10.3 1.21 0.0835 0.86 0.007 105.23 34 10.3 1.18 0.0706 0.72 0.005 105.23 35 8.6 1.14 0.0580 0.50 0.003 74.26 36 8.2 1.11 0.0458 0.37 0.002 67.10 37 7.8 1.08 0.0339 0.27 0.001 61.35 38 7.2 1.05 0.0223 0.16 0.000 51.48 39 5.6 1.03 0.0110 0.06 0.000 31.10 )(log TeBAPTe
- 6. y = 8.827x + 9.358 R² = 0.911 0.0 5.0 10.0 15.0 20.0 25.0 0.0 0.2 0.4 0.6 0.8 1.0 1.2 1.4 1.6 1.8 Precipitación8mm) Log (Tr) ANÁLISIS DE DATOS: USO DE UNA REGRESIÓN Estadísticas de la regresión Coeficiente de correlación múltiple 0.954686696 Coeficiente de determinación R^2 0.911426688 R^2 ajustado 0.909032815 Error típico 1.055532442 Observaciones 39 ANÁLISIS DE VARIANZA Grados de libertad Suma de cuadrados Promedio de los cuadrados F Valor crítico de F Regresión 1 424.19325 424.19325 380.733053 4.5611E-21 Residuos 37 41.2235032 1.11414874 Total 38 465.416753 Coeficientes Error típico Estadístico t Probabilidad Inferior 95% Superior 95% Inferior 95.0% Superior 95.0% Intercepción 9.358879739 0.25249927 37.0649772 7.3608E-31 8.84726762 9.87049186 8.84726762 9.87049186 Variable X 1 8.827580614 0.45240917 19.512382 4.5611E-21 7.91091256 9.74424867 7.91091256 9.74424867
- 7. Entonces, la ecuación de ajuste mediante el criterio de interpolación es: Coeficientes A= 9.36 Intercepción 9.3588797 B= 8.83 Variable X 1 8.8275806