INFOGRAPHIC: 2012 BrandZ Top 100 Most Valuable Global Brands
•
2 gefällt mir•1,655 views

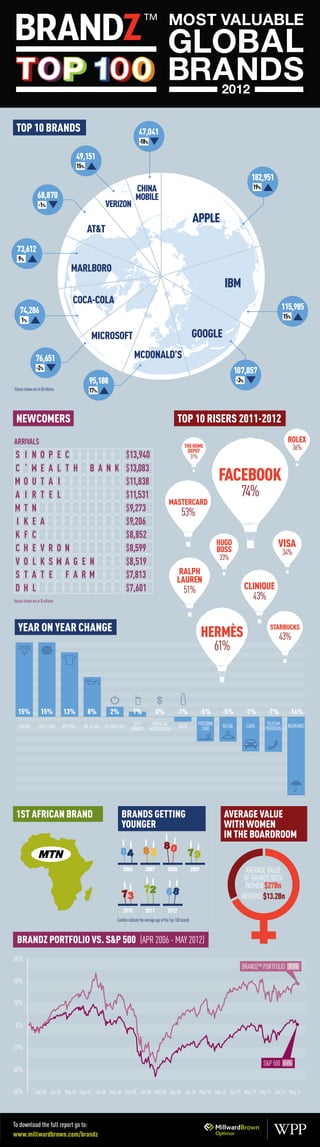
This document provides information on the top brands from 2012, including: 1) The top 10 brands by value are Apple, Google, Microsoft, Coca-Cola, IBM, GE, McDonald's, Samsung, Toyota, and Verizon. 2) Some of the top rising brands from 2011-2012 included Facebook, Mastercard, Hugo Boss, Ralph Lauren, Clinique, and Hermes. 3) Brands are categorized by industry and regions, with information on changes in brand value from the previous year.

Empfohlen
Weitere ähnliche Inhalte
Ähnlich wie INFOGRAPHIC: 2012 BrandZ Top 100 Most Valuable Global Brands
Ähnlich wie INFOGRAPHIC: 2012 BrandZ Top 100 Most Valuable Global Brands (12)
Mehr von Kantar
Mehr von Kantar (20)
INFOGRAPHIC: 2012 BrandZ Top 100 Most Valuable Global Brands
- 1. TOP 10 BRANDS 47,041 -18% 49,151 15% 182,951 CHINA 19% 68,870 MOBILE -1% VERIZON APPLE AT&T 73,612 9% MARLBORO IBM COCA-COLA 74,286 115,985 15% 1% MICROSOFT GOOGLE 76,651 MCDONALD’S -2% 107,857 95,188 -3% Values shown are in $ millions 17% NEWCOMERS TOP 10 RISERS 2011-2012 ROLEX THE HOME 36% DEPOT S I NO P E C $13,940 31% C ‘ E A L T H B A N K $13,083 M M O U T A I $11,838 FACEBOOK A I R T E L $11,531 74% MASTERCARD M T N $9,273 53% I K E A $9,206 K F C $8,852 C H E V RON $8,599 HUGO BOSS VISA 34% 33% V O L K S A G E N $8,519 M S T A T E F ARM $7,813 RALPH LAUREN D H L $7,601 51% CLINIQUE Values shown are in $ millions 43% YEAR ON YEAR CHANGE HERMÈS STARBUCKS 43% 61% 15% 15% 13% 8% 2% 1% 0% -1% -5% -5% -7% -7% -16% LUXURY FAST FOOD APPAREL OIL & GAS TECHNOLOGY SOFT FINANCIAL BEER PERSONAL RETAIL CARS TELECOM INSURANCE DRINKS INSTITUTIONS CARE PROVIDERS 1ST AFRICAN BRAND BRANDS GETTING AVERAGE VALUE YOUNGER WITH WOMEN IN THE BOARDROOM 2006 2007 2008 2009 AVERAGE VALUE OF BRANDS WITH WOMEN $27Bn WITHOUT $13.2Bn 2010 2011 2012 Candles indicate the average age of the Top 100 brands BRANDZ PORTFOLIO VS. S&P 500 (APR 2006 - MAY 2012) 60% BRANDZ™ PORTFOLIO 37.5% 40% 20% 0% -20% S&P 500 0.4% -40% -60% Sep 06 Jan 07 May 07 Sep 07 Jan 08 May 08 Sep 08 Jan 09 May 09 Sep 09 Jan 10 May 10 Sep 10 Jan 11 May 11 Sep 11 Jan 12 May 12 To download the full report go to: www.millwardbrown.com/brandz