SlideShare a Scribd company logo
1 of 21
Download to read offline
Gary Community School Corp, Gary 4690
Corporation Results State
Indicator '12-'13 '13-'14 '14-'15 '15-'16 Total
A-F Accountability Grade F F F
Student Enrollment 8,922 8,594 7,566 6,491 1,046,026
Non-Waiver Grad Rate 52.0 70.4 73.6 82.74
College and Career Readiness Rate 13.1 20.9 N/A
Number of Certified Teachers 553 477 409 63,167
Number of National Board Certified
Teachers
0 1 1 192
Total Expenditure Per Pupil Three Year
Average
$14,936 $16,373 $12,636 $11,052
Percent Academic Achievment
Expenditures
55.8 59.3 51.5 48.7
Percent Instructional Support Expenditures 10 10.7 9.7 8.2
Percent Overhead and Operations
Expenditures
27.3 21.2 26.5 23.2
Percent Non-Operating Expenditures 6.8 8.9 12.3 19.9
Teacher Salary Range - Minimum $41,503 $58,479 $35,252 $24,153
Teacher Salary Range - Maximum $65,263 $65,599 $62,920 $89,516
Percent of Students in Special Education 10.6 15.4 14.0 14.9
Percent of Students in Gifted and Talented
Education
6.5 7.3 2.1 14.4
Percent of Instruction Delivered Through
Vocation Education
1.6 4.3 1.8 5.7
Percent of Students Receiving Free or
Reduced Price Lunches
80.3 64.6 80.3 49.2
Percent of Limited English Proficiency
Students
0.2 0.2 0.1 5.5
Total ISTEP+ Remediation Funding $50,953 $48,536 $37,210 $6,000,150
Intra District Mobilty 8 6.2 5.1 0.5
Inter District Mobility 11.7 5.9 15.3 11.5
Corporation Goals for Expenditure Categories in Indiana Code 20-42.5-3-5
1 of 21
*** Suppressed
Gary Community School Corp
2015 Annual Performance Report
Benjamin Banneker Achievement Ctr, Gary 4053
School Results State
Indicator '12-'13 '13-'14 '14-'15 '15-'16 Total
A-F Accountability Grade A A A
Student Enrollment 552 602 518 485 1,046,026
Percentage of Students Passing IREAD 100.0 100.0 100.0 90.1
* Grade 3 Percent Passing ISTEP+ Math
Standard
94.7 95.4 58.7 62.6
* Grade 3 Percent Passing ISTEP+
Language Arts Standard
98.2 96.9 89.3 73.2
* Grade 4 Percent Passing ISTEP+ Math
Standard
98.1 73.1 43.6 65.2
* Grade 4 Percent Passing ISTEP+
Language Arts Standard
98.1 96.2 78.2 70.4
* Grade 5 Percent Passing ISTEP+ Math
Standard
94.9 90.2 87.5 68.4
* Grade 5 Percent Passing ISTEP+
Language Arts Standard
76.3 98.0 54.2 65.2
* Grade 6 Percent Passing ISTEP+ Math
Standard
96.4 96.8 34.1 61.9
* Grade 6 Percent Passing ISTEP+
Language Arts Standard
96.4 88.7 19.6 65.8
* Grade 6 Percent Passing ISTEP+ Science
Standard
85.5 59.7 *** 66.9
* Grade 7 Percent Passing ISTEP+ Math
Standard
85.2 83.3 28.6 54.1
* Grade 7 Percent Passing ISTEP+
Language Arts Standard
85.2 90.7 67.9 65.7
* Grade 8 Percent Passing ISTEP+ Math
Standard
82.0 92.0 47.9 54.2
* Grade 8 Percent Passing ISTEP+
Language Arts Standard
85.7 94.0 83.3 63.7
Percent of 8th Graders in Algebra I 0 0 0 25.9
Pupil Enrollment to Certified Employee
Ratio
17 17 16 13
Attendance Rate 98.6 96.5 97.5 95.8
Number of Students with More Than 10
Unexcused Days Absent
1 85 45 71,716
Number of Students absent greater than
10% of School Year
9 30 6 79,014
Number of Students Suspended 1 2 90,803
Number of Out of School Suspensions 1 2 108,934
* In 2014-15 Indiana transitioned to new, more rigorous college-and-career ready standards and a new statewide
assessment to measure these standards. Therefore, results are not comparable to previous data.
2 of 21
*** Suppressed
Gary Community School Corp
2015 Annual Performance Report
Beveridge Elementary School, Gary 4061
School Results State
Indicator '12-'13 '13-'14 '14-'15 '15-'16 Total
A-F Accountability Grade F F F
Student Enrollment 340 361 675 494 1,046,026
Percentage of Students Passing IREAD 49.3 83.8 64.9 90.1
* Grade 3 Percent Passing ISTEP+ Math
Standard
39.6 48.6 12.4 62.6
* Grade 3 Percent Passing ISTEP+
Language Arts Standard
55.8 56.8 26.6 73.2
* Grade 4 Percent Passing ISTEP+ Math
Standard
25.0 30.4 12.3 65.2
* Grade 4 Percent Passing ISTEP+
Language Arts Standard
51.4 60.9 20.0 70.4
* Grade 4 Percent Passing ISTEP+ Science
Standard
11.4 26.1 24.7 71.4
* Grade 5 Percent Passing ISTEP+ Math
Standard
56.3 59.3 18.5 68.4
* Grade 5 Percent Passing ISTEP+
Language Arts Standard
25.0 40.0 17.3 65.2
* Grade 5 Percent Passing ISTEP+ Social
Science Standard
9.4 16.0 *** 70.9
* Grade 6 Percent Passing ISTEP+ Math
Standard
23.1 42.9 7.7 61.9
* Grade 6 Percent Passing ISTEP+
Language Arts Standard
22.5 35.7 11.5 65.8
* Grade 6 Percent Passing ISTEP+ Science
Standard
5.0 3.7 13.0 66.9
Pupil Enrollment to Certified Employee
Ratio
11 12 17 13
Attendance Rate 97.6 95.6 95.5 95.8
Number of Students with More Than 10
Unexcused Days Absent
0 82 151 71,716
Number of Students absent greater than
10% of School Year
4 32 48 79,014
Number of Students Suspended 20 28 62 90,803
Number of Out of School Suspensions 24 35 73 108,934
* In 2014-15 Indiana transitioned to new, more rigorous college-and-career ready standards and a new statewide
assessment to measure these standards. Therefore, results are not comparable to previous data.
3 of 21
*** Suppressed
Gary Community School Corp
2015 Annual Performance Report
Dr Bernard C Watson Acad for Boys, Gary 4081
School Results State
Indicator '12-'13 '13-'14 '14-'15 '15-'16 Total
A-F Accountability Grade F C C
Student Enrollment 198 180 137 130 1,046,026
Percentage of Students Passing IREAD 65.5 86.2 91.7 90.1
* Grade 3 Percent Passing ISTEP+ Math
Standard
34.8 57.1 47.8 62.6
* Grade 3 Percent Passing ISTEP+
Language Arts Standard
60.9 57.1 47.8 73.2
* Grade 4 Percent Passing ISTEP+ Math
Standard
41.2 57.9 10.0 65.2
* Grade 4 Percent Passing ISTEP+
Language Arts Standard
80.0 73.7 19.0 70.4
* Grade 4 Percent Passing ISTEP+ Science
Standard
31.3 10.5 14.3 71.4
* Grade 5 Percent Passing ISTEP+ Math
Standard
55.0 73.3 21.1 68.4
* Grade 5 Percent Passing ISTEP+
Language Arts Standard
26.3 57.1 15.8 65.2
* Grade 6 Percent Passing ISTEP+ Math
Standard
47.1 73.3 7.1 61.9
* Grade 6 Percent Passing ISTEP+
Language Arts Standard
17.6 40.0 21.4 65.8
* Grade 6 Percent Passing ISTEP+ Science
Standard
5.9 6.7 7.1 66.9
Pupil Enrollment to Certified Employee
Ratio
6 5 5 13
Attendance Rate 96.3 94.0 91.5 95.8
Number of Students with More Than 10
Unexcused Days Absent
0 71 78 71,716
Number of Students absent greater than
10% of School Year
8 24 41 79,014
Number of Students Suspended 3 12 30 90,803
Number of Out of School Suspensions 3 15 48 108,934
Number of In School Suspensions 1 96,792
* In 2014-15 Indiana transitioned to new, more rigorous college-and-career ready standards and a new statewide
assessment to measure these standards. Therefore, results are not comparable to previous data.
4 of 21
*** Suppressed
Gary Community School Corp
2015 Annual Performance Report
Frankie W McCullough Acad for Girl, Gary 4086
School Results State
Indicator '12-'13 '13-'14 '14-'15 '15-'16 Total
A-F Accountability Grade A A A
Student Enrollment 440 472 429 453 1,046,026
Percentage of Students Passing IREAD 68.7 65.6 98.4 90.1
* Grade 3 Percent Passing ISTEP+ Math
Standard
96.4 61.7 98.4 62.6
* Grade 3 Percent Passing ISTEP+
Language Arts Standard
100.0 69.5 62.1 73.2
* Grade 4 Percent Passing ISTEP+ Math
Standard
84.8 86.3 46.0 65.2
* Grade 4 Percent Passing ISTEP+
Language Arts Standard
87.0 80.0 44.0 70.4
* Grade 4 Percent Passing ISTEP+ Science
Standard
71.7 84.3 54.0 71.4
* Grade 5 Percent Passing ISTEP+ Math
Standard
100.0 100.0 89.4 68.4
* Grade 5 Percent Passing ISTEP+
Language Arts Standard
100.0 96.8 89.1 65.2
* Grade 6 Percent Passing ISTEP+ Math
Standard
100.0 100.0 78.0 61.9
* Grade 6 Percent Passing ISTEP+
Language Arts Standard
100.0 91.7 55.0 65.8
* Grade 6 Percent Passing ISTEP+ Science
Standard
33.3 83.3 77.5 66.9
* Grade 7 Percent Passing ISTEP+ Math
Standard
88.5 100.0 78.8 54.1
* Grade 7 Percent Passing ISTEP+
Language Arts Standard
57.7 91.7 66.7 65.7
Pupil Enrollment to Certified Employee
Ratio
14 16 15 13
Attendance Rate 98.2 98.0 97.4 95.8
Number of Students with More Than 10
Unexcused Days Absent
0 38 49 71,716
Number of Students absent greater than
10% of School Year
2 9 4 79,014
Number of Students Suspended 2 90,803
Number of Out of School Suspensions 2 108,934
* In 2014-15 Indiana transitioned to new, more rigorous college-and-career ready standards and a new statewide
assessment to measure these standards. Therefore, results are not comparable to previous data.
5 of 21
*** Suppressed
Gary Community School Corp
2015 Annual Performance Report
Jefferson Elementary School, Gary 4104
School Results State
Indicator '12-'13 '13-'14 '14-'15 '15-'16 Total
A-F Accountability Grade F F F
Student Enrollment 488 464 482 459 1,046,026
Percentage of Students Passing IREAD 56.0 67.4 76.7 90.1
* Grade 3 Percent Passing ISTEP+ Math
Standard
47.6 44.9 8.5 62.6
* Grade 3 Percent Passing ISTEP+
Language Arts Standard
66.1 44.9 22.2 73.2
* Grade 4 Percent Passing ISTEP+ Math
Standard
48.8 28.9 15.1 65.2
* Grade 4 Percent Passing ISTEP+
Language Arts Standard
60.0 52.6 19.7 70.4
* Grade 4 Percent Passing ISTEP+ Science
Standard
32.5 23.7 13.7 71.4
* Grade 5 Percent Passing ISTEP+ Math
Standard
35.0 36.7 10.7 68.4
* Grade 5 Percent Passing ISTEP+
Language Arts Standard
32.8 30.0 7.4 65.2
* Grade 5 Percent Passing ISTEP+ Social
Science Standard
17.2 10.3 *** 70.9
* Grade 6 Percent Passing ISTEP+ Math
Standard
44.4 45.7 2.9 61.9
* Grade 6 Percent Passing ISTEP+
Language Arts Standard
24.1 32.6 8.3 65.8
* Grade 6 Percent Passing ISTEP+ Science
Standard
7.4 8.7 8.6 66.9
Pupil Enrollment to Certified Employee
Ratio
14 15 13 13
Attendance Rate 97.5 95.4 94.0 95.8
Number of Students with More Than 10
Unexcused Days Absent
6 114 182 71,716
Number of Students absent greater than
10% of School Year
7 42 66 79,014
Number of Students Suspended 12 22 35 90,803
Number of Out of School Suspensions 13 24 45 108,934
* In 2014-15 Indiana transitioned to new, more rigorous college-and-career ready standards and a new statewide
assessment to measure these standards. Therefore, results are not comparable to previous data.
6 of 21
*** Suppressed
Gary Community School Corp
2015 Annual Performance Report
Bailly Preparatory Academy, Gary 4105
School Results State
Indicator '12-'13 '13-'14 '14-'15 '15-'16 Total
A-F Accountability Grade D B B
Student Enrollment 588 506 371 428 1,046,026
Percentage of Students Passing IREAD 62.7 60.3 85.0 90.1
* Grade 3 Percent Passing ISTEP+ Math
Standard
50.0 63.5 61.0 62.6
* Grade 3 Percent Passing ISTEP+
Language Arts Standard
59.0 63.5 65.5 73.2
* Grade 4 Percent Passing ISTEP+ Math
Standard
73.0 79.2 47.4 65.2
* Grade 4 Percent Passing ISTEP+
Language Arts Standard
74.6 75.0 43.2 70.4
* Grade 4 Percent Passing ISTEP+ Science
Standard
25.4 14.6 13.2 71.4
* Grade 5 Percent Passing ISTEP+ Math
Standard
84.9 78.4 41.7 68.4
* Grade 5 Percent Passing ISTEP+
Language Arts Standard
71.7 64.9 33.3 65.2
* Grade 5 Percent Passing ISTEP+ Social
Science Standard
22.6 21.6 *** 70.9
* Grade 6 Percent Passing ISTEP+ Math
Standard
76.1 89.1 34.1 61.9
* Grade 6 Percent Passing ISTEP+
Language Arts Standard
58.7 76.1 45.5 65.8
* Grade 6 Percent Passing ISTEP+ Science
Standard
21.7 34.8 15.9 66.9
Pupil Enrollment to Certified Employee
Ratio
14 12 11 13
Attendance Rate 94.1 95.1 96.3 95.8
Number of Students with More Than 10
Unexcused Days Absent
158 77 78 71,716
Number of Students absent greater than
10% of School Year
61 15 32 79,014
Number of Students Suspended 78 47 63 90,803
Number of Expulsions and Suspensions
Involving Drugs, Weapons, or Alcohol
3 0 1 6,705
Number of Out of School Suspensions 97 63 84 108,934
* In 2014-15 Indiana transitioned to new, more rigorous college-and-career ready standards and a new statewide
assessment to measure these standards. Therefore, results are not comparable to previous data.
7 of 21
*** Suppressed
Gary Community School Corp
2015 Annual Performance Report
New Tech Innovative Institute, Gary 4113
School Results State
Indicator '12-'13 '13-'14 '14-'15 '15-'16 Total
A-F Accountability Grade D F F
Student Enrollment 159 294 404 242 1,046,026
Number of Students in Career and
Technical Program
224 208 167,961
Percentage of Students in Career and
Technical Program
76.2 51.5 49.15
Percent Passing ECA Math Standard 70.7 30.1 13.4 68.9
Percent Passing ECA English Language Arts
Standard
40.0 39.1 42.9 77.9
Percent of Graduates Who Have Passsed
Both ECA Standards
73.03 82.75
Percent of Graduates Granted Waivers for
the ECA
12.2 7.1
SAT Average Score for Graduating Class 721.0 987.6
Percent of 12th Graders Taking SAT 19.8 45.9
Percent of Graduates Pursuing College 72.0 78.3
Pupil Enrollment to Certified Employee
Ratio
4 17 20 13
Graduation Rate 83.1 88.9
Attendance Rate 97.2 96.6 94.6 95.8
Number of Students with More Than 10
Unexcused Days Absent
15 52 127 71,716
Number of Students absent greater than
10% of School Year
4 13 43 79,014
Number of Students Retained in the 9th
Grade
2 12 16 886
Number of Students Who Have Dropped
Out
4 3,607
Number of Students Suspended 24 93 84 90,803
Number of Students Expelled 14 2,886
Number of Expulsions and Suspensions
Involving Drugs, Weapons, or Alcohol
2 10 3 6,705
Number of Out of School Suspensions 29 176 108 108,934
* In 2014-15 Indiana transitioned to new, more rigorous college-and-career ready standards and a new statewide
assessment to measure these standards. Therefore, results are not comparable to previous data.
8 of 21
*** Suppressed
Gary Community School Corp
2015 Annual Performance Report
Jacques Marquette Elem School, Gary 4121
School Results State
Indicator '12-'13 '13-'14 '14-'15 '15-'16 Total
A-F Accountability Grade F F F
Student Enrollment 710 644 576 441 1,046,026
Percentage of Students Passing IREAD 61.2 83.3 78.6 90.1
* Grade 3 Percent Passing ISTEP+ Math
Standard
60.4 54.0 31.3 62.6
* Grade 3 Percent Passing ISTEP+
Language Arts Standard
72.9 67.3 42.3 73.2
* Grade 4 Percent Passing ISTEP+ Math
Standard
51.4 38.5 16.3 65.2
* Grade 4 Percent Passing ISTEP+
Language Arts Standard
77.8 72.3 35.2 70.4
* Grade 4 Percent Passing ISTEP+ Science
Standard
36.6 26.2 22.8 71.4
* Grade 5 Percent Passing ISTEP+ Math
Standard
39.1 71.2 55.1 68.4
* Grade 5 Percent Passing ISTEP+
Language Arts Standard
60.9 67.8 27.1 65.2
* Grade 6 Percent Passing ISTEP+ Math
Standard
53.2 28.1 3.7 61.9
* Grade 6 Percent Passing ISTEP+
Language Arts Standard
48.7 53.1 35.2 65.8
* Grade 6 Percent Passing ISTEP+ Science
Standard
20.5 12.5 13.2 66.9
Pupil Enrollment to Certified Employee
Ratio
17 16 14 13
Attendance Rate 98.6 96.1 94.7 95.8
Number of Students with More Than 10
Unexcused Days Absent
0 135 142 71,716
Number of Students absent greater than
10% of School Year
3 30 46 79,014
Number of Students Suspended 7 1 23 90,803
Number of Out of School Suspensions 11 1 33 108,934
* In 2014-15 Indiana transitioned to new, more rigorous college-and-career ready standards and a new statewide
assessment to measure these standards. Therefore, results are not comparable to previous data.
9 of 21
*** Suppressed
Gary Community School Corp
2015 Annual Performance Report
Dunbar-Pulaski Academic & Career, Gary 4145
School Results State
Indicator '12-'13 '13-'14 '14-'15 '15-'16 Total
A-F Accountability Grade F F F
Student Enrollment 298 397 674 1,046,026
Number of Students in Career and
Technical Program
147 167,961
Percentage of Students in Career and
Technical Program
21.8 49.15
* Grade 7 Percent Passing ISTEP+ Math
Standard
27.1 30.5 5.3 54.1
* Grade 7 Percent Passing ISTEP+
Language Arts Standard
17.4 27.0 19.2 65.7
* Grade 7 Percent Passing ISTEP+ Social
Science Standard
17.8 10.0 *** 69.8
* Grade 8 Percent Passing ISTEP+ Math
Standard
25.0 24.1 2.7 54.2
* Grade 8 Percent Passing ISTEP+
Language Arts Standard
33.8 25.7 13.7 63.7
Percent of 8th Graders in Algebra I 0 0 0 25.9
Pupil Enrollment to Certified Employee
Ratio
9 12 15 13
Attendance Rate 95.3 92.9 93.2 95.8
Number of Students with More Than 10
Unexcused Days Absent
1 115 238 71,716
Number of Students absent greater than
10% of School Year
39 64 129 79,014
Number of Students Suspended 69 93 55 90,803
Number of Expulsions and Suspensions
Involving Drugs, Weapons, or Alcohol
0 5 3 6,705
Number of Out of School Suspensions 97 109 72 108,934
* In 2014-15 Indiana transitioned to new, more rigorous college-and-career ready standards and a new statewide
assessment to measure these standards. Therefore, results are not comparable to previous data.
10 of 21
*** Suppressed
Gary Community School Corp
2015 Annual Performance Report
Glen Park Acad for Excel in Lrn, Gary 4155
School Results State
Indicator '12-'13 '13-'14 '14-'15 '15-'16 Total
A-F Accountability Grade C D D
Student Enrollment 516 482 790 638 1,046,026
Percentage of Students Passing IREAD 73.1 75.0 74.2 90.1
* Grade 3 Percent Passing ISTEP+ Math
Standard
67.2 54.2 17.2 62.6
* Grade 3 Percent Passing ISTEP+
Language Arts Standard
77.0 66.7 33.3 73.2
* Grade 4 Percent Passing ISTEP+ Math
Standard
53.2 58.7 16.0 65.2
* Grade 4 Percent Passing ISTEP+
Language Arts Standard
68.1 80.4 36.5 70.4
* Grade 4 Percent Passing ISTEP+ Science
Standard
46.8 47.8 23.6 71.4
* Grade 5 Percent Passing ISTEP+ Math
Standard
88.9 87.0 46.2 68.4
* Grade 5 Percent Passing ISTEP+
Language Arts Standard
87.3 87.0 42.9 65.2
* Grade 5 Percent Passing ISTEP+ Social
Science Standard
60.3 47.8 *** 70.9
* Grade 6 Percent Passing ISTEP+ Math
Standard
74.4 78.0 20.0 61.9
* Grade 6 Percent Passing ISTEP+
Language Arts Standard
69.8 74.0 44.4 65.8
* Grade 6 Percent Passing ISTEP+ Science
Standard
30.2 32.7 21.0 66.9
Pupil Enrollment to Certified Employee
Ratio
14 14 17 13
Attendance Rate 97.4 95.8 95.8 95.8
Number of Students with More Than 10
Unexcused Days Absent
0 110 157 71,716
Number of Students absent greater than
10% of School Year
4 31 43 79,014
Number of Students Suspended 23 15 43 90,803
Number of Expulsions and Suspensions
Involving Drugs, Weapons, or Alcohol
0 0 1 6,705
Number of Out of School Suspensions 31 17 88 108,934
* In 2014-15 Indiana transitioned to new, more rigorous college-and-career ready standards and a new statewide
assessment to measure these standards. Therefore, results are not comparable to previous data.
11 of 21
*** Suppressed
Gary Community School Corp
2015 Annual Performance Report
West Side Leadership Academy, Gary 4163
School Results State
Indicator '12-'13 '13-'14 '14-'15 '15-'16 Total
A-F Accountability Grade C
Student Enrollment 1,234 1,075 885 761 1,046,026
Number of Students in Career and
Technical Program
169 352 356 167,961
Percentage of Students in Career and
Technical Program
13.7 32.7 40.2 49.15
Percent Passing ECA Math Standard 5.7 46.1 39.2 68.9
Percent Passing ECA English Language Arts
Standard
24.0 37.3 39.9 77.9
Percent of Graduates Who Have Passsed
Both ECA Standards
49.50 72.73 76.83 82.75
Percent of Graduates Granted Waivers for
the ECA
28.2 21.3 11.3 7.1
Number of International Baccalaureate
Diplomas
0 0 0 657
Percent of Students Taking Advanced
Placement Exams
2.8 5.8 12.2 3.9
Percent of AP Test with Score of 3,4,5 6.9 0.0 0.8 49.7
SAT Average Score for Graduating Class 762.8 787.0 697.6 987.6
Percent of 12th Graders Taking SAT 32.7 22.8 22.9 45.9
Percent Core 40 with Honors Diploma 4.8 9.8 7.7 37.2
Percent Core 40 Diploma 72.7 86.9 99.3 87.1
Percent of Graduates Pursuing College 75.2 72.4 79.1 78.3
Pupil Enrollment to Certified Employee
Ratio
12 17 12 13
Graduation Rate 69.0 92.4 86.6 88.9
Attendance Rate 90.7 85.0 82.3 95.8
Number of Students with More Than 10
Unexcused Days Absent
521 706 671 71,716
Number of Students absent greater than
10% of School Year
369 509 536 79,014
Number of Students Retained in the 9th
Grade
1 2 7 886
Number of Students Who Have Dropped
Out
18 3 0 3,607
Number of Students Suspended 430 141 173 90,803
* In 2014-15 Indiana transitioned to new, more rigorous college-and-career ready standards and a new statewide
assessment to measure these standards. Therefore, results are not comparable to previous data.
12 of 21
*** Suppressed
Gary Community School Corp
2015 Annual Performance Report
West Side Leadership Academy, Gary 4163
School Results State
Indicator '12-'13 '13-'14 '14-'15 '15-'16 Total
Number of Expulsions and Suspensions
Involving Drugs, Weapons, or Alcohol
32 9 10 6,705
Number of Out of School Suspensions 946 275 252 108,934
* In 2014-15 Indiana transitioned to new, more rigorous college-and-career ready standards and a new statewide
assessment to measure these standards. Therefore, results are not comparable to previous data.
13 of 21
*** Suppressed
Gary Community School Corp
2015 Annual Performance Report
Wm A Wirt/Emerson VPA, Gary 4168
School Results State
Indicator '12-'13 '13-'14 '14-'15 '15-'16 Total
A-F Accountability Grade D C C
Student Enrollment 585 612 595 639 1,046,026
Number of Students in Career and
Technical Program
159 112 167,961
Percentage of Students in Career and
Technical Program
26.0 18.8 49.15
* Grade 5 Percent Passing ISTEP+ Math
Standard
70.6 84.6 11.1 68.4
* Grade 5 Percent Passing ISTEP+
Language Arts Standard
66.7 84.6 44.4 65.2
* Grade 6 Percent Passing ISTEP+ Math
Standard
67.9 54.8 27.3 61.9
* Grade 6 Percent Passing ISTEP+
Language Arts Standard
75.0 66.1 42.4 65.8
* Grade 6 Percent Passing ISTEP+ Science
Standard
35.7 40.3 45.5 66.9
* Grade 7 Percent Passing ISTEP+ Math
Standard
75.3 56.9 9.8 54.1
* Grade 7 Percent Passing ISTEP+
Language Arts Standard
70.1 65.3 37.8 65.7
* Grade 8 Percent Passing ISTEP+ Math
Standard
50.6 64.8 25.8 54.2
* Grade 8 Percent Passing ISTEP+
Language Arts Standard
70.8 74.6 57.6 63.7
Percent of 8th Graders in Algebra I 0 0 0 25.9
Percent Passing ECA Math Standard 33.7 15.8 58.6 68.9
Percent Passing ECA English Language Arts
Standard
77.2 78.0 64.6 77.9
Percent of Graduates Who Have Passsed
Both ECA Standards
88.89 97.26 92.59 82.75
Percent of Graduates Granted Waivers for
the ECA
6.7 2.7 7.4 7.1
Number of International Baccalaureate
Diplomas
0 0 0 657
Percent of Students Taking Advanced
Placement Exams
6.0 8.2 8.4 3.9
Percent of AP Test with Score of 3,4,5 4.0 4.6 4.2 49.7
SAT Average Score for Graduating Class 842.5 780.0 848.6 987.6
Percent of 12th Graders Taking SAT 64.7 65.1 71.4 45.9
* In 2014-15 Indiana transitioned to new, more rigorous college-and-career ready standards and a new statewide
assessment to measure these standards. Therefore, results are not comparable to previous data.
14 of 21
*** Suppressed
Gary Community School Corp
2015 Annual Performance Report
Wm A Wirt/Emerson VPA, Gary 4168
School Results State
Indicator '12-'13 '13-'14 '14-'15 '15-'16 Total
Percent Core 40 with Honors Diploma 20.0 5.5 14.8 37.2
Percent Core 40 Diploma 90.0 94.5 92.6 87.1
Percent of Graduates Pursuing College 81.7 90.4 93.8 78.3
Pupil Enrollment to Certified Employee
Ratio
13 12 12 13
Graduation Rate 95.2 100.0 100.0 88.9
Attendance Rate 95.9 97.2 95.4 95.8
Number of Students with More Than 10
Unexcused Days Absent
110 32 48 71,716
Number of Students absent greater than
10% of School Year
50 15 42 79,014
Number of Students Retained in the 9th
Grade
2 0 0 886
Number of Students Who Have Dropped
Out
2 0 0 3,607
Number of Students Suspended 132 75 118 90,803
Number of Out of School Suspensions 188 101 149 108,934
* In 2014-15 Indiana transitioned to new, more rigorous college-and-career ready standards and a new statewide
assessment to measure these standards. Therefore, results are not comparable to previous data.
15 of 21
*** Suppressed
Gary Community School Corp
2015 Annual Performance Report
Daniel Hale Williams Elem Sch, Gary 4169
School Results State
Indicator '12-'13 '13-'14 '14-'15 '15-'16 Total
A-F Accountability Grade F A A
Student Enrollment 506 479 512 788 1,046,026
Percentage of Students Passing IREAD 78.9 91.0 93.8 90.1
* Grade 3 Percent Passing ISTEP+ Math
Standard
53.8 93.1 71.2 62.6
* Grade 3 Percent Passing ISTEP+
Language Arts Standard
78.5 97.2 78.5 73.2
* Grade 4 Percent Passing ISTEP+ Math
Standard
66.7 88.7 47.9 65.2
* Grade 4 Percent Passing ISTEP+
Language Arts Standard
72.7 94.2 53.4 70.4
* Grade 4 Percent Passing ISTEP+ Science
Standard
42.4 39.6 43.8 71.4
* Grade 5 Percent Passing ISTEP+ Math
Standard
81.6 78.6 54.4 68.4
* Grade 5 Percent Passing ISTEP+
Language Arts Standard
57.1 40.0 32.4 65.2
* Grade 6 Percent Passing ISTEP+ Math
Standard
81.6 82.1 18.6 61.9
* Grade 6 Percent Passing ISTEP+
Language Arts Standard
80.0 83.9 39.7 65.8
* Grade 6 Percent Passing ISTEP+ Science
Standard
42.9 60.7 27.6 66.9
Pupil Enrollment to Certified Employee
Ratio
15 12 14 13
Attendance Rate 98.9 96.1 96.0 95.8
Number of Students with More Than 10
Unexcused Days Absent
0 93 102 71,716
Number of Students absent greater than
10% of School Year
0 37 37 79,014
Number of Students Suspended 1 1 6 90,803
Number of Out of School Suspensions 1 1 6 108,934
* In 2014-15 Indiana transitioned to new, more rigorous college-and-career ready standards and a new statewide
assessment to measure these standards. Therefore, results are not comparable to previous data.
16 of 21
*** Suppressed
Gary Community School Corp
2015 Annual Performance Report
Mary M Bethune Early Child Dev Ctr, Gary 4057
School Results State
Indicator '12-'13 '13-'14 '14-'15 '15-'16 Total
Student Enrollment 483 455 518 533 1,046,026
Attendance Rate 92.9 94.1 95.8
Number of Students with More Than 10
Unexcused Days Absent
218 215 71,716
Number of Students absent greater than
10% of School Year
0 86 75 79,014
* In 2014-15 Indiana transitioned to new, more rigorous college-and-career ready standards and a new statewide
assessment to measure these standards. Therefore, results are not comparable to previous data.
17 of 21
*** Suppressed
Gary Community School Corp
2015 Annual Performance Report
William A Wirt Sr High Sch, Gary 4041
School Results State
Indicator '12-'13 '13-'14 '14-'15 '15-'16 Total
Number of Students in Career and
Technical Program
1 167,961
* In 2014-15 Indiana transitioned to new, more rigorous college-and-career ready standards and a new statewide
assessment to measure these standards. Therefore, results are not comparable to previous data.
18 of 21
*** Suppressed
Gary Community School Corp
2015 Annual Performance Report
Lew Wallace (Sci-Tech-Eng-Math), Gary 4029
School Results State
Indicator '12-'13 '13-'14 '14-'15 '15-'16 Total
Percent of Graduates Granted Waivers for
the ECA
28.4 24.3 *** 7.1
Number of International Baccalaureate
Diplomas
0 0 0 657
Graduation Rate 54.9 64.9 6.7 88.9
Number of Students Who Have Dropped
Out
14 36 27 3,607
* In 2014-15 Indiana transitioned to new, more rigorous college-and-career ready standards and a new statewide
assessment to measure these standards. Therefore, results are not comparable to previous data.
19 of 21
*** Suppressed
Gary Community School Corp
2015 Annual Performance Report
Lincoln Achievement Center, Gary 4093
School Results State
Indicator '12-'13 '13-'14 '14-'15 '15-'16 Total
Number of Students absent greater than
10% of School Year
0 0 0 79,014
* In 2014-15 Indiana transitioned to new, more rigorous college-and-career ready standards and a new statewide
assessment to measure these standards. Therefore, results are not comparable to previous data.
20 of 21
*** Suppressed
Gary Community School Corp
2015 Annual Performance Report
Gary Career Center, Gary 4151
School Results State
Indicator '12-'13 '13-'14 '14-'15 '15-'16 Total
Number of Students absent greater than
10% of School Year
0 0 0 79,014
* In 2014-15 Indiana transitioned to new, more rigorous college-and-career ready standards and a new statewide
assessment to measure these standards. Therefore, results are not comparable to previous data.
21 of 21
*** Suppressed
Gary Community School Corp
2015 Annual Performance Report

More Related Content

Viewers also liked

R.B.M Curriculum Vitae (1)
R.B.M Curriculum Vitae (1)R.B.M Curriculum Vitae (1)
R.B.M Curriculum Vitae (1)RONALD MUSVIBE
 
Trabajo de computación
Trabajo de computaciónTrabajo de computación
Trabajo de computaciónmuenalaandres
 
Rationale September 2010
Rationale September 2010Rationale September 2010
Rationale September 2010Kendra Srebro
 
CV of Shaelin O Niel Padayachee
CV of Shaelin O Niel PadayacheeCV of Shaelin O Niel Padayachee
CV of Shaelin O Niel PadayacheeShaelin Padayachee
 
Future Features For Work Smart Software Interview Question
Future Features For Work Smart Software Interview QuestionFuture Features For Work Smart Software Interview Question
Future Features For Work Smart Software Interview QuestionSuhail Chougule
 
El medio ambiente 11
El medio ambiente 11El medio ambiente 11
El medio ambiente 11linazoliz
 
METKA HRL-2 ΑΛΓΕΡΙΑ ΜΕΤ022
METKA HRL-2 ΑΛΓΕΡΙΑ ΜΕΤ022METKA HRL-2 ΑΛΓΕΡΙΑ ΜΕΤ022
METKA HRL-2 ΑΛΓΕΡΙΑ ΜΕΤ022THEODORE AVRAMIDIS
 
Profitability of sunflower cultivation in some selected sites of bangladesh
Profitability of sunflower cultivation in some selected sites of bangladeshProfitability of sunflower cultivation in some selected sites of bangladesh
Profitability of sunflower cultivation in some selected sites of bangladeshJaminur Rahman
 

Viewers also liked (12)

R.B.M Curriculum Vitae (1)
R.B.M Curriculum Vitae (1)R.B.M Curriculum Vitae (1)
R.B.M Curriculum Vitae (1)
 
Trabajo de computación
Trabajo de computaciónTrabajo de computación
Trabajo de computación
 
Rationale September 2010
Rationale September 2010Rationale September 2010
Rationale September 2010
 
CV of Shaelin O Niel Padayachee
CV of Shaelin O Niel PadayacheeCV of Shaelin O Niel Padayachee
CV of Shaelin O Niel Padayachee
 
Future Features For Work Smart Software Interview Question
Future Features For Work Smart Software Interview QuestionFuture Features For Work Smart Software Interview Question
Future Features For Work Smart Software Interview Question
 
El medio ambiente 11
El medio ambiente 11El medio ambiente 11
El medio ambiente 11
 
Cane V2
Cane V2Cane V2
Cane V2
 
Libros
LibrosLibros
Libros
 
Diploma
DiplomaDiploma
Diploma
 
METKA HRL-2 ΑΛΓΕΡΙΑ ΜΕΤ022
METKA HRL-2 ΑΛΓΕΡΙΑ ΜΕΤ022METKA HRL-2 ΑΛΓΕΡΙΑ ΜΕΤ022
METKA HRL-2 ΑΛΓΕΡΙΑ ΜΕΤ022
 
Profitability of sunflower cultivation in some selected sites of bangladesh
Profitability of sunflower cultivation in some selected sites of bangladeshProfitability of sunflower cultivation in some selected sites of bangladesh
Profitability of sunflower cultivation in some selected sites of bangladesh
 
Zώα σε χειμερία νάρκη
Zώα σε χειμερία νάρκηZώα σε χειμερία νάρκη
Zώα σε χειμερία νάρκη
 

Similar to Gary Community School Corp Performance Report

2017-2018 Texas Academic Performance Report .docx
2017-2018 Texas Academic Performance Report .docx2017-2018 Texas Academic Performance Report .docx
2017-2018 Texas Academic Performance Report .docxvickeryr87
 
Examinations report 2019
Examinations report 2019Examinations report 2019
Examinations report 2019rvhstl
 
Examinations report 2019
Examinations report 2019Examinations report 2019
Examinations report 2019rvhstl
 
Direct admissions 2012 2018 eng
Direct admissions 2012 2018 engDirect admissions 2012 2018 eng
Direct admissions 2012 2018 engArman_Assetov
 
NAG - Jefferson Township SD General Data
NAG - Jefferson Township SD General DataNAG - Jefferson Township SD General Data
NAG - Jefferson Township SD General DataCarole Rafferty
 
Powering Up Writing Grant Report
Powering Up Writing Grant ReportPowering Up Writing Grant Report
Powering Up Writing Grant ReportDan Maas
 
Our Scores are Great?!
Our Scores are Great?!Our Scores are Great?!
Our Scores are Great?!cmashby
 
TEA Summary Report STAAR Spring 2014
TEA Summary Report STAAR Spring 2014TEA Summary Report STAAR Spring 2014
TEA Summary Report STAAR Spring 2014Paul Baez
 
NAG - Kinnelon SD General Data
NAG - Kinnelon SD General DataNAG - Kinnelon SD General Data
NAG - Kinnelon SD General DataCarole Rafferty
 
Superintendent's Presentation 2012
Superintendent's Presentation 2012Superintendent's Presentation 2012
Superintendent's Presentation 2012Leah Vestal
 
Star report 2011 (w/out API
Star report 2011 (w/out APIStar report 2011 (w/out API
Star report 2011 (w/out APIbkissell
 
SAGAY-CITY-BE-LR-and-Continuity-Plan-2.pptx
SAGAY-CITY-BE-LR-and-Continuity-Plan-2.pptxSAGAY-CITY-BE-LR-and-Continuity-Plan-2.pptx
SAGAY-CITY-BE-LR-and-Continuity-Plan-2.pptxReyEnsepedo
 
Tek graduate survey_2017_results
Tek graduate survey_2017_resultsTek graduate survey_2017_results
Tek graduate survey_2017_resultsArttu Piri
 
2014 10-30 bda public schools exam and grad results 2014
2014 10-30 bda public schools exam and grad results 20142014 10-30 bda public schools exam and grad results 2014
2014 10-30 bda public schools exam and grad results 2014Patricia Burchall
 
Using ExamSoft Data to Prepare For and Ease the Accreditation Process
Using ExamSoft Data to Prepare For and Ease the Accreditation ProcessUsing ExamSoft Data to Prepare For and Ease the Accreditation Process
Using ExamSoft Data to Prepare For and Ease the Accreditation ProcessExamSoft
 
9 26-13 sperreng academic achievement (map for moms and dads)
9 26-13 sperreng academic achievement (map for moms and dads)9 26-13 sperreng academic achievement (map for moms and dads)
9 26-13 sperreng academic achievement (map for moms and dads)Gemey McNabb
 
9 26-13 sperreng academic achievement (map for moms and dads)
9 26-13 sperreng academic achievement (map for moms and dads)9 26-13 sperreng academic achievement (map for moms and dads)
9 26-13 sperreng academic achievement (map for moms and dads)Gemey McNabb
 
9 26-13 sperreng academic achievement (map for moms and dads)
9 26-13 sperreng academic achievement (map for moms and dads)9 26-13 sperreng academic achievement (map for moms and dads)
9 26-13 sperreng academic achievement (map for moms and dads)Gemey McNabb
 

Similar to Gary Community School Corp Performance Report (20)

2017-2018 Texas Academic Performance Report .docx
2017-2018 Texas Academic Performance Report .docx2017-2018 Texas Academic Performance Report .docx
2017-2018 Texas Academic Performance Report .docx
 
Examinations report 2019
Examinations report 2019Examinations report 2019
Examinations report 2019
 
Examinations report 2019
Examinations report 2019Examinations report 2019
Examinations report 2019
 
Direct admissions 2014 2019 eng
Direct admissions 2014 2019 engDirect admissions 2014 2019 eng
Direct admissions 2014 2019 eng
 
Direct admissions 2012 2018 eng
Direct admissions 2012 2018 engDirect admissions 2012 2018 eng
Direct admissions 2012 2018 eng
 
NAG - Jefferson Township SD General Data
NAG - Jefferson Township SD General DataNAG - Jefferson Township SD General Data
NAG - Jefferson Township SD General Data
 
Pillar 2.pptx
Pillar 2.pptxPillar 2.pptx
Pillar 2.pptx
 
Powering Up Writing Grant Report
Powering Up Writing Grant ReportPowering Up Writing Grant Report
Powering Up Writing Grant Report
 
Our Scores are Great?!
Our Scores are Great?!Our Scores are Great?!
Our Scores are Great?!
 
TEA Summary Report STAAR Spring 2014
TEA Summary Report STAAR Spring 2014TEA Summary Report STAAR Spring 2014
TEA Summary Report STAAR Spring 2014
 
NAG - Kinnelon SD General Data
NAG - Kinnelon SD General DataNAG - Kinnelon SD General Data
NAG - Kinnelon SD General Data
 
Superintendent's Presentation 2012
Superintendent's Presentation 2012Superintendent's Presentation 2012
Superintendent's Presentation 2012
 
Star report 2011 (w/out API
Star report 2011 (w/out APIStar report 2011 (w/out API
Star report 2011 (w/out API
 
SAGAY-CITY-BE-LR-and-Continuity-Plan-2.pptx
SAGAY-CITY-BE-LR-and-Continuity-Plan-2.pptxSAGAY-CITY-BE-LR-and-Continuity-Plan-2.pptx
SAGAY-CITY-BE-LR-and-Continuity-Plan-2.pptx
 
Tek graduate survey_2017_results
Tek graduate survey_2017_resultsTek graduate survey_2017_results
Tek graduate survey_2017_results
 
2014 10-30 bda public schools exam and grad results 2014
2014 10-30 bda public schools exam and grad results 20142014 10-30 bda public schools exam and grad results 2014
2014 10-30 bda public schools exam and grad results 2014
 
Using ExamSoft Data to Prepare For and Ease the Accreditation Process
Using ExamSoft Data to Prepare For and Ease the Accreditation ProcessUsing ExamSoft Data to Prepare For and Ease the Accreditation Process
Using ExamSoft Data to Prepare For and Ease the Accreditation Process
 
9 26-13 sperreng academic achievement (map for moms and dads)
9 26-13 sperreng academic achievement (map for moms and dads)9 26-13 sperreng academic achievement (map for moms and dads)
9 26-13 sperreng academic achievement (map for moms and dads)
 
9 26-13 sperreng academic achievement (map for moms and dads)
9 26-13 sperreng academic achievement (map for moms and dads)9 26-13 sperreng academic achievement (map for moms and dads)
9 26-13 sperreng academic achievement (map for moms and dads)
 
9 26-13 sperreng academic achievement (map for moms and dads)
9 26-13 sperreng academic achievement (map for moms and dads)9 26-13 sperreng academic achievement (map for moms and dads)
9 26-13 sperreng academic achievement (map for moms and dads)
 

Recently uploaded

Heart Disease Classification Report: A Data Analysis Project
Heart Disease Classification Report: A Data Analysis ProjectHeart Disease Classification Report: A Data Analysis Project
Heart Disease Classification Report: A Data Analysis ProjectBoston Institute of Analytics
 
RadioAdProWritingCinderellabyButleri.pdf
RadioAdProWritingCinderellabyButleri.pdfRadioAdProWritingCinderellabyButleri.pdf
RadioAdProWritingCinderellabyButleri.pdfgstagge
 
办理学位证中佛罗里达大学毕业证,UCF成绩单原版一比一
办理学位证中佛罗里达大学毕业证,UCF成绩单原版一比一办理学位证中佛罗里达大学毕业证,UCF成绩单原版一比一
办理学位证中佛罗里达大学毕业证,UCF成绩单原版一比一F sss
 
Conf42-LLM_Adding Generative AI to Real-Time Streaming Pipelines
Conf42-LLM_Adding Generative AI to Real-Time Streaming PipelinesConf42-LLM_Adding Generative AI to Real-Time Streaming Pipelines
Conf42-LLM_Adding Generative AI to Real-Time Streaming PipelinesTimothy Spann
 
DBA Basics: Getting Started with Performance Tuning.pdf
DBA Basics: Getting Started with Performance Tuning.pdfDBA Basics: Getting Started with Performance Tuning.pdf
DBA Basics: Getting Started with Performance Tuning.pdfJohn Sterrett
 
detection and classification of knee osteoarthritis.pptx
detection and classification of knee osteoarthritis.pptxdetection and classification of knee osteoarthritis.pptx
detection and classification of knee osteoarthritis.pptxAleenaJamil4
 
RABBIT: A CLI tool for identifying bots based on their GitHub events.
RABBIT: A CLI tool for identifying bots based on their GitHub events.RABBIT: A CLI tool for identifying bots based on their GitHub events.
RABBIT: A CLI tool for identifying bots based on their GitHub events.natarajan8993
 
Data Analysis Project : Targeting the Right Customers, Presentation on Bank M...
Data Analysis Project : Targeting the Right Customers, Presentation on Bank M...Data Analysis Project : Targeting the Right Customers, Presentation on Bank M...
Data Analysis Project : Targeting the Right Customers, Presentation on Bank M...Boston Institute of Analytics
 
9711147426✨Call In girls Gurgaon Sector 31. SCO 25 escort service
9711147426✨Call In girls Gurgaon Sector 31. SCO 25 escort service9711147426✨Call In girls Gurgaon Sector 31. SCO 25 escort service
9711147426✨Call In girls Gurgaon Sector 31. SCO 25 escort servicejennyeacort
 
原版1:1定制南十字星大学毕业证(SCU毕业证)#文凭成绩单#真实留信学历认证永久存档
原版1:1定制南十字星大学毕业证(SCU毕业证)#文凭成绩单#真实留信学历认证永久存档原版1:1定制南十字星大学毕业证(SCU毕业证)#文凭成绩单#真实留信学历认证永久存档
原版1:1定制南十字星大学毕业证(SCU毕业证)#文凭成绩单#真实留信学历认证永久存档208367051
 
Advanced Machine Learning for Business Professionals
Advanced Machine Learning for Business ProfessionalsAdvanced Machine Learning for Business Professionals
Advanced Machine Learning for Business ProfessionalsVICTOR MAESTRE RAMIREZ
 
INTERNSHIP ON PURBASHA COMPOSITE TEX LTD
INTERNSHIP ON PURBASHA COMPOSITE TEX LTDINTERNSHIP ON PURBASHA COMPOSITE TEX LTD
INTERNSHIP ON PURBASHA COMPOSITE TEX LTDRafezzaman
 
Biometric Authentication: The Evolution, Applications, Benefits and Challenge...
Biometric Authentication: The Evolution, Applications, Benefits and Challenge...Biometric Authentication: The Evolution, Applications, Benefits and Challenge...
Biometric Authentication: The Evolution, Applications, Benefits and Challenge...GQ Research
 
April 2024 - NLIT Cloudera Real-Time LLM Streaming 2024
April 2024 - NLIT Cloudera Real-Time LLM Streaming 2024April 2024 - NLIT Cloudera Real-Time LLM Streaming 2024
April 2024 - NLIT Cloudera Real-Time LLM Streaming 2024Timothy Spann
 
Semantic Shed - Squashing and Squeezing.pptx
Semantic Shed - Squashing and Squeezing.pptxSemantic Shed - Squashing and Squeezing.pptx
Semantic Shed - Squashing and Squeezing.pptxMike Bennett
 
Predictive Analysis for Loan Default Presentation : Data Analysis Project PPT
Predictive Analysis for Loan Default  Presentation : Data Analysis Project PPTPredictive Analysis for Loan Default  Presentation : Data Analysis Project PPT
Predictive Analysis for Loan Default Presentation : Data Analysis Project PPTBoston Institute of Analytics
 
Learn How Data Science Changes Our World
Learn How Data Science Changes Our WorldLearn How Data Science Changes Our World
Learn How Data Science Changes Our WorldEduminds Learning
 
Predicting Salary Using Data Science: A Comprehensive Analysis.pdf
Predicting Salary Using Data Science: A Comprehensive Analysis.pdfPredicting Salary Using Data Science: A Comprehensive Analysis.pdf
Predicting Salary Using Data Science: A Comprehensive Analysis.pdfBoston Institute of Analytics
 
Real-Time AI Streaming - AI Max Princeton
Real-Time AI  Streaming - AI Max PrincetonReal-Time AI  Streaming - AI Max Princeton
Real-Time AI Streaming - AI Max PrincetonTimothy Spann
 
RS 9000 Call In girls Dwarka Mor (DELHI)⇛9711147426🔝Delhi
RS 9000 Call In girls Dwarka Mor (DELHI)⇛9711147426🔝DelhiRS 9000 Call In girls Dwarka Mor (DELHI)⇛9711147426🔝Delhi
RS 9000 Call In girls Dwarka Mor (DELHI)⇛9711147426🔝Delhijennyeacort
 

Recently uploaded (20)

Heart Disease Classification Report: A Data Analysis Project
Heart Disease Classification Report: A Data Analysis ProjectHeart Disease Classification Report: A Data Analysis Project
Heart Disease Classification Report: A Data Analysis Project
 
RadioAdProWritingCinderellabyButleri.pdf
RadioAdProWritingCinderellabyButleri.pdfRadioAdProWritingCinderellabyButleri.pdf
RadioAdProWritingCinderellabyButleri.pdf
 
办理学位证中佛罗里达大学毕业证,UCF成绩单原版一比一
办理学位证中佛罗里达大学毕业证,UCF成绩单原版一比一办理学位证中佛罗里达大学毕业证,UCF成绩单原版一比一
办理学位证中佛罗里达大学毕业证,UCF成绩单原版一比一
 
Conf42-LLM_Adding Generative AI to Real-Time Streaming Pipelines
Conf42-LLM_Adding Generative AI to Real-Time Streaming PipelinesConf42-LLM_Adding Generative AI to Real-Time Streaming Pipelines
Conf42-LLM_Adding Generative AI to Real-Time Streaming Pipelines
 
DBA Basics: Getting Started with Performance Tuning.pdf
DBA Basics: Getting Started with Performance Tuning.pdfDBA Basics: Getting Started with Performance Tuning.pdf
DBA Basics: Getting Started with Performance Tuning.pdf
 
detection and classification of knee osteoarthritis.pptx
detection and classification of knee osteoarthritis.pptxdetection and classification of knee osteoarthritis.pptx
detection and classification of knee osteoarthritis.pptx
 
RABBIT: A CLI tool for identifying bots based on their GitHub events.
RABBIT: A CLI tool for identifying bots based on their GitHub events.RABBIT: A CLI tool for identifying bots based on their GitHub events.
RABBIT: A CLI tool for identifying bots based on their GitHub events.
 
Data Analysis Project : Targeting the Right Customers, Presentation on Bank M...
Data Analysis Project : Targeting the Right Customers, Presentation on Bank M...Data Analysis Project : Targeting the Right Customers, Presentation on Bank M...
Data Analysis Project : Targeting the Right Customers, Presentation on Bank M...
 
9711147426✨Call In girls Gurgaon Sector 31. SCO 25 escort service
9711147426✨Call In girls Gurgaon Sector 31. SCO 25 escort service9711147426✨Call In girls Gurgaon Sector 31. SCO 25 escort service
9711147426✨Call In girls Gurgaon Sector 31. SCO 25 escort service
 
原版1:1定制南十字星大学毕业证(SCU毕业证)#文凭成绩单#真实留信学历认证永久存档
原版1:1定制南十字星大学毕业证(SCU毕业证)#文凭成绩单#真实留信学历认证永久存档原版1:1定制南十字星大学毕业证(SCU毕业证)#文凭成绩单#真实留信学历认证永久存档
原版1:1定制南十字星大学毕业证(SCU毕业证)#文凭成绩单#真实留信学历认证永久存档
 
Advanced Machine Learning for Business Professionals
Advanced Machine Learning for Business ProfessionalsAdvanced Machine Learning for Business Professionals
Advanced Machine Learning for Business Professionals
 
INTERNSHIP ON PURBASHA COMPOSITE TEX LTD
INTERNSHIP ON PURBASHA COMPOSITE TEX LTDINTERNSHIP ON PURBASHA COMPOSITE TEX LTD
INTERNSHIP ON PURBASHA COMPOSITE TEX LTD
 
Biometric Authentication: The Evolution, Applications, Benefits and Challenge...
Biometric Authentication: The Evolution, Applications, Benefits and Challenge...Biometric Authentication: The Evolution, Applications, Benefits and Challenge...
Biometric Authentication: The Evolution, Applications, Benefits and Challenge...
 
April 2024 - NLIT Cloudera Real-Time LLM Streaming 2024
April 2024 - NLIT Cloudera Real-Time LLM Streaming 2024April 2024 - NLIT Cloudera Real-Time LLM Streaming 2024
April 2024 - NLIT Cloudera Real-Time LLM Streaming 2024
 
Semantic Shed - Squashing and Squeezing.pptx
Semantic Shed - Squashing and Squeezing.pptxSemantic Shed - Squashing and Squeezing.pptx
Semantic Shed - Squashing and Squeezing.pptx
 
Predictive Analysis for Loan Default Presentation : Data Analysis Project PPT
Predictive Analysis for Loan Default  Presentation : Data Analysis Project PPTPredictive Analysis for Loan Default  Presentation : Data Analysis Project PPT
Predictive Analysis for Loan Default Presentation : Data Analysis Project PPT
 
Learn How Data Science Changes Our World
Learn How Data Science Changes Our WorldLearn How Data Science Changes Our World
Learn How Data Science Changes Our World
 
Predicting Salary Using Data Science: A Comprehensive Analysis.pdf
Predicting Salary Using Data Science: A Comprehensive Analysis.pdfPredicting Salary Using Data Science: A Comprehensive Analysis.pdf
Predicting Salary Using Data Science: A Comprehensive Analysis.pdf
 
Real-Time AI Streaming - AI Max Princeton
Real-Time AI  Streaming - AI Max PrincetonReal-Time AI  Streaming - AI Max Princeton
Real-Time AI Streaming - AI Max Princeton
 
RS 9000 Call In girls Dwarka Mor (DELHI)⇛9711147426🔝Delhi
RS 9000 Call In girls Dwarka Mor (DELHI)⇛9711147426🔝DelhiRS 9000 Call In girls Dwarka Mor (DELHI)⇛9711147426🔝Delhi
RS 9000 Call In girls Dwarka Mor (DELHI)⇛9711147426🔝Delhi
 

Gary Community School Corp Performance Report

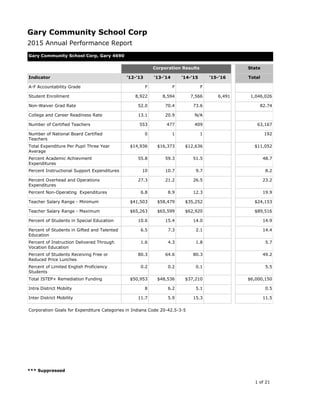
  • 1. Gary Community School Corp, Gary 4690 Corporation Results State Indicator '12-'13 '13-'14 '14-'15 '15-'16 Total A-F Accountability Grade F F F Student Enrollment 8,922 8,594 7,566 6,491 1,046,026 Non-Waiver Grad Rate 52.0 70.4 73.6 82.74 College and Career Readiness Rate 13.1 20.9 N/A Number of Certified Teachers 553 477 409 63,167 Number of National Board Certified Teachers 0 1 1 192 Total Expenditure Per Pupil Three Year Average $14,936 $16,373 $12,636 $11,052 Percent Academic Achievment Expenditures 55.8 59.3 51.5 48.7 Percent Instructional Support Expenditures 10 10.7 9.7 8.2 Percent Overhead and Operations Expenditures 27.3 21.2 26.5 23.2 Percent Non-Operating Expenditures 6.8 8.9 12.3 19.9 Teacher Salary Range - Minimum $41,503 $58,479 $35,252 $24,153 Teacher Salary Range - Maximum $65,263 $65,599 $62,920 $89,516 Percent of Students in Special Education 10.6 15.4 14.0 14.9 Percent of Students in Gifted and Talented Education 6.5 7.3 2.1 14.4 Percent of Instruction Delivered Through Vocation Education 1.6 4.3 1.8 5.7 Percent of Students Receiving Free or Reduced Price Lunches 80.3 64.6 80.3 49.2 Percent of Limited English Proficiency Students 0.2 0.2 0.1 5.5 Total ISTEP+ Remediation Funding $50,953 $48,536 $37,210 $6,000,150 Intra District Mobilty 8 6.2 5.1 0.5 Inter District Mobility 11.7 5.9 15.3 11.5 Corporation Goals for Expenditure Categories in Indiana Code 20-42.5-3-5 1 of 21 *** Suppressed Gary Community School Corp 2015 Annual Performance Report
  • 2. Benjamin Banneker Achievement Ctr, Gary 4053 School Results State Indicator '12-'13 '13-'14 '14-'15 '15-'16 Total A-F Accountability Grade A A A Student Enrollment 552 602 518 485 1,046,026 Percentage of Students Passing IREAD 100.0 100.0 100.0 90.1 * Grade 3 Percent Passing ISTEP+ Math Standard 94.7 95.4 58.7 62.6 * Grade 3 Percent Passing ISTEP+ Language Arts Standard 98.2 96.9 89.3 73.2 * Grade 4 Percent Passing ISTEP+ Math Standard 98.1 73.1 43.6 65.2 * Grade 4 Percent Passing ISTEP+ Language Arts Standard 98.1 96.2 78.2 70.4 * Grade 5 Percent Passing ISTEP+ Math Standard 94.9 90.2 87.5 68.4 * Grade 5 Percent Passing ISTEP+ Language Arts Standard 76.3 98.0 54.2 65.2 * Grade 6 Percent Passing ISTEP+ Math Standard 96.4 96.8 34.1 61.9 * Grade 6 Percent Passing ISTEP+ Language Arts Standard 96.4 88.7 19.6 65.8 * Grade 6 Percent Passing ISTEP+ Science Standard 85.5 59.7 *** 66.9 * Grade 7 Percent Passing ISTEP+ Math Standard 85.2 83.3 28.6 54.1 * Grade 7 Percent Passing ISTEP+ Language Arts Standard 85.2 90.7 67.9 65.7 * Grade 8 Percent Passing ISTEP+ Math Standard 82.0 92.0 47.9 54.2 * Grade 8 Percent Passing ISTEP+ Language Arts Standard 85.7 94.0 83.3 63.7 Percent of 8th Graders in Algebra I 0 0 0 25.9 Pupil Enrollment to Certified Employee Ratio 17 17 16 13 Attendance Rate 98.6 96.5 97.5 95.8 Number of Students with More Than 10 Unexcused Days Absent 1 85 45 71,716 Number of Students absent greater than 10% of School Year 9 30 6 79,014 Number of Students Suspended 1 2 90,803 Number of Out of School Suspensions 1 2 108,934 * In 2014-15 Indiana transitioned to new, more rigorous college-and-career ready standards and a new statewide assessment to measure these standards. Therefore, results are not comparable to previous data. 2 of 21 *** Suppressed Gary Community School Corp 2015 Annual Performance Report
  • 3. Beveridge Elementary School, Gary 4061 School Results State Indicator '12-'13 '13-'14 '14-'15 '15-'16 Total A-F Accountability Grade F F F Student Enrollment 340 361 675 494 1,046,026 Percentage of Students Passing IREAD 49.3 83.8 64.9 90.1 * Grade 3 Percent Passing ISTEP+ Math Standard 39.6 48.6 12.4 62.6 * Grade 3 Percent Passing ISTEP+ Language Arts Standard 55.8 56.8 26.6 73.2 * Grade 4 Percent Passing ISTEP+ Math Standard 25.0 30.4 12.3 65.2 * Grade 4 Percent Passing ISTEP+ Language Arts Standard 51.4 60.9 20.0 70.4 * Grade 4 Percent Passing ISTEP+ Science Standard 11.4 26.1 24.7 71.4 * Grade 5 Percent Passing ISTEP+ Math Standard 56.3 59.3 18.5 68.4 * Grade 5 Percent Passing ISTEP+ Language Arts Standard 25.0 40.0 17.3 65.2 * Grade 5 Percent Passing ISTEP+ Social Science Standard 9.4 16.0 *** 70.9 * Grade 6 Percent Passing ISTEP+ Math Standard 23.1 42.9 7.7 61.9 * Grade 6 Percent Passing ISTEP+ Language Arts Standard 22.5 35.7 11.5 65.8 * Grade 6 Percent Passing ISTEP+ Science Standard 5.0 3.7 13.0 66.9 Pupil Enrollment to Certified Employee Ratio 11 12 17 13 Attendance Rate 97.6 95.6 95.5 95.8 Number of Students with More Than 10 Unexcused Days Absent 0 82 151 71,716 Number of Students absent greater than 10% of School Year 4 32 48 79,014 Number of Students Suspended 20 28 62 90,803 Number of Out of School Suspensions 24 35 73 108,934 * In 2014-15 Indiana transitioned to new, more rigorous college-and-career ready standards and a new statewide assessment to measure these standards. Therefore, results are not comparable to previous data. 3 of 21 *** Suppressed Gary Community School Corp 2015 Annual Performance Report
  • 4. Dr Bernard C Watson Acad for Boys, Gary 4081 School Results State Indicator '12-'13 '13-'14 '14-'15 '15-'16 Total A-F Accountability Grade F C C Student Enrollment 198 180 137 130 1,046,026 Percentage of Students Passing IREAD 65.5 86.2 91.7 90.1 * Grade 3 Percent Passing ISTEP+ Math Standard 34.8 57.1 47.8 62.6 * Grade 3 Percent Passing ISTEP+ Language Arts Standard 60.9 57.1 47.8 73.2 * Grade 4 Percent Passing ISTEP+ Math Standard 41.2 57.9 10.0 65.2 * Grade 4 Percent Passing ISTEP+ Language Arts Standard 80.0 73.7 19.0 70.4 * Grade 4 Percent Passing ISTEP+ Science Standard 31.3 10.5 14.3 71.4 * Grade 5 Percent Passing ISTEP+ Math Standard 55.0 73.3 21.1 68.4 * Grade 5 Percent Passing ISTEP+ Language Arts Standard 26.3 57.1 15.8 65.2 * Grade 6 Percent Passing ISTEP+ Math Standard 47.1 73.3 7.1 61.9 * Grade 6 Percent Passing ISTEP+ Language Arts Standard 17.6 40.0 21.4 65.8 * Grade 6 Percent Passing ISTEP+ Science Standard 5.9 6.7 7.1 66.9 Pupil Enrollment to Certified Employee Ratio 6 5 5 13 Attendance Rate 96.3 94.0 91.5 95.8 Number of Students with More Than 10 Unexcused Days Absent 0 71 78 71,716 Number of Students absent greater than 10% of School Year 8 24 41 79,014 Number of Students Suspended 3 12 30 90,803 Number of Out of School Suspensions 3 15 48 108,934 Number of In School Suspensions 1 96,792 * In 2014-15 Indiana transitioned to new, more rigorous college-and-career ready standards and a new statewide assessment to measure these standards. Therefore, results are not comparable to previous data. 4 of 21 *** Suppressed Gary Community School Corp 2015 Annual Performance Report
  • 5. Frankie W McCullough Acad for Girl, Gary 4086 School Results State Indicator '12-'13 '13-'14 '14-'15 '15-'16 Total A-F Accountability Grade A A A Student Enrollment 440 472 429 453 1,046,026 Percentage of Students Passing IREAD 68.7 65.6 98.4 90.1 * Grade 3 Percent Passing ISTEP+ Math Standard 96.4 61.7 98.4 62.6 * Grade 3 Percent Passing ISTEP+ Language Arts Standard 100.0 69.5 62.1 73.2 * Grade 4 Percent Passing ISTEP+ Math Standard 84.8 86.3 46.0 65.2 * Grade 4 Percent Passing ISTEP+ Language Arts Standard 87.0 80.0 44.0 70.4 * Grade 4 Percent Passing ISTEP+ Science Standard 71.7 84.3 54.0 71.4 * Grade 5 Percent Passing ISTEP+ Math Standard 100.0 100.0 89.4 68.4 * Grade 5 Percent Passing ISTEP+ Language Arts Standard 100.0 96.8 89.1 65.2 * Grade 6 Percent Passing ISTEP+ Math Standard 100.0 100.0 78.0 61.9 * Grade 6 Percent Passing ISTEP+ Language Arts Standard 100.0 91.7 55.0 65.8 * Grade 6 Percent Passing ISTEP+ Science Standard 33.3 83.3 77.5 66.9 * Grade 7 Percent Passing ISTEP+ Math Standard 88.5 100.0 78.8 54.1 * Grade 7 Percent Passing ISTEP+ Language Arts Standard 57.7 91.7 66.7 65.7 Pupil Enrollment to Certified Employee Ratio 14 16 15 13 Attendance Rate 98.2 98.0 97.4 95.8 Number of Students with More Than 10 Unexcused Days Absent 0 38 49 71,716 Number of Students absent greater than 10% of School Year 2 9 4 79,014 Number of Students Suspended 2 90,803 Number of Out of School Suspensions 2 108,934 * In 2014-15 Indiana transitioned to new, more rigorous college-and-career ready standards and a new statewide assessment to measure these standards. Therefore, results are not comparable to previous data. 5 of 21 *** Suppressed Gary Community School Corp 2015 Annual Performance Report
  • 6. Jefferson Elementary School, Gary 4104 School Results State Indicator '12-'13 '13-'14 '14-'15 '15-'16 Total A-F Accountability Grade F F F Student Enrollment 488 464 482 459 1,046,026 Percentage of Students Passing IREAD 56.0 67.4 76.7 90.1 * Grade 3 Percent Passing ISTEP+ Math Standard 47.6 44.9 8.5 62.6 * Grade 3 Percent Passing ISTEP+ Language Arts Standard 66.1 44.9 22.2 73.2 * Grade 4 Percent Passing ISTEP+ Math Standard 48.8 28.9 15.1 65.2 * Grade 4 Percent Passing ISTEP+ Language Arts Standard 60.0 52.6 19.7 70.4 * Grade 4 Percent Passing ISTEP+ Science Standard 32.5 23.7 13.7 71.4 * Grade 5 Percent Passing ISTEP+ Math Standard 35.0 36.7 10.7 68.4 * Grade 5 Percent Passing ISTEP+ Language Arts Standard 32.8 30.0 7.4 65.2 * Grade 5 Percent Passing ISTEP+ Social Science Standard 17.2 10.3 *** 70.9 * Grade 6 Percent Passing ISTEP+ Math Standard 44.4 45.7 2.9 61.9 * Grade 6 Percent Passing ISTEP+ Language Arts Standard 24.1 32.6 8.3 65.8 * Grade 6 Percent Passing ISTEP+ Science Standard 7.4 8.7 8.6 66.9 Pupil Enrollment to Certified Employee Ratio 14 15 13 13 Attendance Rate 97.5 95.4 94.0 95.8 Number of Students with More Than 10 Unexcused Days Absent 6 114 182 71,716 Number of Students absent greater than 10% of School Year 7 42 66 79,014 Number of Students Suspended 12 22 35 90,803 Number of Out of School Suspensions 13 24 45 108,934 * In 2014-15 Indiana transitioned to new, more rigorous college-and-career ready standards and a new statewide assessment to measure these standards. Therefore, results are not comparable to previous data. 6 of 21 *** Suppressed Gary Community School Corp 2015 Annual Performance Report
  • 7. Bailly Preparatory Academy, Gary 4105 School Results State Indicator '12-'13 '13-'14 '14-'15 '15-'16 Total A-F Accountability Grade D B B Student Enrollment 588 506 371 428 1,046,026 Percentage of Students Passing IREAD 62.7 60.3 85.0 90.1 * Grade 3 Percent Passing ISTEP+ Math Standard 50.0 63.5 61.0 62.6 * Grade 3 Percent Passing ISTEP+ Language Arts Standard 59.0 63.5 65.5 73.2 * Grade 4 Percent Passing ISTEP+ Math Standard 73.0 79.2 47.4 65.2 * Grade 4 Percent Passing ISTEP+ Language Arts Standard 74.6 75.0 43.2 70.4 * Grade 4 Percent Passing ISTEP+ Science Standard 25.4 14.6 13.2 71.4 * Grade 5 Percent Passing ISTEP+ Math Standard 84.9 78.4 41.7 68.4 * Grade 5 Percent Passing ISTEP+ Language Arts Standard 71.7 64.9 33.3 65.2 * Grade 5 Percent Passing ISTEP+ Social Science Standard 22.6 21.6 *** 70.9 * Grade 6 Percent Passing ISTEP+ Math Standard 76.1 89.1 34.1 61.9 * Grade 6 Percent Passing ISTEP+ Language Arts Standard 58.7 76.1 45.5 65.8 * Grade 6 Percent Passing ISTEP+ Science Standard 21.7 34.8 15.9 66.9 Pupil Enrollment to Certified Employee Ratio 14 12 11 13 Attendance Rate 94.1 95.1 96.3 95.8 Number of Students with More Than 10 Unexcused Days Absent 158 77 78 71,716 Number of Students absent greater than 10% of School Year 61 15 32 79,014 Number of Students Suspended 78 47 63 90,803 Number of Expulsions and Suspensions Involving Drugs, Weapons, or Alcohol 3 0 1 6,705 Number of Out of School Suspensions 97 63 84 108,934 * In 2014-15 Indiana transitioned to new, more rigorous college-and-career ready standards and a new statewide assessment to measure these standards. Therefore, results are not comparable to previous data. 7 of 21 *** Suppressed Gary Community School Corp 2015 Annual Performance Report
  • 8. New Tech Innovative Institute, Gary 4113 School Results State Indicator '12-'13 '13-'14 '14-'15 '15-'16 Total A-F Accountability Grade D F F Student Enrollment 159 294 404 242 1,046,026 Number of Students in Career and Technical Program 224 208 167,961 Percentage of Students in Career and Technical Program 76.2 51.5 49.15 Percent Passing ECA Math Standard 70.7 30.1 13.4 68.9 Percent Passing ECA English Language Arts Standard 40.0 39.1 42.9 77.9 Percent of Graduates Who Have Passsed Both ECA Standards 73.03 82.75 Percent of Graduates Granted Waivers for the ECA 12.2 7.1 SAT Average Score for Graduating Class 721.0 987.6 Percent of 12th Graders Taking SAT 19.8 45.9 Percent of Graduates Pursuing College 72.0 78.3 Pupil Enrollment to Certified Employee Ratio 4 17 20 13 Graduation Rate 83.1 88.9 Attendance Rate 97.2 96.6 94.6 95.8 Number of Students with More Than 10 Unexcused Days Absent 15 52 127 71,716 Number of Students absent greater than 10% of School Year 4 13 43 79,014 Number of Students Retained in the 9th Grade 2 12 16 886 Number of Students Who Have Dropped Out 4 3,607 Number of Students Suspended 24 93 84 90,803 Number of Students Expelled 14 2,886 Number of Expulsions and Suspensions Involving Drugs, Weapons, or Alcohol 2 10 3 6,705 Number of Out of School Suspensions 29 176 108 108,934 * In 2014-15 Indiana transitioned to new, more rigorous college-and-career ready standards and a new statewide assessment to measure these standards. Therefore, results are not comparable to previous data. 8 of 21 *** Suppressed Gary Community School Corp 2015 Annual Performance Report
  • 9. Jacques Marquette Elem School, Gary 4121 School Results State Indicator '12-'13 '13-'14 '14-'15 '15-'16 Total A-F Accountability Grade F F F Student Enrollment 710 644 576 441 1,046,026 Percentage of Students Passing IREAD 61.2 83.3 78.6 90.1 * Grade 3 Percent Passing ISTEP+ Math Standard 60.4 54.0 31.3 62.6 * Grade 3 Percent Passing ISTEP+ Language Arts Standard 72.9 67.3 42.3 73.2 * Grade 4 Percent Passing ISTEP+ Math Standard 51.4 38.5 16.3 65.2 * Grade 4 Percent Passing ISTEP+ Language Arts Standard 77.8 72.3 35.2 70.4 * Grade 4 Percent Passing ISTEP+ Science Standard 36.6 26.2 22.8 71.4 * Grade 5 Percent Passing ISTEP+ Math Standard 39.1 71.2 55.1 68.4 * Grade 5 Percent Passing ISTEP+ Language Arts Standard 60.9 67.8 27.1 65.2 * Grade 6 Percent Passing ISTEP+ Math Standard 53.2 28.1 3.7 61.9 * Grade 6 Percent Passing ISTEP+ Language Arts Standard 48.7 53.1 35.2 65.8 * Grade 6 Percent Passing ISTEP+ Science Standard 20.5 12.5 13.2 66.9 Pupil Enrollment to Certified Employee Ratio 17 16 14 13 Attendance Rate 98.6 96.1 94.7 95.8 Number of Students with More Than 10 Unexcused Days Absent 0 135 142 71,716 Number of Students absent greater than 10% of School Year 3 30 46 79,014 Number of Students Suspended 7 1 23 90,803 Number of Out of School Suspensions 11 1 33 108,934 * In 2014-15 Indiana transitioned to new, more rigorous college-and-career ready standards and a new statewide assessment to measure these standards. Therefore, results are not comparable to previous data. 9 of 21 *** Suppressed Gary Community School Corp 2015 Annual Performance Report
  • 10. Dunbar-Pulaski Academic & Career, Gary 4145 School Results State Indicator '12-'13 '13-'14 '14-'15 '15-'16 Total A-F Accountability Grade F F F Student Enrollment 298 397 674 1,046,026 Number of Students in Career and Technical Program 147 167,961 Percentage of Students in Career and Technical Program 21.8 49.15 * Grade 7 Percent Passing ISTEP+ Math Standard 27.1 30.5 5.3 54.1 * Grade 7 Percent Passing ISTEP+ Language Arts Standard 17.4 27.0 19.2 65.7 * Grade 7 Percent Passing ISTEP+ Social Science Standard 17.8 10.0 *** 69.8 * Grade 8 Percent Passing ISTEP+ Math Standard 25.0 24.1 2.7 54.2 * Grade 8 Percent Passing ISTEP+ Language Arts Standard 33.8 25.7 13.7 63.7 Percent of 8th Graders in Algebra I 0 0 0 25.9 Pupil Enrollment to Certified Employee Ratio 9 12 15 13 Attendance Rate 95.3 92.9 93.2 95.8 Number of Students with More Than 10 Unexcused Days Absent 1 115 238 71,716 Number of Students absent greater than 10% of School Year 39 64 129 79,014 Number of Students Suspended 69 93 55 90,803 Number of Expulsions and Suspensions Involving Drugs, Weapons, or Alcohol 0 5 3 6,705 Number of Out of School Suspensions 97 109 72 108,934 * In 2014-15 Indiana transitioned to new, more rigorous college-and-career ready standards and a new statewide assessment to measure these standards. Therefore, results are not comparable to previous data. 10 of 21 *** Suppressed Gary Community School Corp 2015 Annual Performance Report
  • 11. Glen Park Acad for Excel in Lrn, Gary 4155 School Results State Indicator '12-'13 '13-'14 '14-'15 '15-'16 Total A-F Accountability Grade C D D Student Enrollment 516 482 790 638 1,046,026 Percentage of Students Passing IREAD 73.1 75.0 74.2 90.1 * Grade 3 Percent Passing ISTEP+ Math Standard 67.2 54.2 17.2 62.6 * Grade 3 Percent Passing ISTEP+ Language Arts Standard 77.0 66.7 33.3 73.2 * Grade 4 Percent Passing ISTEP+ Math Standard 53.2 58.7 16.0 65.2 * Grade 4 Percent Passing ISTEP+ Language Arts Standard 68.1 80.4 36.5 70.4 * Grade 4 Percent Passing ISTEP+ Science Standard 46.8 47.8 23.6 71.4 * Grade 5 Percent Passing ISTEP+ Math Standard 88.9 87.0 46.2 68.4 * Grade 5 Percent Passing ISTEP+ Language Arts Standard 87.3 87.0 42.9 65.2 * Grade 5 Percent Passing ISTEP+ Social Science Standard 60.3 47.8 *** 70.9 * Grade 6 Percent Passing ISTEP+ Math Standard 74.4 78.0 20.0 61.9 * Grade 6 Percent Passing ISTEP+ Language Arts Standard 69.8 74.0 44.4 65.8 * Grade 6 Percent Passing ISTEP+ Science Standard 30.2 32.7 21.0 66.9 Pupil Enrollment to Certified Employee Ratio 14 14 17 13 Attendance Rate 97.4 95.8 95.8 95.8 Number of Students with More Than 10 Unexcused Days Absent 0 110 157 71,716 Number of Students absent greater than 10% of School Year 4 31 43 79,014 Number of Students Suspended 23 15 43 90,803 Number of Expulsions and Suspensions Involving Drugs, Weapons, or Alcohol 0 0 1 6,705 Number of Out of School Suspensions 31 17 88 108,934 * In 2014-15 Indiana transitioned to new, more rigorous college-and-career ready standards and a new statewide assessment to measure these standards. Therefore, results are not comparable to previous data. 11 of 21 *** Suppressed Gary Community School Corp 2015 Annual Performance Report
  • 12. West Side Leadership Academy, Gary 4163 School Results State Indicator '12-'13 '13-'14 '14-'15 '15-'16 Total A-F Accountability Grade C Student Enrollment 1,234 1,075 885 761 1,046,026 Number of Students in Career and Technical Program 169 352 356 167,961 Percentage of Students in Career and Technical Program 13.7 32.7 40.2 49.15 Percent Passing ECA Math Standard 5.7 46.1 39.2 68.9 Percent Passing ECA English Language Arts Standard 24.0 37.3 39.9 77.9 Percent of Graduates Who Have Passsed Both ECA Standards 49.50 72.73 76.83 82.75 Percent of Graduates Granted Waivers for the ECA 28.2 21.3 11.3 7.1 Number of International Baccalaureate Diplomas 0 0 0 657 Percent of Students Taking Advanced Placement Exams 2.8 5.8 12.2 3.9 Percent of AP Test with Score of 3,4,5 6.9 0.0 0.8 49.7 SAT Average Score for Graduating Class 762.8 787.0 697.6 987.6 Percent of 12th Graders Taking SAT 32.7 22.8 22.9 45.9 Percent Core 40 with Honors Diploma 4.8 9.8 7.7 37.2 Percent Core 40 Diploma 72.7 86.9 99.3 87.1 Percent of Graduates Pursuing College 75.2 72.4 79.1 78.3 Pupil Enrollment to Certified Employee Ratio 12 17 12 13 Graduation Rate 69.0 92.4 86.6 88.9 Attendance Rate 90.7 85.0 82.3 95.8 Number of Students with More Than 10 Unexcused Days Absent 521 706 671 71,716 Number of Students absent greater than 10% of School Year 369 509 536 79,014 Number of Students Retained in the 9th Grade 1 2 7 886 Number of Students Who Have Dropped Out 18 3 0 3,607 Number of Students Suspended 430 141 173 90,803 * In 2014-15 Indiana transitioned to new, more rigorous college-and-career ready standards and a new statewide assessment to measure these standards. Therefore, results are not comparable to previous data. 12 of 21 *** Suppressed Gary Community School Corp 2015 Annual Performance Report
  • 13. West Side Leadership Academy, Gary 4163 School Results State Indicator '12-'13 '13-'14 '14-'15 '15-'16 Total Number of Expulsions and Suspensions Involving Drugs, Weapons, or Alcohol 32 9 10 6,705 Number of Out of School Suspensions 946 275 252 108,934 * In 2014-15 Indiana transitioned to new, more rigorous college-and-career ready standards and a new statewide assessment to measure these standards. Therefore, results are not comparable to previous data. 13 of 21 *** Suppressed Gary Community School Corp 2015 Annual Performance Report
  • 14. Wm A Wirt/Emerson VPA, Gary 4168 School Results State Indicator '12-'13 '13-'14 '14-'15 '15-'16 Total A-F Accountability Grade D C C Student Enrollment 585 612 595 639 1,046,026 Number of Students in Career and Technical Program 159 112 167,961 Percentage of Students in Career and Technical Program 26.0 18.8 49.15 * Grade 5 Percent Passing ISTEP+ Math Standard 70.6 84.6 11.1 68.4 * Grade 5 Percent Passing ISTEP+ Language Arts Standard 66.7 84.6 44.4 65.2 * Grade 6 Percent Passing ISTEP+ Math Standard 67.9 54.8 27.3 61.9 * Grade 6 Percent Passing ISTEP+ Language Arts Standard 75.0 66.1 42.4 65.8 * Grade 6 Percent Passing ISTEP+ Science Standard 35.7 40.3 45.5 66.9 * Grade 7 Percent Passing ISTEP+ Math Standard 75.3 56.9 9.8 54.1 * Grade 7 Percent Passing ISTEP+ Language Arts Standard 70.1 65.3 37.8 65.7 * Grade 8 Percent Passing ISTEP+ Math Standard 50.6 64.8 25.8 54.2 * Grade 8 Percent Passing ISTEP+ Language Arts Standard 70.8 74.6 57.6 63.7 Percent of 8th Graders in Algebra I 0 0 0 25.9 Percent Passing ECA Math Standard 33.7 15.8 58.6 68.9 Percent Passing ECA English Language Arts Standard 77.2 78.0 64.6 77.9 Percent of Graduates Who Have Passsed Both ECA Standards 88.89 97.26 92.59 82.75 Percent of Graduates Granted Waivers for the ECA 6.7 2.7 7.4 7.1 Number of International Baccalaureate Diplomas 0 0 0 657 Percent of Students Taking Advanced Placement Exams 6.0 8.2 8.4 3.9 Percent of AP Test with Score of 3,4,5 4.0 4.6 4.2 49.7 SAT Average Score for Graduating Class 842.5 780.0 848.6 987.6 Percent of 12th Graders Taking SAT 64.7 65.1 71.4 45.9 * In 2014-15 Indiana transitioned to new, more rigorous college-and-career ready standards and a new statewide assessment to measure these standards. Therefore, results are not comparable to previous data. 14 of 21 *** Suppressed Gary Community School Corp 2015 Annual Performance Report
  • 15. Wm A Wirt/Emerson VPA, Gary 4168 School Results State Indicator '12-'13 '13-'14 '14-'15 '15-'16 Total Percent Core 40 with Honors Diploma 20.0 5.5 14.8 37.2 Percent Core 40 Diploma 90.0 94.5 92.6 87.1 Percent of Graduates Pursuing College 81.7 90.4 93.8 78.3 Pupil Enrollment to Certified Employee Ratio 13 12 12 13 Graduation Rate 95.2 100.0 100.0 88.9 Attendance Rate 95.9 97.2 95.4 95.8 Number of Students with More Than 10 Unexcused Days Absent 110 32 48 71,716 Number of Students absent greater than 10% of School Year 50 15 42 79,014 Number of Students Retained in the 9th Grade 2 0 0 886 Number of Students Who Have Dropped Out 2 0 0 3,607 Number of Students Suspended 132 75 118 90,803 Number of Out of School Suspensions 188 101 149 108,934 * In 2014-15 Indiana transitioned to new, more rigorous college-and-career ready standards and a new statewide assessment to measure these standards. Therefore, results are not comparable to previous data. 15 of 21 *** Suppressed Gary Community School Corp 2015 Annual Performance Report
  • 16. Daniel Hale Williams Elem Sch, Gary 4169 School Results State Indicator '12-'13 '13-'14 '14-'15 '15-'16 Total A-F Accountability Grade F A A Student Enrollment 506 479 512 788 1,046,026 Percentage of Students Passing IREAD 78.9 91.0 93.8 90.1 * Grade 3 Percent Passing ISTEP+ Math Standard 53.8 93.1 71.2 62.6 * Grade 3 Percent Passing ISTEP+ Language Arts Standard 78.5 97.2 78.5 73.2 * Grade 4 Percent Passing ISTEP+ Math Standard 66.7 88.7 47.9 65.2 * Grade 4 Percent Passing ISTEP+ Language Arts Standard 72.7 94.2 53.4 70.4 * Grade 4 Percent Passing ISTEP+ Science Standard 42.4 39.6 43.8 71.4 * Grade 5 Percent Passing ISTEP+ Math Standard 81.6 78.6 54.4 68.4 * Grade 5 Percent Passing ISTEP+ Language Arts Standard 57.1 40.0 32.4 65.2 * Grade 6 Percent Passing ISTEP+ Math Standard 81.6 82.1 18.6 61.9 * Grade 6 Percent Passing ISTEP+ Language Arts Standard 80.0 83.9 39.7 65.8 * Grade 6 Percent Passing ISTEP+ Science Standard 42.9 60.7 27.6 66.9 Pupil Enrollment to Certified Employee Ratio 15 12 14 13 Attendance Rate 98.9 96.1 96.0 95.8 Number of Students with More Than 10 Unexcused Days Absent 0 93 102 71,716 Number of Students absent greater than 10% of School Year 0 37 37 79,014 Number of Students Suspended 1 1 6 90,803 Number of Out of School Suspensions 1 1 6 108,934 * In 2014-15 Indiana transitioned to new, more rigorous college-and-career ready standards and a new statewide assessment to measure these standards. Therefore, results are not comparable to previous data. 16 of 21 *** Suppressed Gary Community School Corp 2015 Annual Performance Report
  • 17. Mary M Bethune Early Child Dev Ctr, Gary 4057 School Results State Indicator '12-'13 '13-'14 '14-'15 '15-'16 Total Student Enrollment 483 455 518 533 1,046,026 Attendance Rate 92.9 94.1 95.8 Number of Students with More Than 10 Unexcused Days Absent 218 215 71,716 Number of Students absent greater than 10% of School Year 0 86 75 79,014 * In 2014-15 Indiana transitioned to new, more rigorous college-and-career ready standards and a new statewide assessment to measure these standards. Therefore, results are not comparable to previous data. 17 of 21 *** Suppressed Gary Community School Corp 2015 Annual Performance Report
  • 18. William A Wirt Sr High Sch, Gary 4041 School Results State Indicator '12-'13 '13-'14 '14-'15 '15-'16 Total Number of Students in Career and Technical Program 1 167,961 * In 2014-15 Indiana transitioned to new, more rigorous college-and-career ready standards and a new statewide assessment to measure these standards. Therefore, results are not comparable to previous data. 18 of 21 *** Suppressed Gary Community School Corp 2015 Annual Performance Report
  • 19. Lew Wallace (Sci-Tech-Eng-Math), Gary 4029 School Results State Indicator '12-'13 '13-'14 '14-'15 '15-'16 Total Percent of Graduates Granted Waivers for the ECA 28.4 24.3 *** 7.1 Number of International Baccalaureate Diplomas 0 0 0 657 Graduation Rate 54.9 64.9 6.7 88.9 Number of Students Who Have Dropped Out 14 36 27 3,607 * In 2014-15 Indiana transitioned to new, more rigorous college-and-career ready standards and a new statewide assessment to measure these standards. Therefore, results are not comparable to previous data. 19 of 21 *** Suppressed Gary Community School Corp 2015 Annual Performance Report
  • 20. Lincoln Achievement Center, Gary 4093 School Results State Indicator '12-'13 '13-'14 '14-'15 '15-'16 Total Number of Students absent greater than 10% of School Year 0 0 0 79,014 * In 2014-15 Indiana transitioned to new, more rigorous college-and-career ready standards and a new statewide assessment to measure these standards. Therefore, results are not comparable to previous data. 20 of 21 *** Suppressed Gary Community School Corp 2015 Annual Performance Report
  • 21. Gary Career Center, Gary 4151 School Results State Indicator '12-'13 '13-'14 '14-'15 '15-'16 Total Number of Students absent greater than 10% of School Year 0 0 0 79,014 * In 2014-15 Indiana transitioned to new, more rigorous college-and-career ready standards and a new statewide assessment to measure these standards. Therefore, results are not comparable to previous data. 21 of 21 *** Suppressed Gary Community School Corp 2015 Annual Performance Report