Mid Month Stats from TREB for July 2017
•
1 like•281 views

Mid month stats for July 2017 - real estate sales down.
Recommended

Recommended
More Related Content
Similar to Mid Month Stats from TREB for July 2017
Similar to Mid Month Stats from TREB for July 2017 (20)
More from Michelle Makos
More from Michelle Makos (20)
Recently uploaded
Recently uploaded (20)
Mid Month Stats from TREB for July 2017
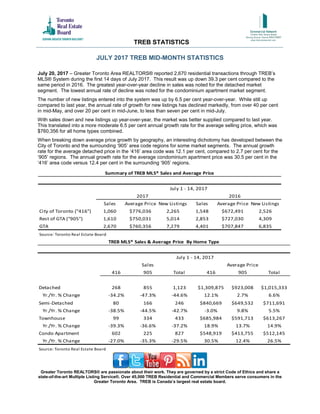
- 1. JULY 2017 TREB MID-MONTH STATISTICS Greater Toronto REALTORS® are passionate about their work. They are governed by a strict Code of Ethics and share a state-of-the-art Multiple Listing Service®. Over 45,000 TREB Residential and Commercial Members serve consumers in the Greater Toronto Area. TREB is Canada’s largest real estate board. July 20, 2017 – Greater Toronto Area REALTORS® reported 2,670 residential transactions through TREB’s MLS® System during the first 14 days of July 2017. This result was up down 39.3 per cent compared to the same period in 2016. The greatest year-over-year decline in sales was noted for the detached market segment. The lowest annual rate of decline was noted for the condominium apartment market segment. The number of new listings entered into the system was up by 6.5 per cent year-over-year. While still up compared to last year, the annual rate of growth for new listings has declined markedly, from over 40 per cent in mid-May, and over 20 per cent in mid-June, to less than seven per cent in mid-July. With sales down and new listings up year-over-year, the market was better supplied compared to last year. This translated into a more moderate 6.5 per cent annual growth rate for the average selling price, which was $760,356 for all home types combined. When breaking down average price growth by geography, an interesting dichotomy has developed between the City of Toronto and the surrounding ‘905’ area code regions for some market segments. The annual growth rate for the average detached price in the ‘416’ area code was 12.1 per cent, compared to 2.7 per cent for the ‘905’ regions. The annual growth rate for the average condominium apartment price was 30.5 per cent in the ‘416’ area code versus 12.4 per cent in the surrounding ‘905’ regions. TREB STATISTICS Sales Average Price New Listings Sales Average Price New Listings City of Toronto ("416") 1,060 $776,036 2,265 1,548 $672,491 2,526 Rest of GTA ("905") 1,610 $750,031 5,014 2,853 $727,030 4,309 GTA 2,670 $760,356 7,279 4,401 $707,847 6,835 Source: Toronto Real Estate Board Summary of TREB MLS® Sales and Average Price July 1 - 14, 2017 2017 2016 416 905 Total 416 905 Total Detached 268 855 1,123 $1,309,875 $923,008 $1,015,333 Yr./Yr. % Change -34.2% -47.3% -44.6% 12.1% 2.7% 6.6% Semi-Detached 80 166 246 $840,669 $649,532 $711,691 Yr./Yr. % Change -38.5% -44.5% -42.7% -3.0% 9.8% 5.5% Townhouse 99 334 433 $685,984 $591,713 $613,267 Yr./Yr. % Change -39.3% -36.6% -37.2% 18.9% 13.7% 14.9% Condo Apartment 602 225 827 $548,919 $413,755 $512,145 Yr./Yr. % Change -27.0% -35.3% -29.5% 30.5% 12.4% 26.5% Source: Toronto Real Estate Board TREB MLS® Sales & Average Price By Home Type July 1 - 14, 2017 Sales Average Price