SlideShare ist ein Scribd-Unternehmen logo
1 von 9
Downloaden Sie, um offline zu lesen
Houston Area Single‐Family Residential Market by Area for February 2010
Real Estate Data ©2010 Real Estate Center at Texas A and M University and HAR.
Data computations ©2010 Prudential Gary Greene, Realtors.


                                                                   Sales        Sold
                                        Average       Median       Price        to List     Coop        New         Active       Pending                 Months
Year    Month              Sales        Price         Price        per Sqft     Price       Sales       Listings    Listings     Sales       DOM         Inventory
Area    1- Atascocita

2009    YTD                238          $160,159      $140,000     $64          94%         83%         643         1133         240         104         6.0
2010    YTD                228          $177,539      $143,000     $68          97%         84%         750         1141         220         85          6.4
        Difference         -10          $17,380       $3,000       $4           0.03        0.01        107         8            -20         -19         0.4
        % Difference       -4.20%       10.85%        2.14%        6.25%        3.19%       1.20%       16.64%      0.71%        -8.33%      -18.27%     6.67%


Area    2- East

2009    YTD                306          $82,207       $74,200      $49          95%         75%         503         1021         255         103         5.8
2010    YTD                216          $87,087       $89,900      $49          96%         71%         607         1158         236         93          7.9
        Difference         -90          $4,880        $15,700      $0           0.01        -0.04       104         137          -19         -10         2.1
        % Difference       -29.41%      5.94%         21.16%       0.00%        1.05%       -5.33%      20.68%      13.42%       -7.45%      -9.71%      36.21%


Area    3- Southeast

2009    YTD                216          $88,828       $83,250      $52          95%         82%         425         724          231         85          5.1
2010    YTD                176          $96,136       $97,100      $56          96%         80%         485         753          170         63          5.9
        Difference         -40          $7,308        $13,850      $4           0.01        -0.02       60          29           -61         -22         0.8
        % Difference       -18.52%      8.23%         16.64%       7.69%        1.05%       -2.44%      14.12%      4.01%        -26.41%     -25.88%     15.69%


Area    4- South

2009    YTD                52           $85,682       $74,250      $55          91%         71%         151         298          58          98          8.3
2010    YTD                43           $108,665      $83,400      $69          97%         70%         155         283          40          77          9.4
        Difference         -9           $22,983       $9,150       $14          0.06        -0.01       4           -15          -18         -21         1.1
        % Difference       -17.31%      26.82%        12.32%       25.45%       6.59%       -1.41%      2.65%       -5.03%       -31.03%     -21.43%     13.25%


Area:   5 - Brazoria

2009    YTD                307          $169,639      $155,950     $74          94%         84%         725         1285         266         96          5.6
2010    YTD                278          $166,193      $160,500     $74          97%         83%         868         1401         259         81          6.4
        Difference         -29          -$3,446       $4,550       $0           0.03        -0.01       143         116          -7          -15         0.8
        % Difference       -9.45%       -2.03%        2.92%        0.00%        3.19%       -1.19%      19.72%      9.03%        -2.63%      -15.63%     14.29%


Area:   6- Pasadena

2009    YTD                132          $112,522      $104,000     $61          96%         83%         283         406          119         108         4.2
2010    YTD                114          $102,413      $96,700      $61          96%         81%         316         469          87          83          5.7
        Difference         -18          -$10,109      -$7,300      $0           0           -0.02       33          63           -32         -25         1.5
        % Difference       -13.64%      -8.98%        -7.02%       0.00%        0.00%       -2.41%      11.66%      15.52%       -26.89%     -23.15%     35.71%


Area:   7- Clear Lake

2009    YTD                193          $170,921      $150,000     $77          96%         86%         381         521          168         77          3.7
2010    YTD                160          $187,367      $151,500     $82          96%         87%         462         649          124         71          4.8
        Difference         -33          $16,446       $1,500       $5           0           0.01        81          128          -44         -6          1.1
        % Difference       -17.10%      9.62%         1.00%        6.49%        0.00%       1.16%       21.26%      24.57%       -26.19%     -7.79%      29.73%


Area:   8- Bear Creek

2009    YTD                216          $147,022      $131,900     $62          96%         90%         497         763          178         92          4.7
2010    YTD                178          $154,864      $133,500     $68          96%         88%         528         745          143         75          4.8
        Difference         -38          $7,842        $1,600       $6           0           -0.02       31          -18          -35         -17         0.1
        % Difference       -17.59%      5.33%         1.21%        9.68%        0.00%       -2.22%      6.24%       -2.36%       -19.66%     -18.48%     2.13%


              Real Estate Data ©2010 Real Estate Center at Texas A and M University and HAR. Data computations ©2010 Prudential Gary Greene, Realtors.
Sales        Sold
                                        Average       Median       Price        to List     Coop        New         Active       Pending                 Months
Year    Month              Sales        Price         Price        per Sqft     Price       Sales       Listings    Listings     Sales       DOM         Inventory
Area:   9- The Heights

2009    YTD                180          $237,830      $227,500     $127         96%         78%         606         1133         143         98          7.2
2010    YTD                200          $240,218      $227,500     $130         96%         78%         585         1035         125         77          6.6
        Difference         20           $2,388        $0           $3           0           0           -21         -98          -18         -21         -0.6
        % Difference       11.11%       1.00%         0.00%        2.36%        0.00%       0.00%       -3.47%      -8.65%       -12.59%     -21.43%     -8.33%


Area:   10- Hempstead East

2009    YTD                171          $160,791      $155,000     $66          96%         87%         441         752          149         91          4.9
2010    YTD                173          $167,365      $157,000     $68          96%         87%         574         777          137         75          5.2
        Difference         2            $6,574        $2,000       $2           0           0           133         25           -12         -16         0.3
        % Difference       1.17%        4.09%         1.29%        3.03%        0.00%       0.00%       30.16%      3.32%        -8.05%      -17.58%     6.12%


Area:   11-Near North

2009    YTD                111          $86,744       $78,720      $47          95%         86%         229         464          105         101         5.6
2010    YTD                123          $91,235       $85,900      $51          96%         83%         286         425          97          84          5.6
        Difference         12           $4,491        $7,180       $4           0.01        -0.03       57          -39          -8          -17         0
        % Difference       10.81%       5.18%         9.12%        8.51%        1.05%       -3.49%      24.89%      -8.41%       -7.62%      -16.83%     0.00%


Area:   12- North

2009    YTD                232          $95,978       $92,750      $47          97%         88%         477         883          242         90          6.0
2010    YTD                208          $98,473       $94,000      $50          97%         80%         499         690          221         69          4.8
        Difference         -24          $2,495        $1,250       $3           0           -0.08       22          -193         -21         -21         -1.2
        % Difference       -10.34%      2.60%         1.35%        6.38%        0.00%       -9.09%      4.61%       -21.86%      -8.68%      -23.33%     -20.00%


Area:   13- Northwest

2009    YTD                265          $137,897      $122,000     $53          97%         87%         632         1123         252         99          5.4
2010    YTD                243          $155,257      $132,000     $60          96%         86%         705         1072         191         82          5.6
        Difference         -22          $17,360       $10,000      $7           -0.01       -0.01       73          -51          -61         -17         0.2
        % Difference       -8.30%       12.59%        8.20%        13.21%       -1.03%      -1.15%      11.55%      -4.54%       -24.21%     -17.17%     3.70%


Area:   14- Far Northwest

2009    YTD                185          $177,855      $141,500     $70          96%         82%         466         823          135         101         5.7
2010    YTD                171          $192,005      $156,000     $75          96%         89%         495         792          135         88          5.8
        Difference         -14          $14,150       $14,500      $5           0           0.07        29          -31          0           -13         0.1
        % Difference       -7.57%       7.96%         10.25%       7.14%        0.00%       8.54%       6.22%       -3.77%       0.00%       -12.87%     1.75%


Area:   15-Montgomery County Southwest

2009    YTD                319          $251,426      $180,000     $97          95%         79%         952         1564         273         89          5.6
2010    YTD                312          $298,032      $205,520     $107         95%         85%         988         1571         283         85          5.9
        Difference         -7           $46,606       $25,520      $10          0           0.06        36          7            10          -4          0.3
        % Difference       -2.19%       18.54%        14.18%       10.31%       0.00%       7.59%       3.78%       0.45%        3.66%       -4.49%      5.36%


Area:   16- Central Inner Loop

2009    YTD                70           $460,277      $367,500     $177         96%         77%         314         556          54          78          9.2
2010    YTD                65           $612,303      $432,500     $210         94%         82%         258         518          52          92          9.9
        Difference         -5           $152,026      $65,000      $33          -0.02       0.05        -56         -38          -2          14          0.7
        % Difference       -7.14%       33.03%        17.69%       18.64%       -2.08%      6.49%       -17.83%     -6.83%       -3.70%      17.95%      7.61%


              Real Estate Data ©2010 Real Estate Center at Texas A and M University and HAR. Data computations ©2010 Prudential Gary Greene, Realtors.
Sales        Sold
                                        Average       Median       Price        to List     Coop        New         Active       Pending                 Months
Year    Month               Sales       Price         Price        per Sqft     Price       Sales       Listings    Listings     Sales       DOM         Inventory
Area:   17-Southwest Inner Loop

2009    YTD                 63          $695,404      $607,000     $221         95%         81%         368         682          31          87          8.8
2010    YTD                 94          $628,717      $514,500     $206         93%         87%         311         604          49          110         7.9
        Difference          31          -$66,687      -$92,500     -$15         -0.02       0.06        -57         -78          18          23          -0.9
        % Difference        49.21%      -9.59%        -15.24%      -6.79%       -2.11%      7.41%       -15.49%     -11.44%      58.06%      26.44%      -10.23%


Area:   18- South Central

2009    YTD                 40          $70,567       $67,400      $45          98%         83%         81          143          37          117         6.9
2010    YTD                 13          $72,034       $73,750      $50          99%         38%         52          106          10          65          6.3
        Difference          -27         $1,467        $6,350       $5           0.01        -0.45       -29         -37          -27         -52         -0.6
        % Difference        -67.50%     2.08%         9.42%        11.11%       1.02%       -54.22%     -35.80%     -25.87%      -72.97%     -44.44%     -8.70%


Area:   19- Montgomery County Northeast

2009    YTD                 105         $139,883      $107,990     $69          92%         60%         257         454          90          97          6.0
2010    YTD                 104         $134,451      $110,900     $65          95%         77%         242         443          85          81          6.9
        Difference          -1          -$5,432       $2,910       -$4          0.03        0.17        -15         -11          -5          -16         0.9
        % Difference        -0.95%      -3.88%        2.69%        -5.80%       3.26%       28.33%      -5.84%      -2.42%       -5.56%      -16.49%     15.00%


Area:   20- Bellaire South

2009    YTD                 100         $160,006      $125,750     $78          94%         82%         244         388          77          85          4.5
2010    YTD                 76          $178,365      $162,200     $84          96%         88%         267         361          61          52          4.9
        Difference          -24         $18,359       $36,450      $6           0.02        0.06        23          -27          -16         -33         0.4
        % Difference        -24.00%     11.47%        28.99%       7.69%        2.13%       7.32%       9.43%       -6.96%       -20.78%     -38.82%     8.89%


Area:   21-Bellaire West

2009    YTD                 20          $120,516      $115,500     $61          96%         90%         75          95           25          91          5.4
2010    YTD                 22          $134,023      $130,000     $68          96%         82%         57          88           15          55          4.7
        Difference          2           $13,507       $14,500      $7           0           -0.08       -18         -7           -10         -36         -0.7
        % Difference        10.00%      11.21%        12.55%       11.48%       0.00%       -8.89%      -24.00%     -7.37%       -40.00%     -39.56%     -12.96%


Area:   22 - Central West

2009    YTD                 29          $717,974      $549,000     $210         93%         79%         143         331          14          108         8.6
2010    YTD                 54          $663,354      $426,000     $207         94%         81%         145         300          29          97          7.8
        Difference          25          -$54,620      -$123,000    -$3          0.01        0.02        2           -31          15          -11         -0.8
        % Difference        86.21%      -7.61%        -22.40%      -1.43%       1.08%       2.53%       1.40%       -9.37%       107.14%     -10.19%     -9.30%


Area:   23- Memorial

2009    YTD                 53          $672,119      $470,000     $193         93%         75%         195         343          29          87          6.9
2010    YTD                 61          $765,831      $485,000     $207         94%         70%         160         277          31          123         6.0
        Difference          8           $93,712       $15,000      $14          0.01        -0.05       -35         -66          2           36          -0.9
        % Difference        15.09%      13.94%        3.19%        7.25%        1.08%       -6.67%      -17.95%     -19.24%      6.90%       41.38%      -13.04%


Area:   24 - Spring Branch

2009    YTD                 66          $179,095      $136,250     $97          94%         82%         176         308          47          73          5.6
2010    YTD                 84          $193,585      $148,400     $100         96%         83%         201         299          44          95          6.0
        Difference          18          $14,490       $12,150      $3           0.02        0.01        25          -9           -3          22          0.4
        % Difference        27.27%      8.09%         8.92%        3.09%        2.13%       1.22%       14.20%      -2.92%       -6.38%      30.14%      7.14%


              Real Estate Data ©2010 Real Estate Center at Texas A and M University and HAR. Data computations ©2010 Prudential Gary Greene, Realtors.
Sales        Sold
                                        Average       Median       Price        to List     Coop        New         Active       Pending                 Months
Year    Month               Sales       Price         Price        per Sqft     Price       Sales       Listings    Listings     Sales       DOM         Inventory
Area:   25- Far West

2009    YTD                 334         $125,038      $113,750     $58          96%         90%         669         1081         318         100         4.8
2010    YTD                 308         $138,968      $118,110     $62          96%         92%         800         1051         291         60          4.8
        Difference          -26         $13,930       $4,360       $4           0           0.02        131         -30          -27         -40         0
        % Difference        -7.78%      11.14%        3.83%        6.90%        0.00%       2.22%       19.58%      -2.78%       -8.49%      -40.00%     0.00%


Area:   26- Waller County

2009    YTD                 27          $95,614       $74,900      $51          94%         67%         70          153          26          120         7.6
2010    YTD                 18          $141,855      $93,000      $70          96%         67%         84          148          26          94          10.5
        Difference          -9          $46,241       $18,100      $19          0.02        0           14          -5           0           -26         2.9
        % Difference        -33.33%     48.36%        24.17%       37.25%       2.13%       0.00%       20.00%      -3.27%       0.00%       -21.67%     38.16%


Area:   28- Alief Area

2009    YTD                 76          $94,166       $82,000      $50          97%         93%         218         369          73          111         6.7
2010    YTD                 65          $89,393       $86,000      $47          97%         85%         210         315          74          65          5.7
        Difference          -11         -$4,773       $4,000       -$3          0           -0.08       -8          -54          1           -46         -1
        % Difference        -14.47%     -5.07%        4.88%        -6.00%       0.00%       -8.60%      -3.67%      -14.63%      1.37%       -41.44%     -14.93%


Area:   29 - Fort Bend - Sugar Land/Stafford

2009    YTD                 123         $264,113      $202,000     $94          95%         85%         343         542          87          83          4.2
2010    YTD                 159         $274,236      $240,000     $94          94%         96%         419         567          103         80          4.5
        Difference          36          $10,123       $38,000      $0           -0.01       0.11        76          25           16          -3          0.3
        % Difference        29.27%      3.83%         18.81%       0.00%        -1.05%      12.94%      22.16%      4.61%        18.39%      -3.61%      7.14%


Area:   30 - Fort Bend East - Missouri City

2009    YTD                 140         $197,528      $175,250     $74          94%         83%         326         616          151         103         6.3
2010    YTD                 129         $201,626      $181,750     $77          94%         88%         354         589          128         80          5.6
        Difference          -11         $4,098        $6,500       $3           0           0.05        28          -27          -23         -23         -0.7
        % Difference        -7.86%      2.07%         3.71%        4.05%        0.00%       6.02%       8.59%       -4.38%       -15.23%     -22.33%     -11.11%


Area:   31-West

2009    YTD                 66          $305,435      $205,950     $108         93%         95%         219         408          61          113         6.4
2010    YTD                 69          $295,629      $229,000     $108         97%         86%         218         356          46          77          6.1
        Difference          3           -$9,806       $23,050      $0           0.04        -0.09       -1          -52          -15         -36         -0.3
        % Difference        4.55%       -3.21%        11.19%       0.00%        4.30%       -9.47%      -0.46%      -12.75%      -24.59%     -31.86%     -4.69%


Area:   32- Far Northeast

2009    YTD                 107         $179,555      $168,000     $69          96%         76%         264         419          90          99          4.8
2010    YTD                 92          $213,232      $164,000     $82          95%         79%         292         440          72          87          5.1
        Difference          -15         $33,677       -$4,000      $13          -0.01       0.03        28          21           -18         -12         0.3
        % Difference        -14.02%     18.76%        -2.38%       18.84%       -1.04%      3.95%       10.61%      5.01%        -20.00%     -12.12%     6.25%


Area:   33- Galveston

2009    YTD                 421         $158,481      $138,900     $73          94%         75%         988         1895         331         101         6.3
2010    YTD                 345         $196,911      $165,500     $88          94%         80%         1254        2427         294         100         9.1
        Difference          -76         $38,430       $26,600      $15          0           0.05        266         532          -37         -1          2.8
        % Difference        -18.05%     24.25%        19.15%       20.55%       0.00%       6.67%       26.92%      28.07%       -11.18%     -0.99%      44.44%


              Real Estate Data ©2010 Real Estate Center at Texas A and M University and HAR. Data computations ©2010 Prudential Gary Greene, Realtors.
Sales        Sold
                                        Average       Median       Price        to List     Coop        New         Active       Pending                 Months
Year    Month              Sales        Price         Price        per Sqft     Price       Sales       Listings    Listings     Sales       DOM         Inventory
Area:   34- Aldine Westfield

2009    YTD                35           $61,906       $57,000      $41          89%         74%         74          202          30          95          8.3
2010    YTD                32           $74,280       $76,000      $51          98%         88%         104         195          27          71          9.1
        Difference         -3           $12,374       $19,000      $10          0.09        0.14        30          -7           -3          -24         0.8
        % Difference       -8.57%       19.99%        33.33%       24.39%       10.11%      18.92%      40.54%      -3.47%       -10.00%     -25.26%     9.64%


Area:   35- Hempstead West

2009    YTD                146          $175,425      $154,500     $71          96%         88%         345         605          131         90          5.6
2010    YTD                149          $183,383      $154,500     $71          95%         90%         406         591          127         85          5.4
        Difference         3            $7,958        $0           $0           -0.01       0.02        61          -14          -4          -5          -0.2
        % Difference       2.05%        4.54%         0.00%        0.00%        -1.04%      2.27%       17.68%      -2.31%       -3.05%      -5.56%      -3.57%


Area:   36 - South Katy Area

2009    YTD                264          $231,863      $220,000     $82          94%         91%         594         912          248         89          4.1
2010    YTD                277          $263,074      $229,540     $89          95%         92%         672         769          250         69          3.3
        Difference         13           $31,211       $9,540       $7           0.01        0.01        78          -143         2           -20         -0.8
        % Difference       4.92%        13.46%        4.34%        8.54%        1.06%       1.10%       13.13%      -15.68%      0.81%       -22.47%     -19.51%


Area:   37 - Fort Bend West

2009    YTD                230          $171,989      $154,490     $68          95%         90%         512         869          219         102         5.4
2010    YTD                168          $182,192      $151,000     $73          94%         92%         588         849          187         86          5.4
        Difference         -62          $10,203       -$3,490      $5           -0.01       0.02        76          -20          -32         -16         0
        % Difference       -26.96%      5.93%         -2.26%       7.35%        -1.05%      2.22%       14.84%      -2.30%       -14.61%     -15.69%     0.00%


Area:   38 - Fort Bend East

2009    YTD                240          $143,292      $110,250     $61          95%         86%         394         648          198         93          4.3
2010    YTD                162          $159,480      $134,990     $65          96%         90%         445         681          154         73          5.6
        Difference         -78          $16,188       $24,740      $4           0.01        0.04        51          33           -44         -20         1.3
        % Difference       -32.50%      11.30%        22.44%       6.56%        1.05%       4.65%       12.94%      5.09%        -22.22%     -21.51%     30.23%


Area:   39 - Montgomery County Northwest

2009    YTD                132          $208,154      $155,250     $89          95%         84%         432         893          104         105         9.8
2010    YTD                120          $213,271      $169,250     $90          95%         85%         423         791          100         116         8.5
        Difference         -12          $5,117        $14,000      $1           0           0.01        -9          -102         -4          11          -1.3
        % Difference       -9.09%       2.46%         9.02%        1.12%        0.00%       1.19%       -2.08%      -11.42%      -3.85%      10.48%      -13.27%


Area:   40 - Montgomery County Southeast

2009    YTD                39           $132,827      $120,000     $64          95%         72%         171         291          50          133         7.6
2010    YTD                65           $155,799      $121,600     $75          96%         78%         192         311          53          80          7.3
        Difference         26           $22,972       $1,600       $11          0.01        0.06        21          20           3           -53         -0.3
        % Difference       66.67%       17.29%        1.33%        17.19%       1.05%       8.33%       12.28%      6.87%        6.00%       -39.85%     -3.95%


Area:   41 - Montgomery County Northwest

2009    YTD                2            $36,750       $36,750      $22          69%         0%          3           16           1           128         17.5
2010    YTD                2            $115,000      $115,000     $60          100%        0%          8           17           5           117         14.1
        Difference         0            $78,250       $78,250      $38          0.31        0           5           1            4           -11         -3.4
        % Difference       0.00%        212.93%       212.93%      172.73%      44.93%      0.00%       166.67%     6.25%        400.00%     -8.59%      -19.43%


              Real Estate Data ©2010 Real Estate Center at Texas A and M University and HAR. Data computations ©2010 Prudential Gary Greene, Realtors.
Sales        Sold
                                        Average       Median       Price        to List     Coop        New         Active       Pending                 Months
Year    Month              Sales        Price         Price        per Sqft     Price       Sales       Listings    Listings     Sales       DOM         Inventory
Area:   42 - Liberty County

2009    YTD                7            $70,314       $60,000      $46          92%         57%         39          110          8           93          16.0
2010    YTD                12           $59,708       $53,500      $46          89%         42%         26          107          8           140         14.4
        Difference         5            -$10,606      -$6,500      $0           -0.03       -0.15       -13         -3           0           47          -1.6
        % Difference       71.43%       -15.08%       -10.83%      0.00%        -3.26%      -26.32%     -33.33%     -2.73%       0.00%       50.54%      -10.00%


Area:   43 - Walker County

2009    YTD                24           $110,852      $105,000     $60          90%         58%         71          158          26          98          7.5
2010    YTD                24           $155,280      $150,000     $79          93%         71%         59          161          22          85          7.5
        Difference         0            $44,428       $45,000      $19          0.03        0.13        -12         3            -4          -13         0
        % Difference       0.00%        40.08%        42.86%       31.67%       3.33%       22.41%      -16.90%     1.90%        -15.38%     -13.27%     0.00%


Area:   44 - Polk County

2009    YTD                38           $120,968      $100,500     $66          91%         55%         109         288          25          122         12.3
2010    YTD                17           $135,568      $98,000      $81          93%         59%         108         350          14          123         13.8
        Difference         -21          $14,600       -$2,500      $15          0.02        0.04        -1          62           -11         1           1.5
        % Difference       -55.26%      12.07%        -2.49%       22.73%       2.20%       7.27%       -0.92%      21.53%       -44.00%     0.82%       12.20%


Area:   45
2009    YTD                1            $32,000       $32,000      $25          92%         0%                      2            1           39          12.0
        Difference         0            $0            $0           $0           0           0           0           0            0           0           0
        % Difference       0.00%        0.00%         0.00%        0.00%        0.00%       0.00%       0.00%       0.00%        200.00%     0.00%       0.00%


Area:   48
2009    YTD                2            $40,979       $40,980      $27          75%         50%         2           18           0           150         9.4
2010    YTD                3            $108,000      $95,000      $34          96%         67%         9           17           3           74          10.2
        Difference         1            $67,021       $54,020      $7           0.21        0.17        7           -1           3           -76         0.8
        % Difference       50.00%       163.55%       131.82%      25.93%       28.00%      34.00%      350.00%     -5.56%       0.00%       -50.67%     8.51%


Area:   50
2009    YTD                1            $114,000      $114,000     $77          99%         0%          0           0            0           45
2010    YTD                1            $43,000       $43,000      $35          86%         0%          1           0            1           184
        Difference         0            -$71,000      -$71,000     -$42         -0.13       0           1           0            1           139         0
        % Difference       0.00%        -62.28%       -62.28%      -54.55%      -13.13%     0%          0.00%       0.00%        0.00%       308.89%     0.00%


Area:   51
2009    YTD                5            $64,080       $64,900      $39          97%         80%         8           10           6           71          2.7
2010    YTD                3            $28,373       $30,000      $21          80%         100%        12          18           7           80          7.3
        Difference         -2           -$35,707      -$34,900     $14          -0.17       0.2         4           8            1           9           4.6
        % Difference       -40.00%      -55.72%       -53.78%      0.00%        -17.53%     25.00%      50.00%      80.00%       16.67%      12.68%      170.37%


              Real Estate Data ©2010 Real Estate Center at Texas A and M University and HAR. Data computations ©2010 Prudential Gary Greene, Realtors.
Sales        Sold
                                        Average       Median       Price        to List     Coop        New         Active       Pending                 Months
Year    Month              Sales        Price         Price        per Sqft     Price       Sales       Listings    Listings     Sales       DOM         Inventory

Area:   52 - Liberty County
2009    YTD                39           $94,354       $75,000      $52          94%         49%         87          181          52          132         6.1
2010    YTD                41           $85,736       $67,750      $50          95%         51%         94          222          31          89          9.5
        Difference         2            -$8,618       -$7,250      -$2          0.01        0.02        7           41           -21         -43         3.4
        % Difference       5.13%        -9.13%        -9.67%       -3.85%       1.06%       4.08%       8.05%       22.65%       -40.38%     -32.58%     55.74%


Area:   53 - Chambers County
2009    YTD                33           $161,482      $127,500     $76          98%         64%         60          125          24          121         6.3
2010    YTD                25           $180,458      $173,000     $78          97%         84%         77          145          24          76          6.9
        Difference         -8           $18,976       $45,500      $2           -0.01       0.2         17          20           0           -45         0.6
        % Difference       -24.24%      11.75%        35.69%       2.63%        -1.02%      31.25%      28.33%      16.00%       0.00%       -37.19%     9.52%


Area:   54
2009    YTD                6            $123,204      $133,910     $97          85%         50%         25          92           3           178         23.2
2010    YTD                7            $102,039      $85,000      $80          91%         57%         25          128          6           95          38.7
        Difference         1            -$21,165      -$48,910     -$17         0.06        0.07        0           36           3           -83         15.5
        % Difference       16.67%       -17.18%       -36.52%      -17.53%      7.06%       14.00%      0.00%       39.13%       100.00%     -46.63%     66.81%


Area:   55 - Wharton County
2009    YTD                18           $104,217      $93,750      $66          94%         44%         43          111          8           116         10.6
2010    YTD                20           $114,625      $93,500      $61          92%         55%         44          117          11          93          10.8
        Difference         2            $10,408       -$250        -$5          -0.02       0.11        1           6            3           -23         0.2
        % Difference       11.11%       9.99%         -0.27%       -7.58%       -2.13%      25.00%      2.33%       5.41%        37.50%      -19.83%     1.89%


Area:   56
2009    YTD                6            $122,563      $119,000     $62          89%         50%         19          53           3           95          19.1
2010    YTD                6            $111,450      $116,000     $68          92%         67%         16          44           7           116         13.5
        Difference         0            -$11,113      -$3,000      $6           0.03        0.17        -3          -9           4           21          -5.6
        % Difference       0.00%        -9.07%        -2.52%       9.68%        3.37%       34.00%      -15.79%     -16.98%      133.33%     22.11%      -29.32%


Area:   57 - Austin County
2009    YTD                24           $102,231      $83,000      $66          92%         63%         63          150          21          79          10.7
2010    YTD                14           $144,162      $138,500     $80          92%         43%         49          175          13          250         15.5
        Difference         -10          $41,931       $55,500      $14          0           -0.2        -14         25           -8          171         4.8
        % Difference       -41.67%      41.02%        66.87%       21.21%       0.00%       -31.75%     -22.22%     16.67%       -38.10%     216.46%     44.86%


Area:   58
2009    YTD                13           $186,223      $150,500     $83          95%         38%         30          51           11          84          8.8
2010    YTD                8            $147,219      $133,380     $86          96%         88%         18          43           4           110         8.4
        Difference         -5           -39004        -17120       3            0.01        0.5         -12         -8           -7          26          -0.4
        % Difference       -38.46%      -20.94%       -11.38%      3.61%        1.05%       131.58%     -40.00%     -15.69%      -63.64%     30.95%      -4.55%


              Real Estate Data ©2010 Real Estate Center at Texas A and M University and HAR. Data computations ©2010 Prudential Gary Greene, Realtors.
Sales        Sold

                                        Average       Median       Price        to List     Coop        New         Active       Pending                 Months
Year    Month              Sales        Price         Price        per Sqft     Price       Sales       Listings    Listings     Sales       DOM         Inventory

Area:   60
2009    YTD                12           $59,552       $44,000      $40          89%         42%         38          60           8           137         10.4
2010    YTD                10           $107,590      $70,000      $65          88%         20%         18          47           12          106         8.0
        Difference         -2           $48,038       $26,000      $25          -0.01       -0.22       -20         -13          4           -31         -2.4
        % Difference       -16.67%      80.67%        59.09%       62.50%       -1.12%      -52.38%     -52.63%     -21.67%      50.00%      -22.63%     -23.08%


Area:   61
2009    YTD                6            $154,046      $71,890      $75          94%         100%        13          14           11          81          2.9
2010    YTD                8            $158,300      $172,450     $86          99%         88%         26          29           9           32          5.0
        Difference         2            $4,254        $100,560     $11          0.05        -0.12       13          15           -2          -49         2.1
        % Difference       33.33%       2.76%         139.88%      14.67%       5.32%       -12.00%     100.00%     107.14%      -18.18%     -60.49%     72.41%


Area:   62
2009    YTD                1            $29,400       $29,400      $27          92%         0%          5           30                       11          13
2010    YTD                5            $103,400      $82,000      $52          95%         40%         11          27           9           227         11.5
        Difference         4            $74,000       $52,600      $25          0.03        0.4         6           -3           9           216         -1.4
        % Difference       400.00%      251.70%       178.91%      92.59%       3.26%       0.00%       120.00%     -10.00%      0.00%       1963.64%    -10.85%


Area:   63
2009    YTD                2            $139,450      $139,450     $63          92%         0%          1           19           2           248         20.7
2010    YTD                4            $55,625       $63,750      $35          89%         25%         21          40           1           79          31.0
        Difference         2            -$83,825      -$75,700     -$28         -0.03       0.25        20          21           -1          -169        10.3
        % Difference       100.00%      -60.11%       -54.28%      -44.44%      -3.26%      25.00%      2000.00%    110.53%      0.00%       -68.15%     49.76%


Area:   64 - San Jacinto County
2009    YTD                23           $98,509       $67,500      $65          89%         30%         57          139          16          116         9.0
2010    YTD                23           $120,524      $72,120      $83          92%         43%         62          179          10          108         13.1
        Difference         0            $22,015       $4,620       $18          0.03        0.13        5           40           -6          -8          4.1
        % Difference       0.00%        22.35%        6.84%        27.69%       3.37%       43.33%      8.77%       28.78%       -37.50%     -6.90%      45.56%


Area:   66

2010    YTD                2            $182,500      $182,500     $60          92%         50%         7           23                       156         37
        % Difference       0.00%        0.00%         0.00%        0.00%        0.00%       0.00%       0.00%       0.00%        0.00%       0.00%       0.00%


              Real Estate Data ©2010 Real Estate Center at Texas A and M University and HAR. Data computations ©2010 Prudential Gary Greene, Realtors.
Area:   69
2010    YTD                1            $220,000      $220,000     $120         88%         0%          3           21                       55          36.0
        % Difference       0.00%        0.00%         0.00%        0.00%        0.00%       0.00%       0.00%       0.00%        0.00%       0.00%       0.00%


Area:   77
2009    YTD                1            $132,500      $132,500     $65          100%        0%          2           14           1           12          8.0
2010    YTD                3            $80,667       $103,000     $56          97%         33%         9           12           3           224         7.8
        Difference         2            -$51,833      -$29,500     -$9          -0.03       0.33        7           -2           2           212         -0.2

        % Difference       200.00%      -39.12%       -22.26%      -13.85%      -3.00%      0.00%       350.00%     -14.29%      200.00%     1766.67%    -2.50%


              Real Estate Data ©2010 Real Estate Center at Texas A and M University and HAR. Data computations ©2010 Prudential Gary Greene, Realtors.

Weitere ähnliche Inhalte

Was ist angesagt?

August 2021 market watch
August 2021 market watchAugust 2021 market watch
August 2021 market watchMichelle Makos
 
1Q10 final
1Q10 final 1Q10 final
1Q10 final Localiza
 
Federal Budget Outlays
Federal Budget OutlaysFederal Budget Outlays
Federal Budget Outlaysbrucekaufman
 
Updated Year to Date Comparison
Updated Year to Date ComparisonUpdated Year to Date Comparison
Updated Year to Date Comparisonnjhousehelper
 
Mk version2
Mk version2Mk version2
Mk version2owlpics
 
brunswick annual reports 2005
brunswick annual reports 2005brunswick annual reports 2005
brunswick annual reports 2005finance36
 
Year To Date Comparison
Year To Date ComparisonYear To Date Comparison
Year To Date Comparisonnjhousehelper
 
June Market Report 2014
June Market Report 2014June Market Report 2014
June Market Report 2014Michelle Makos
 
Grendene - 3rd Qquarter 2007 Earnings
Grendene - 3rd Qquarter 2007 EarningsGrendene - 3rd Qquarter 2007 Earnings
Grendene - 3rd Qquarter 2007 EarningsGrendene
 
Q1 2009 Earning Report of Northern Trust Corporation
Q1 2009 Earning Report of Northern Trust CorporationQ1 2009 Earning Report of Northern Trust Corporation
Q1 2009 Earning Report of Northern Trust Corporationearningreport earningreport
 
Electronic Security Expo 2012 Attrition Toolbox
Electronic Security Expo 2012 Attrition ToolboxElectronic Security Expo 2012 Attrition Toolbox
Electronic Security Expo 2012 Attrition Toolboxstevespott
 
2002* 2002 Farnborough Air Show Financial Results In Us Gaap
2002* 2002 Farnborough Air Show   Financial Results In Us Gaap2002* 2002 Farnborough Air Show   Financial Results In Us Gaap
2002* 2002 Farnborough Air Show Financial Results In Us GaapEmbraer RI
 
Call presentation 3 q11
Call presentation  3 q11Call presentation  3 q11
Call presentation 3 q11Arteris S.A.
 
Call presentation 3 q11
Call presentation  3 q11Call presentation  3 q11
Call presentation 3 q11Arteris S.A.
 
Analysis of S&P500 financial sector
Analysis of S&P500 financial sectorAnalysis of S&P500 financial sector
Analysis of S&P500 financial sectorJean. G. Ndoutoum
 
Palm Springs Area Listings Sold By Calendar Quarter (Through March 2010)
Palm Springs Area Listings Sold By Calendar Quarter (Through March 2010)Palm Springs Area Listings Sold By Calendar Quarter (Through March 2010)
Palm Springs Area Listings Sold By Calendar Quarter (Through March 2010)SDM: Music Venture
 

Was ist angesagt? (19)

August 2021 market watch
August 2021 market watchAugust 2021 market watch
August 2021 market watch
 
1Q10 final
1Q10 final 1Q10 final
1Q10 final
 
Federal Budget Outlays
Federal Budget OutlaysFederal Budget Outlays
Federal Budget Outlays
 
Updated Year to Date Comparison
Updated Year to Date ComparisonUpdated Year to Date Comparison
Updated Year to Date Comparison
 
Mk version2
Mk version2Mk version2
Mk version2
 
Ohl Apr Eng
Ohl Apr EngOhl Apr Eng
Ohl Apr Eng
 
brunswick annual reports 2005
brunswick annual reports 2005brunswick annual reports 2005
brunswick annual reports 2005
 
Year To Date Comparison
Year To Date ComparisonYear To Date Comparison
Year To Date Comparison
 
June Market Report 2014
June Market Report 2014June Market Report 2014
June Market Report 2014
 
Grendene - 3rd Qquarter 2007 Earnings
Grendene - 3rd Qquarter 2007 EarningsGrendene - 3rd Qquarter 2007 Earnings
Grendene - 3rd Qquarter 2007 Earnings
 
Q1 2009 Earning Report of Northern Trust Corporation
Q1 2009 Earning Report of Northern Trust CorporationQ1 2009 Earning Report of Northern Trust Corporation
Q1 2009 Earning Report of Northern Trust Corporation
 
Jan Tmo
Jan TmoJan Tmo
Jan Tmo
 
Electronic Security Expo 2012 Attrition Toolbox
Electronic Security Expo 2012 Attrition ToolboxElectronic Security Expo 2012 Attrition Toolbox
Electronic Security Expo 2012 Attrition Toolbox
 
2002* 2002 Farnborough Air Show Financial Results In Us Gaap
2002* 2002 Farnborough Air Show   Financial Results In Us Gaap2002* 2002 Farnborough Air Show   Financial Results In Us Gaap
2002* 2002 Farnborough Air Show Financial Results In Us Gaap
 
Call presentation 3 q11
Call presentation  3 q11Call presentation  3 q11
Call presentation 3 q11
 
Call presentation 3 q11
Call presentation  3 q11Call presentation  3 q11
Call presentation 3 q11
 
Analysis of S&P500 financial sector
Analysis of S&P500 financial sectorAnalysis of S&P500 financial sector
Analysis of S&P500 financial sector
 
Palm Springs Area Listings Sold By Calendar Quarter (Through March 2010)
Palm Springs Area Listings Sold By Calendar Quarter (Through March 2010)Palm Springs Area Listings Sold By Calendar Quarter (Through March 2010)
Palm Springs Area Listings Sold By Calendar Quarter (Through March 2010)
 
Rebgv june 2012 stats
Rebgv june 2012 statsRebgv june 2012 stats
Rebgv june 2012 stats
 

Ähnlich wie Houston Market Report February 2010

Caída Publicidad EEUU 2009
Caída Publicidad EEUU 2009Caída Publicidad EEUU 2009
Caída Publicidad EEUU 2009Juan Varela
 
Naa Annual Newspaper Ad Expenditures 09
Naa Annual Newspaper Ad Expenditures 09Naa Annual Newspaper Ad Expenditures 09
Naa Annual Newspaper Ad Expenditures 09Juan Varela
 
Vancouver real estate february 2012 stats package rebgv
Vancouver real estate february 2012 stats package rebgvVancouver real estate february 2012 stats package rebgv
Vancouver real estate february 2012 stats package rebgvMatt Collinge
 
2008 Annual Newspaper Ad Expenditures
2008 Annual Newspaper Ad Expenditures2008 Annual Newspaper Ad Expenditures
2008 Annual Newspaper Ad ExpendituresJuan Varela
 
Vancouver real estate rebgv stats package january 2011
Vancouver real estate rebgv stats package january 2011Vancouver real estate rebgv stats package january 2011
Vancouver real estate rebgv stats package january 2011Matt Collinge
 
Gta office market statistics q3 2011
Gta office market statistics q3 2011Gta office market statistics q3 2011
Gta office market statistics q3 2011Chris Fyvie
 
101842285 july-2012-rebgv-stats-package-adam-scalena
101842285 july-2012-rebgv-stats-package-adam-scalena101842285 july-2012-rebgv-stats-package-adam-scalena
101842285 july-2012-rebgv-stats-package-adam-scalenavancouverhomesteam
 
REBGV Stats Package August 2012
REBGV Stats Package August 2012REBGV Stats Package August 2012
REBGV Stats Package August 2012vancouverhomesteam
 
July 2021 - Market Report
July 2021 - Market Report July 2021 - Market Report
July 2021 - Market Report Michelle Makos
 
Vancouver real estate stats package, june 2011
Vancouver real estate stats package, june 2011Vancouver real estate stats package, june 2011
Vancouver real estate stats package, june 2011Matt Collinge
 
Vancouver real estate stats package September 2011
Vancouver real estate stats package September 2011Vancouver real estate stats package September 2011
Vancouver real estate stats package September 2011Matt Collinge
 
REBGV Stats for Sept 2011 Mike Stewart
REBGV Stats for Sept 2011 Mike StewartREBGV Stats for Sept 2011 Mike Stewart
REBGV Stats for Sept 2011 Mike StewartMike Stewart
 
Vancouver Real Estate December 2012 Stats Package REBGV
Vancouver Real Estate December 2012 Stats Package REBGVVancouver Real Estate December 2012 Stats Package REBGV
Vancouver Real Estate December 2012 Stats Package REBGVMatt Collinge
 
Vancouver real estate stats package, December 2011
Vancouver real estate stats package, December 2011Vancouver real estate stats package, December 2011
Vancouver real estate stats package, December 2011Matt Collinge
 
REBGV Stats for December 2011 Courtesy Mike Stewart Vancouver Realtor
REBGV Stats for December 2011 Courtesy Mike Stewart Vancouver RealtorREBGV Stats for December 2011 Courtesy Mike Stewart Vancouver Realtor
REBGV Stats for December 2011 Courtesy Mike Stewart Vancouver RealtorMike Stewart
 

Ähnlich wie Houston Market Report February 2010 (20)

Caída Publicidad EEUU 2009
Caída Publicidad EEUU 2009Caída Publicidad EEUU 2009
Caída Publicidad EEUU 2009
 
Naa Annual Newspaper Ad Expenditures 09
Naa Annual Newspaper Ad Expenditures 09Naa Annual Newspaper Ad Expenditures 09
Naa Annual Newspaper Ad Expenditures 09
 
Vancouver real estate february 2012 stats package rebgv
Vancouver real estate february 2012 stats package rebgvVancouver real estate february 2012 stats package rebgv
Vancouver real estate february 2012 stats package rebgv
 
2008 Annual Newspaper Ad Expenditures
2008 Annual Newspaper Ad Expenditures2008 Annual Newspaper Ad Expenditures
2008 Annual Newspaper Ad Expenditures
 
Vancouver real estate rebgv stats package january 2011
Vancouver real estate rebgv stats package january 2011Vancouver real estate rebgv stats package january 2011
Vancouver real estate rebgv stats package january 2011
 
Gta office market statistics q3 2011
Gta office market statistics q3 2011Gta office market statistics q3 2011
Gta office market statistics q3 2011
 
Roy Fisher Outlook 2012
Roy Fisher Outlook 2012Roy Fisher Outlook 2012
Roy Fisher Outlook 2012
 
101842285 july-2012-rebgv-stats-package-adam-scalena
101842285 july-2012-rebgv-stats-package-adam-scalena101842285 july-2012-rebgv-stats-package-adam-scalena
101842285 july-2012-rebgv-stats-package-adam-scalena
 
REBGV Stats Package August 2012
REBGV Stats Package August 2012REBGV Stats Package August 2012
REBGV Stats Package August 2012
 
July 2021 - Market Report
July 2021 - Market Report July 2021 - Market Report
July 2021 - Market Report
 
Vancouver real estate stats package, june 2011
Vancouver real estate stats package, june 2011Vancouver real estate stats package, june 2011
Vancouver real estate stats package, june 2011
 
Dalkeith
DalkeithDalkeith
Dalkeith
 
REBGV Stats Package Oct 2012
REBGV Stats Package Oct 2012REBGV Stats Package Oct 2012
REBGV Stats Package Oct 2012
 
Vancouver real estate stats package September 2011
Vancouver real estate stats package September 2011Vancouver real estate stats package September 2011
Vancouver real estate stats package September 2011
 
September 2011 REBGV
September 2011 REBGV September 2011 REBGV
September 2011 REBGV
 
REBGV Stats for Sept 2011 Mike Stewart
REBGV Stats for Sept 2011 Mike StewartREBGV Stats for Sept 2011 Mike Stewart
REBGV Stats for Sept 2011 Mike Stewart
 
REBGV dec 2012 stats package
REBGV dec 2012 stats packageREBGV dec 2012 stats package
REBGV dec 2012 stats package
 
Vancouver Real Estate December 2012 Stats Package REBGV
Vancouver Real Estate December 2012 Stats Package REBGVVancouver Real Estate December 2012 Stats Package REBGV
Vancouver Real Estate December 2012 Stats Package REBGV
 
Vancouver real estate stats package, December 2011
Vancouver real estate stats package, December 2011Vancouver real estate stats package, December 2011
Vancouver real estate stats package, December 2011
 
REBGV Stats for December 2011 Courtesy Mike Stewart Vancouver Realtor
REBGV Stats for December 2011 Courtesy Mike Stewart Vancouver RealtorREBGV Stats for December 2011 Courtesy Mike Stewart Vancouver Realtor
REBGV Stats for December 2011 Courtesy Mike Stewart Vancouver Realtor
 

Houston Market Report February 2010

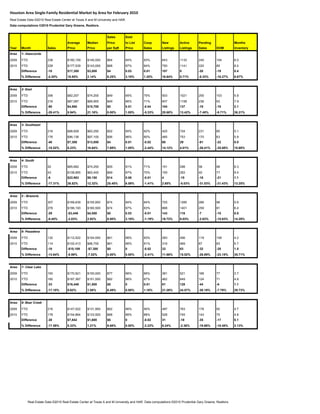
  • 1. Houston Area Single‐Family Residential Market by Area for February 2010 Real Estate Data ©2010 Real Estate Center at Texas A and M University and HAR. Data computations ©2010 Prudential Gary Greene, Realtors. Sales Sold Average Median Price to List Coop New Active Pending Months Year Month Sales Price Price per Sqft Price Sales Listings Listings Sales DOM Inventory Area 1- Atascocita 2009 YTD 238 $160,159 $140,000 $64 94% 83% 643 1133 240 104 6.0 2010 YTD 228 $177,539 $143,000 $68 97% 84% 750 1141 220 85 6.4 Difference -10 $17,380 $3,000 $4 0.03 0.01 107 8 -20 -19 0.4 % Difference -4.20% 10.85% 2.14% 6.25% 3.19% 1.20% 16.64% 0.71% -8.33% -18.27% 6.67% Area 2- East 2009 YTD 306 $82,207 $74,200 $49 95% 75% 503 1021 255 103 5.8 2010 YTD 216 $87,087 $89,900 $49 96% 71% 607 1158 236 93 7.9 Difference -90 $4,880 $15,700 $0 0.01 -0.04 104 137 -19 -10 2.1 % Difference -29.41% 5.94% 21.16% 0.00% 1.05% -5.33% 20.68% 13.42% -7.45% -9.71% 36.21% Area 3- Southeast 2009 YTD 216 $88,828 $83,250 $52 95% 82% 425 724 231 85 5.1 2010 YTD 176 $96,136 $97,100 $56 96% 80% 485 753 170 63 5.9 Difference -40 $7,308 $13,850 $4 0.01 -0.02 60 29 -61 -22 0.8 % Difference -18.52% 8.23% 16.64% 7.69% 1.05% -2.44% 14.12% 4.01% -26.41% -25.88% 15.69% Area 4- South 2009 YTD 52 $85,682 $74,250 $55 91% 71% 151 298 58 98 8.3 2010 YTD 43 $108,665 $83,400 $69 97% 70% 155 283 40 77 9.4 Difference -9 $22,983 $9,150 $14 0.06 -0.01 4 -15 -18 -21 1.1 % Difference -17.31% 26.82% 12.32% 25.45% 6.59% -1.41% 2.65% -5.03% -31.03% -21.43% 13.25% Area: 5 - Brazoria 2009 YTD 307 $169,639 $155,950 $74 94% 84% 725 1285 266 96 5.6 2010 YTD 278 $166,193 $160,500 $74 97% 83% 868 1401 259 81 6.4 Difference -29 -$3,446 $4,550 $0 0.03 -0.01 143 116 -7 -15 0.8 % Difference -9.45% -2.03% 2.92% 0.00% 3.19% -1.19% 19.72% 9.03% -2.63% -15.63% 14.29% Area: 6- Pasadena 2009 YTD 132 $112,522 $104,000 $61 96% 83% 283 406 119 108 4.2 2010 YTD 114 $102,413 $96,700 $61 96% 81% 316 469 87 83 5.7 Difference -18 -$10,109 -$7,300 $0 0 -0.02 33 63 -32 -25 1.5 % Difference -13.64% -8.98% -7.02% 0.00% 0.00% -2.41% 11.66% 15.52% -26.89% -23.15% 35.71% Area: 7- Clear Lake 2009 YTD 193 $170,921 $150,000 $77 96% 86% 381 521 168 77 3.7 2010 YTD 160 $187,367 $151,500 $82 96% 87% 462 649 124 71 4.8 Difference -33 $16,446 $1,500 $5 0 0.01 81 128 -44 -6 1.1 % Difference -17.10% 9.62% 1.00% 6.49% 0.00% 1.16% 21.26% 24.57% -26.19% -7.79% 29.73% Area: 8- Bear Creek 2009 YTD 216 $147,022 $131,900 $62 96% 90% 497 763 178 92 4.7 2010 YTD 178 $154,864 $133,500 $68 96% 88% 528 745 143 75 4.8 Difference -38 $7,842 $1,600 $6 0 -0.02 31 -18 -35 -17 0.1 % Difference -17.59% 5.33% 1.21% 9.68% 0.00% -2.22% 6.24% -2.36% -19.66% -18.48% 2.13% Real Estate Data ©2010 Real Estate Center at Texas A and M University and HAR. Data computations ©2010 Prudential Gary Greene, Realtors.
  • 2. Sales Sold Average Median Price to List Coop New Active Pending Months Year Month Sales Price Price per Sqft Price Sales Listings Listings Sales DOM Inventory Area: 9- The Heights 2009 YTD 180 $237,830 $227,500 $127 96% 78% 606 1133 143 98 7.2 2010 YTD 200 $240,218 $227,500 $130 96% 78% 585 1035 125 77 6.6 Difference 20 $2,388 $0 $3 0 0 -21 -98 -18 -21 -0.6 % Difference 11.11% 1.00% 0.00% 2.36% 0.00% 0.00% -3.47% -8.65% -12.59% -21.43% -8.33% Area: 10- Hempstead East 2009 YTD 171 $160,791 $155,000 $66 96% 87% 441 752 149 91 4.9 2010 YTD 173 $167,365 $157,000 $68 96% 87% 574 777 137 75 5.2 Difference 2 $6,574 $2,000 $2 0 0 133 25 -12 -16 0.3 % Difference 1.17% 4.09% 1.29% 3.03% 0.00% 0.00% 30.16% 3.32% -8.05% -17.58% 6.12% Area: 11-Near North 2009 YTD 111 $86,744 $78,720 $47 95% 86% 229 464 105 101 5.6 2010 YTD 123 $91,235 $85,900 $51 96% 83% 286 425 97 84 5.6 Difference 12 $4,491 $7,180 $4 0.01 -0.03 57 -39 -8 -17 0 % Difference 10.81% 5.18% 9.12% 8.51% 1.05% -3.49% 24.89% -8.41% -7.62% -16.83% 0.00% Area: 12- North 2009 YTD 232 $95,978 $92,750 $47 97% 88% 477 883 242 90 6.0 2010 YTD 208 $98,473 $94,000 $50 97% 80% 499 690 221 69 4.8 Difference -24 $2,495 $1,250 $3 0 -0.08 22 -193 -21 -21 -1.2 % Difference -10.34% 2.60% 1.35% 6.38% 0.00% -9.09% 4.61% -21.86% -8.68% -23.33% -20.00% Area: 13- Northwest 2009 YTD 265 $137,897 $122,000 $53 97% 87% 632 1123 252 99 5.4 2010 YTD 243 $155,257 $132,000 $60 96% 86% 705 1072 191 82 5.6 Difference -22 $17,360 $10,000 $7 -0.01 -0.01 73 -51 -61 -17 0.2 % Difference -8.30% 12.59% 8.20% 13.21% -1.03% -1.15% 11.55% -4.54% -24.21% -17.17% 3.70% Area: 14- Far Northwest 2009 YTD 185 $177,855 $141,500 $70 96% 82% 466 823 135 101 5.7 2010 YTD 171 $192,005 $156,000 $75 96% 89% 495 792 135 88 5.8 Difference -14 $14,150 $14,500 $5 0 0.07 29 -31 0 -13 0.1 % Difference -7.57% 7.96% 10.25% 7.14% 0.00% 8.54% 6.22% -3.77% 0.00% -12.87% 1.75% Area: 15-Montgomery County Southwest 2009 YTD 319 $251,426 $180,000 $97 95% 79% 952 1564 273 89 5.6 2010 YTD 312 $298,032 $205,520 $107 95% 85% 988 1571 283 85 5.9 Difference -7 $46,606 $25,520 $10 0 0.06 36 7 10 -4 0.3 % Difference -2.19% 18.54% 14.18% 10.31% 0.00% 7.59% 3.78% 0.45% 3.66% -4.49% 5.36% Area: 16- Central Inner Loop 2009 YTD 70 $460,277 $367,500 $177 96% 77% 314 556 54 78 9.2 2010 YTD 65 $612,303 $432,500 $210 94% 82% 258 518 52 92 9.9 Difference -5 $152,026 $65,000 $33 -0.02 0.05 -56 -38 -2 14 0.7 % Difference -7.14% 33.03% 17.69% 18.64% -2.08% 6.49% -17.83% -6.83% -3.70% 17.95% 7.61% Real Estate Data ©2010 Real Estate Center at Texas A and M University and HAR. Data computations ©2010 Prudential Gary Greene, Realtors.
  • 3. Sales Sold Average Median Price to List Coop New Active Pending Months Year Month Sales Price Price per Sqft Price Sales Listings Listings Sales DOM Inventory Area: 17-Southwest Inner Loop 2009 YTD 63 $695,404 $607,000 $221 95% 81% 368 682 31 87 8.8 2010 YTD 94 $628,717 $514,500 $206 93% 87% 311 604 49 110 7.9 Difference 31 -$66,687 -$92,500 -$15 -0.02 0.06 -57 -78 18 23 -0.9 % Difference 49.21% -9.59% -15.24% -6.79% -2.11% 7.41% -15.49% -11.44% 58.06% 26.44% -10.23% Area: 18- South Central 2009 YTD 40 $70,567 $67,400 $45 98% 83% 81 143 37 117 6.9 2010 YTD 13 $72,034 $73,750 $50 99% 38% 52 106 10 65 6.3 Difference -27 $1,467 $6,350 $5 0.01 -0.45 -29 -37 -27 -52 -0.6 % Difference -67.50% 2.08% 9.42% 11.11% 1.02% -54.22% -35.80% -25.87% -72.97% -44.44% -8.70% Area: 19- Montgomery County Northeast 2009 YTD 105 $139,883 $107,990 $69 92% 60% 257 454 90 97 6.0 2010 YTD 104 $134,451 $110,900 $65 95% 77% 242 443 85 81 6.9 Difference -1 -$5,432 $2,910 -$4 0.03 0.17 -15 -11 -5 -16 0.9 % Difference -0.95% -3.88% 2.69% -5.80% 3.26% 28.33% -5.84% -2.42% -5.56% -16.49% 15.00% Area: 20- Bellaire South 2009 YTD 100 $160,006 $125,750 $78 94% 82% 244 388 77 85 4.5 2010 YTD 76 $178,365 $162,200 $84 96% 88% 267 361 61 52 4.9 Difference -24 $18,359 $36,450 $6 0.02 0.06 23 -27 -16 -33 0.4 % Difference -24.00% 11.47% 28.99% 7.69% 2.13% 7.32% 9.43% -6.96% -20.78% -38.82% 8.89% Area: 21-Bellaire West 2009 YTD 20 $120,516 $115,500 $61 96% 90% 75 95 25 91 5.4 2010 YTD 22 $134,023 $130,000 $68 96% 82% 57 88 15 55 4.7 Difference 2 $13,507 $14,500 $7 0 -0.08 -18 -7 -10 -36 -0.7 % Difference 10.00% 11.21% 12.55% 11.48% 0.00% -8.89% -24.00% -7.37% -40.00% -39.56% -12.96% Area: 22 - Central West 2009 YTD 29 $717,974 $549,000 $210 93% 79% 143 331 14 108 8.6 2010 YTD 54 $663,354 $426,000 $207 94% 81% 145 300 29 97 7.8 Difference 25 -$54,620 -$123,000 -$3 0.01 0.02 2 -31 15 -11 -0.8 % Difference 86.21% -7.61% -22.40% -1.43% 1.08% 2.53% 1.40% -9.37% 107.14% -10.19% -9.30% Area: 23- Memorial 2009 YTD 53 $672,119 $470,000 $193 93% 75% 195 343 29 87 6.9 2010 YTD 61 $765,831 $485,000 $207 94% 70% 160 277 31 123 6.0 Difference 8 $93,712 $15,000 $14 0.01 -0.05 -35 -66 2 36 -0.9 % Difference 15.09% 13.94% 3.19% 7.25% 1.08% -6.67% -17.95% -19.24% 6.90% 41.38% -13.04% Area: 24 - Spring Branch 2009 YTD 66 $179,095 $136,250 $97 94% 82% 176 308 47 73 5.6 2010 YTD 84 $193,585 $148,400 $100 96% 83% 201 299 44 95 6.0 Difference 18 $14,490 $12,150 $3 0.02 0.01 25 -9 -3 22 0.4 % Difference 27.27% 8.09% 8.92% 3.09% 2.13% 1.22% 14.20% -2.92% -6.38% 30.14% 7.14% Real Estate Data ©2010 Real Estate Center at Texas A and M University and HAR. Data computations ©2010 Prudential Gary Greene, Realtors.
  • 4. Sales Sold Average Median Price to List Coop New Active Pending Months Year Month Sales Price Price per Sqft Price Sales Listings Listings Sales DOM Inventory Area: 25- Far West 2009 YTD 334 $125,038 $113,750 $58 96% 90% 669 1081 318 100 4.8 2010 YTD 308 $138,968 $118,110 $62 96% 92% 800 1051 291 60 4.8 Difference -26 $13,930 $4,360 $4 0 0.02 131 -30 -27 -40 0 % Difference -7.78% 11.14% 3.83% 6.90% 0.00% 2.22% 19.58% -2.78% -8.49% -40.00% 0.00% Area: 26- Waller County 2009 YTD 27 $95,614 $74,900 $51 94% 67% 70 153 26 120 7.6 2010 YTD 18 $141,855 $93,000 $70 96% 67% 84 148 26 94 10.5 Difference -9 $46,241 $18,100 $19 0.02 0 14 -5 0 -26 2.9 % Difference -33.33% 48.36% 24.17% 37.25% 2.13% 0.00% 20.00% -3.27% 0.00% -21.67% 38.16% Area: 28- Alief Area 2009 YTD 76 $94,166 $82,000 $50 97% 93% 218 369 73 111 6.7 2010 YTD 65 $89,393 $86,000 $47 97% 85% 210 315 74 65 5.7 Difference -11 -$4,773 $4,000 -$3 0 -0.08 -8 -54 1 -46 -1 % Difference -14.47% -5.07% 4.88% -6.00% 0.00% -8.60% -3.67% -14.63% 1.37% -41.44% -14.93% Area: 29 - Fort Bend - Sugar Land/Stafford 2009 YTD 123 $264,113 $202,000 $94 95% 85% 343 542 87 83 4.2 2010 YTD 159 $274,236 $240,000 $94 94% 96% 419 567 103 80 4.5 Difference 36 $10,123 $38,000 $0 -0.01 0.11 76 25 16 -3 0.3 % Difference 29.27% 3.83% 18.81% 0.00% -1.05% 12.94% 22.16% 4.61% 18.39% -3.61% 7.14% Area: 30 - Fort Bend East - Missouri City 2009 YTD 140 $197,528 $175,250 $74 94% 83% 326 616 151 103 6.3 2010 YTD 129 $201,626 $181,750 $77 94% 88% 354 589 128 80 5.6 Difference -11 $4,098 $6,500 $3 0 0.05 28 -27 -23 -23 -0.7 % Difference -7.86% 2.07% 3.71% 4.05% 0.00% 6.02% 8.59% -4.38% -15.23% -22.33% -11.11% Area: 31-West 2009 YTD 66 $305,435 $205,950 $108 93% 95% 219 408 61 113 6.4 2010 YTD 69 $295,629 $229,000 $108 97% 86% 218 356 46 77 6.1 Difference 3 -$9,806 $23,050 $0 0.04 -0.09 -1 -52 -15 -36 -0.3 % Difference 4.55% -3.21% 11.19% 0.00% 4.30% -9.47% -0.46% -12.75% -24.59% -31.86% -4.69% Area: 32- Far Northeast 2009 YTD 107 $179,555 $168,000 $69 96% 76% 264 419 90 99 4.8 2010 YTD 92 $213,232 $164,000 $82 95% 79% 292 440 72 87 5.1 Difference -15 $33,677 -$4,000 $13 -0.01 0.03 28 21 -18 -12 0.3 % Difference -14.02% 18.76% -2.38% 18.84% -1.04% 3.95% 10.61% 5.01% -20.00% -12.12% 6.25% Area: 33- Galveston 2009 YTD 421 $158,481 $138,900 $73 94% 75% 988 1895 331 101 6.3 2010 YTD 345 $196,911 $165,500 $88 94% 80% 1254 2427 294 100 9.1 Difference -76 $38,430 $26,600 $15 0 0.05 266 532 -37 -1 2.8 % Difference -18.05% 24.25% 19.15% 20.55% 0.00% 6.67% 26.92% 28.07% -11.18% -0.99% 44.44% Real Estate Data ©2010 Real Estate Center at Texas A and M University and HAR. Data computations ©2010 Prudential Gary Greene, Realtors.
  • 5. Sales Sold Average Median Price to List Coop New Active Pending Months Year Month Sales Price Price per Sqft Price Sales Listings Listings Sales DOM Inventory Area: 34- Aldine Westfield 2009 YTD 35 $61,906 $57,000 $41 89% 74% 74 202 30 95 8.3 2010 YTD 32 $74,280 $76,000 $51 98% 88% 104 195 27 71 9.1 Difference -3 $12,374 $19,000 $10 0.09 0.14 30 -7 -3 -24 0.8 % Difference -8.57% 19.99% 33.33% 24.39% 10.11% 18.92% 40.54% -3.47% -10.00% -25.26% 9.64% Area: 35- Hempstead West 2009 YTD 146 $175,425 $154,500 $71 96% 88% 345 605 131 90 5.6 2010 YTD 149 $183,383 $154,500 $71 95% 90% 406 591 127 85 5.4 Difference 3 $7,958 $0 $0 -0.01 0.02 61 -14 -4 -5 -0.2 % Difference 2.05% 4.54% 0.00% 0.00% -1.04% 2.27% 17.68% -2.31% -3.05% -5.56% -3.57% Area: 36 - South Katy Area 2009 YTD 264 $231,863 $220,000 $82 94% 91% 594 912 248 89 4.1 2010 YTD 277 $263,074 $229,540 $89 95% 92% 672 769 250 69 3.3 Difference 13 $31,211 $9,540 $7 0.01 0.01 78 -143 2 -20 -0.8 % Difference 4.92% 13.46% 4.34% 8.54% 1.06% 1.10% 13.13% -15.68% 0.81% -22.47% -19.51% Area: 37 - Fort Bend West 2009 YTD 230 $171,989 $154,490 $68 95% 90% 512 869 219 102 5.4 2010 YTD 168 $182,192 $151,000 $73 94% 92% 588 849 187 86 5.4 Difference -62 $10,203 -$3,490 $5 -0.01 0.02 76 -20 -32 -16 0 % Difference -26.96% 5.93% -2.26% 7.35% -1.05% 2.22% 14.84% -2.30% -14.61% -15.69% 0.00% Area: 38 - Fort Bend East 2009 YTD 240 $143,292 $110,250 $61 95% 86% 394 648 198 93 4.3 2010 YTD 162 $159,480 $134,990 $65 96% 90% 445 681 154 73 5.6 Difference -78 $16,188 $24,740 $4 0.01 0.04 51 33 -44 -20 1.3 % Difference -32.50% 11.30% 22.44% 6.56% 1.05% 4.65% 12.94% 5.09% -22.22% -21.51% 30.23% Area: 39 - Montgomery County Northwest 2009 YTD 132 $208,154 $155,250 $89 95% 84% 432 893 104 105 9.8 2010 YTD 120 $213,271 $169,250 $90 95% 85% 423 791 100 116 8.5 Difference -12 $5,117 $14,000 $1 0 0.01 -9 -102 -4 11 -1.3 % Difference -9.09% 2.46% 9.02% 1.12% 0.00% 1.19% -2.08% -11.42% -3.85% 10.48% -13.27% Area: 40 - Montgomery County Southeast 2009 YTD 39 $132,827 $120,000 $64 95% 72% 171 291 50 133 7.6 2010 YTD 65 $155,799 $121,600 $75 96% 78% 192 311 53 80 7.3 Difference 26 $22,972 $1,600 $11 0.01 0.06 21 20 3 -53 -0.3 % Difference 66.67% 17.29% 1.33% 17.19% 1.05% 8.33% 12.28% 6.87% 6.00% -39.85% -3.95% Area: 41 - Montgomery County Northwest 2009 YTD 2 $36,750 $36,750 $22 69% 0% 3 16 1 128 17.5 2010 YTD 2 $115,000 $115,000 $60 100% 0% 8 17 5 117 14.1 Difference 0 $78,250 $78,250 $38 0.31 0 5 1 4 -11 -3.4 % Difference 0.00% 212.93% 212.93% 172.73% 44.93% 0.00% 166.67% 6.25% 400.00% -8.59% -19.43% Real Estate Data ©2010 Real Estate Center at Texas A and M University and HAR. Data computations ©2010 Prudential Gary Greene, Realtors.
  • 6. Sales Sold Average Median Price to List Coop New Active Pending Months Year Month Sales Price Price per Sqft Price Sales Listings Listings Sales DOM Inventory Area: 42 - Liberty County 2009 YTD 7 $70,314 $60,000 $46 92% 57% 39 110 8 93 16.0 2010 YTD 12 $59,708 $53,500 $46 89% 42% 26 107 8 140 14.4 Difference 5 -$10,606 -$6,500 $0 -0.03 -0.15 -13 -3 0 47 -1.6 % Difference 71.43% -15.08% -10.83% 0.00% -3.26% -26.32% -33.33% -2.73% 0.00% 50.54% -10.00% Area: 43 - Walker County 2009 YTD 24 $110,852 $105,000 $60 90% 58% 71 158 26 98 7.5 2010 YTD 24 $155,280 $150,000 $79 93% 71% 59 161 22 85 7.5 Difference 0 $44,428 $45,000 $19 0.03 0.13 -12 3 -4 -13 0 % Difference 0.00% 40.08% 42.86% 31.67% 3.33% 22.41% -16.90% 1.90% -15.38% -13.27% 0.00% Area: 44 - Polk County 2009 YTD 38 $120,968 $100,500 $66 91% 55% 109 288 25 122 12.3 2010 YTD 17 $135,568 $98,000 $81 93% 59% 108 350 14 123 13.8 Difference -21 $14,600 -$2,500 $15 0.02 0.04 -1 62 -11 1 1.5 % Difference -55.26% 12.07% -2.49% 22.73% 2.20% 7.27% -0.92% 21.53% -44.00% 0.82% 12.20% Area: 45 2009 YTD 1 $32,000 $32,000 $25 92% 0% 2 1 39 12.0 Difference 0 $0 $0 $0 0 0 0 0 0 0 0 % Difference 0.00% 0.00% 0.00% 0.00% 0.00% 0.00% 0.00% 0.00% 200.00% 0.00% 0.00% Area: 48 2009 YTD 2 $40,979 $40,980 $27 75% 50% 2 18 0 150 9.4 2010 YTD 3 $108,000 $95,000 $34 96% 67% 9 17 3 74 10.2 Difference 1 $67,021 $54,020 $7 0.21 0.17 7 -1 3 -76 0.8 % Difference 50.00% 163.55% 131.82% 25.93% 28.00% 34.00% 350.00% -5.56% 0.00% -50.67% 8.51% Area: 50 2009 YTD 1 $114,000 $114,000 $77 99% 0% 0 0 0 45 2010 YTD 1 $43,000 $43,000 $35 86% 0% 1 0 1 184 Difference 0 -$71,000 -$71,000 -$42 -0.13 0 1 0 1 139 0 % Difference 0.00% -62.28% -62.28% -54.55% -13.13% 0% 0.00% 0.00% 0.00% 308.89% 0.00% Area: 51 2009 YTD 5 $64,080 $64,900 $39 97% 80% 8 10 6 71 2.7 2010 YTD 3 $28,373 $30,000 $21 80% 100% 12 18 7 80 7.3 Difference -2 -$35,707 -$34,900 $14 -0.17 0.2 4 8 1 9 4.6 % Difference -40.00% -55.72% -53.78% 0.00% -17.53% 25.00% 50.00% 80.00% 16.67% 12.68% 170.37% Real Estate Data ©2010 Real Estate Center at Texas A and M University and HAR. Data computations ©2010 Prudential Gary Greene, Realtors.
  • 7. Sales Sold Average Median Price to List Coop New Active Pending Months Year Month Sales Price Price per Sqft Price Sales Listings Listings Sales DOM Inventory Area: 52 - Liberty County 2009 YTD 39 $94,354 $75,000 $52 94% 49% 87 181 52 132 6.1 2010 YTD 41 $85,736 $67,750 $50 95% 51% 94 222 31 89 9.5 Difference 2 -$8,618 -$7,250 -$2 0.01 0.02 7 41 -21 -43 3.4 % Difference 5.13% -9.13% -9.67% -3.85% 1.06% 4.08% 8.05% 22.65% -40.38% -32.58% 55.74% Area: 53 - Chambers County 2009 YTD 33 $161,482 $127,500 $76 98% 64% 60 125 24 121 6.3 2010 YTD 25 $180,458 $173,000 $78 97% 84% 77 145 24 76 6.9 Difference -8 $18,976 $45,500 $2 -0.01 0.2 17 20 0 -45 0.6 % Difference -24.24% 11.75% 35.69% 2.63% -1.02% 31.25% 28.33% 16.00% 0.00% -37.19% 9.52% Area: 54 2009 YTD 6 $123,204 $133,910 $97 85% 50% 25 92 3 178 23.2 2010 YTD 7 $102,039 $85,000 $80 91% 57% 25 128 6 95 38.7 Difference 1 -$21,165 -$48,910 -$17 0.06 0.07 0 36 3 -83 15.5 % Difference 16.67% -17.18% -36.52% -17.53% 7.06% 14.00% 0.00% 39.13% 100.00% -46.63% 66.81% Area: 55 - Wharton County 2009 YTD 18 $104,217 $93,750 $66 94% 44% 43 111 8 116 10.6 2010 YTD 20 $114,625 $93,500 $61 92% 55% 44 117 11 93 10.8 Difference 2 $10,408 -$250 -$5 -0.02 0.11 1 6 3 -23 0.2 % Difference 11.11% 9.99% -0.27% -7.58% -2.13% 25.00% 2.33% 5.41% 37.50% -19.83% 1.89% Area: 56 2009 YTD 6 $122,563 $119,000 $62 89% 50% 19 53 3 95 19.1 2010 YTD 6 $111,450 $116,000 $68 92% 67% 16 44 7 116 13.5 Difference 0 -$11,113 -$3,000 $6 0.03 0.17 -3 -9 4 21 -5.6 % Difference 0.00% -9.07% -2.52% 9.68% 3.37% 34.00% -15.79% -16.98% 133.33% 22.11% -29.32% Area: 57 - Austin County 2009 YTD 24 $102,231 $83,000 $66 92% 63% 63 150 21 79 10.7 2010 YTD 14 $144,162 $138,500 $80 92% 43% 49 175 13 250 15.5 Difference -10 $41,931 $55,500 $14 0 -0.2 -14 25 -8 171 4.8 % Difference -41.67% 41.02% 66.87% 21.21% 0.00% -31.75% -22.22% 16.67% -38.10% 216.46% 44.86% Area: 58 2009 YTD 13 $186,223 $150,500 $83 95% 38% 30 51 11 84 8.8 2010 YTD 8 $147,219 $133,380 $86 96% 88% 18 43 4 110 8.4 Difference -5 -39004 -17120 3 0.01 0.5 -12 -8 -7 26 -0.4 % Difference -38.46% -20.94% -11.38% 3.61% 1.05% 131.58% -40.00% -15.69% -63.64% 30.95% -4.55% Real Estate Data ©2010 Real Estate Center at Texas A and M University and HAR. Data computations ©2010 Prudential Gary Greene, Realtors.
  • 8. Sales Sold Average Median Price to List Coop New Active Pending Months Year Month Sales Price Price per Sqft Price Sales Listings Listings Sales DOM Inventory Area: 60 2009 YTD 12 $59,552 $44,000 $40 89% 42% 38 60 8 137 10.4 2010 YTD 10 $107,590 $70,000 $65 88% 20% 18 47 12 106 8.0 Difference -2 $48,038 $26,000 $25 -0.01 -0.22 -20 -13 4 -31 -2.4 % Difference -16.67% 80.67% 59.09% 62.50% -1.12% -52.38% -52.63% -21.67% 50.00% -22.63% -23.08% Area: 61 2009 YTD 6 $154,046 $71,890 $75 94% 100% 13 14 11 81 2.9 2010 YTD 8 $158,300 $172,450 $86 99% 88% 26 29 9 32 5.0 Difference 2 $4,254 $100,560 $11 0.05 -0.12 13 15 -2 -49 2.1 % Difference 33.33% 2.76% 139.88% 14.67% 5.32% -12.00% 100.00% 107.14% -18.18% -60.49% 72.41% Area: 62 2009 YTD 1 $29,400 $29,400 $27 92% 0% 5 30 11 13 2010 YTD 5 $103,400 $82,000 $52 95% 40% 11 27 9 227 11.5 Difference 4 $74,000 $52,600 $25 0.03 0.4 6 -3 9 216 -1.4 % Difference 400.00% 251.70% 178.91% 92.59% 3.26% 0.00% 120.00% -10.00% 0.00% 1963.64% -10.85% Area: 63 2009 YTD 2 $139,450 $139,450 $63 92% 0% 1 19 2 248 20.7 2010 YTD 4 $55,625 $63,750 $35 89% 25% 21 40 1 79 31.0 Difference 2 -$83,825 -$75,700 -$28 -0.03 0.25 20 21 -1 -169 10.3 % Difference 100.00% -60.11% -54.28% -44.44% -3.26% 25.00% 2000.00% 110.53% 0.00% -68.15% 49.76% Area: 64 - San Jacinto County 2009 YTD 23 $98,509 $67,500 $65 89% 30% 57 139 16 116 9.0 2010 YTD 23 $120,524 $72,120 $83 92% 43% 62 179 10 108 13.1 Difference 0 $22,015 $4,620 $18 0.03 0.13 5 40 -6 -8 4.1 % Difference 0.00% 22.35% 6.84% 27.69% 3.37% 43.33% 8.77% 28.78% -37.50% -6.90% 45.56% Area: 66 2010 YTD 2 $182,500 $182,500 $60 92% 50% 7 23 156 37 % Difference 0.00% 0.00% 0.00% 0.00% 0.00% 0.00% 0.00% 0.00% 0.00% 0.00% 0.00% Real Estate Data ©2010 Real Estate Center at Texas A and M University and HAR. Data computations ©2010 Prudential Gary Greene, Realtors.
  • 9. Area: 69 2010 YTD 1 $220,000 $220,000 $120 88% 0% 3 21 55 36.0 % Difference 0.00% 0.00% 0.00% 0.00% 0.00% 0.00% 0.00% 0.00% 0.00% 0.00% 0.00% Area: 77 2009 YTD 1 $132,500 $132,500 $65 100% 0% 2 14 1 12 8.0 2010 YTD 3 $80,667 $103,000 $56 97% 33% 9 12 3 224 7.8 Difference 2 -$51,833 -$29,500 -$9 -0.03 0.33 7 -2 2 212 -0.2 % Difference 200.00% -39.12% -22.26% -13.85% -3.00% 0.00% 350.00% -14.29% 200.00% 1766.67% -2.50% Real Estate Data ©2010 Real Estate Center at Texas A and M University and HAR. Data computations ©2010 Prudential Gary Greene, Realtors.