1. 1 INTRODUCTION
According to Zhang (2002) the grounding rate for
Ro-Ro and merchant navy ship types with lengths
over 100 m, is 0.02 per ship year. That means that
every second ship is expected to experience
grounding in her life, assuming that the life of a
ship is 25 years. The data refer to the years 1990
to1999 represent a sample of 1800 ship-years.
Among the incidents, only one resulted in total
loss, whereas all the other were recovered.
Using the reports of accidents occurred from
1993 to 2002, which refer to ships with Greek
flag over 100GT, we obtained that during those
10 years 194 groundings were reported. The inci-
dents occurred to Greek ships all over the world.
Taking into account the total Greek fleet over
100GT these years, we have concluded that the
grounding rate per year vary from 3.56·10-3
to
1.6·10-2
, whereby the average value is 0.01 per
year ship. This value corresponds to a return pe-
riod, which is twice as high as the return period
obtained by the figures disclosed in Zhang
(2002). It should be noted that the sample of the
Greek fleet cover also ships that can be much
shorter than 100 m, which is the lower limit of
the ship size used in Zhang (2002). Among the
194 cases, two resulted in total loss. Three cases
reported pollution, in one case a death was re-
ported and in seventeen cases there was flooding
of compartments. In the study that refers to Greek
fleet, grounding incidents include all contacts
with submerged stationary obstacles, and could
have been caused by any reason, even intention-
ally grounding, when the captain wished to avoid
more serious consequences.
Following a number of grounding incidents
which caused serious consequences, there has
been a major concern, to adopt appropriate meas-
ures in order to reduce the probability of ground-
ing occurrence on one hand and to better under-
stand the mechanics of the incident, so that it will
be possible to design and build ships that have an
acceptable behaviour in case they ground, on the
other. Wang et al (2000) have investigated the
behaviour of a double hull in a variety of ground-
ing scenarios. A comprehensive survey of meth-
odologies for the assessment of ships that ground
is presented in ISSC (2006).
Studies on the behaviour of bottom structures during grounding
M.S. Samuelides
National Technical University of Athens, Zografos, Greece
J. Amdahl
Norwegian University of Science and Technology, Trondheim, Norway
R. Dow
University of Newcastle, Newcastle, UK
ABSTRACT: During that last twenty years there have been numerous procedures for the simulation of
ship groundings. These are usually based on simplified assumptions that concern the loading of the ship
bottom structure and the structural response modes. More recently the increase in the computing power
have made possible the simulation of grounding using FE codes, which do not need an a priori assump-
tion for the failure mode of the structural elements. However, other elements of the analysis, such as the
description of the sea-bed and the modelling of the material are still under investigation and there have
not yet been established guidelines for their inclusion in a grounding analysis. The paper presents an in-
vestigation of the loading patterns that are applied to the bottom structure during grounding, reviews
and discusses analytical and numerical methods for grounding analysis, and compares the results of six
methods when applied to simulate the grounding of a VLCC that occurred in 1975.
Advancements om Marine Structures - 1st International Conference on Marine Structures- Glasgow, 12-14 March 2007
2. Rules for building vessels do not explicitly re-
fer to grounding loads. Mitigation of the conse-
quences of such accidents is usually achieved
through defining a certain distance between inner
and outer bottom, defining appropriate arrange-
ment of cargo and fuel tanks and limiting their
size IACS (2006).
The paper investigates the loading patterns
that are applied to the bottom structure of a ship
that grounds and the subsequent structural re-
sponse/failure mechanisms. Existing methods to
simulate the structural behaviour during ground-
ing are reviewed and the results obtained from
their application are compared.
2 LOADING PATTERNS DURING
GROUNDING
In order to be able to simulate the response of the
bottom structure of a vessel, when it contacts the
sea bed it is essential to represent in a realistic
manner the loading patterns that the bottom is
subjected to. The section summarizes relevant
observations from five grounding incidents, that
have been reported in the literature and draws
conclusions that are related to the loading of the
bottom structure:
VLCC-January 1975: (Kuroiwa 1996, Pedersen
et al 2000, Simonsen 1997b, Tikka 2000, Wang et
al 1997, Zhang 2002)
On 6 January 1975 a one year old, single skin oil
tanker having a length of 304 m and 273,000 dwt,
rode over the Buffalo Reef off the coast of Singa-
pore at a speed of 11.5 to 12 knots. The bottom of
the ship was torn about from the bow for ap-
proximately 180 m along the centerline. The
width of the opening varied between 2 and 5 m
and the depth of the penetration has been reported
to be 2 to 3 m. However, it is possible that the
maximum penetration that was observed and that
was 5 m, could have been caused after the initial
grounding, when the ships sat for 10 days on the
reef. The structures on the outer sides of the rup-
ture were heavily concavely deformed toward the
interior of the tanks. The width of the transverse
frame deformation was reported to be approxi-
mately 7 m to 8 m.
El Paso Paul Kayser-1979:Poudret et al (1981)
The ship was a 130000m3
and 98000 t membrane
LNG carrier, which grounded in July 1979 on a
rock near Gibraltar. Prior to grounding the speed
of the vessels was estimated to be 18 knots, and
the kinetic energy 4200 MJ. The grounding did
not cause any leak of cargo and when the ship
was inspected it was found that the length of
damaged plates extended on a length of about 185
m port and 67 m starboard. Despite the fact that
the ship was at the time of he incident at full
speed, there has been to penetration of the cargo
holds, not even of the double bottom. Figure 1,
which has been reproduced from www (Juckett,
2002), shows the damage in the outer shell of the
bottom structure.
Tanker Sea Empress-February1996
http://www.archive.official-documents.co.uk/ do-
cument/dot/seaemp/semp.htm
SEA EMPRESS, a single bottom tanker loaded
with a cargo of 131000 t, grounded off the coast
of south west Wales in February 1996. Although
the main engine was stopped, put astern and both
anchors dropped the vessel continued to run
ahead and came to rest aground, approximately 5
cables northeast of the initial grounding position.
The grounding caused rupture of the starboard
side cargo and ballast tanks and a 2,500 t of crude
oil was released to the sea. The vessel was guided
into deeper water, but the ship grounded once
more and for the next four days efforts by the sal-
vors to regain control of the casualty were unsuc-
cessful and the casualty went aground again on a
number of occasions. It was not until seven days
later that the casualty was successfully refloated
and brought under control, and during that period,
i.e. from the initial grounding until the vessels
was refloated, the hull was subject to pounding
damage. Figure 2 from the above mentioned site
shows the damage of the bottom.
Navy vessel VALVIDIA-May 1997
http://www.shipstructure.org
VALVIDIA ran aground after an engine failure
of Northern Chile, on May 1997. Subsequently
the ship broached with the heading almost paral-
lel to the beach because of breaking waves. Most
of the bottom of the hull suffered some structural
damage, but the presence of diesel and heavy surf
limited diver accessibility for inspection. The
consistent pounding of breaking waves caused
3. severe hull damage to 30 tanks. The hull girder
experienced longitudinal buckling along the keel
and the seaward sideshell. This buckling mode
was caused by the load condition of having the
hull supported by the beach on the port side,
while the sea continuously impacted the starboard
side.
Figure 1: El Paso Paul Kayser Figure2: Sea Empress
Bulk Carrier NEW CARISSA-February 1989
http://www.shipstructure.org
NEW CARISSA was a 195 m double bottom
bulk carrier that was built in 1989. On February
4, 1999, the ship, carrying approximately 400,000
gallons (1500 tons) of fuel, grounded approxi-
mately 270 m off a beach north of Coos Bay,
Oregon. Within a few hours, the vessel was fully
broached to the incoming seas. For the three con-
secutive days the vessel experienced high winds
with gusts up to 70 knots and sea swells meas-
ured from 5 m to 8.5 m. Further, the vessel was in
the surf zone and it was subject to breaking
waves, which were much higher than the meas-
ured sea swells. Four days after the initial
grounding incident, the vessel began to leak oil
and a salvage team onboard the vessel discovered
that fuel tanks and ballast tanks below the two
consecutive cargo holds, located forward of the
engine room, were breached to the sea. Six days
after the ship grounded the engine room flooded
due to a major breach that was later determined to
be from a fracture located on the lower portion of
the forward engine room bulkhead and a 4.6 to
6.1 meters vertical fracture that appeared on the
starboard side shell plating, at the adjacent cargo
hold. The day after, subsequent to an attempt to
burn the oil, which caused explosions, the vessel
broke in half.
Conclusion
From the description of the above mentioned
grounding incidents, we may draw the following
conclusions regarding the loading of the bottom
structure:
a) the bottom structure is subjected to a number
of loading patterns, which depend, on the to-
pology and type of sea bed and the impact
geometry;
b) the loading due to grounding, is not limited in
time only in the initial phase of a grounding
incident, i.e. when the kinetic energy of the
ship prior to grounding is dissipated in struc-
tural energy, but may damage the ship’s struc-
ture days after the incident;
c) structural components that are damaged dur-
ing the initial incident, may subsequently be
subject to serious loading conditions, which
may cause further damage.
A common loading pattern when a ship runs
with forward speed on the sea bed is a contact
force distribution, which is oblique with respect
to the plane of the bottom shell. The figures of
the damaged hulls of Sea Empress and El Paso
Paul Kayser reveal that the shell of the vessels
were subject to such type of loading while they
were moving forward in contact with rocks. In
the case of Sea Empress (Fig. 2) the side shell has
been removed from the action of the rock, while
in the case of El Paso Paul Kayser (Fig. 1) it ap-
pears that the side shell was pushed inside the
double bottom space.
The bottom structure may also be subject to
transverse loading, when the ship moves verti-
cally towards the sea bed, a mode that may occur
statically or dynamically: such a transverse load
is static when the ship sits on a pinnacle, which
supports its weight, and dynamic in case the ship
is relatively light and the wave action causes a
repeated impact of the bottom to the sea bed
(pounding impact). The VLCC that was previ-
4. ously discussed seems to have suffered from
transverse static load on the double bottom struc-
ture, while New Carissa suffered from pounding
impact. Transverse loading on the bottom plate
also occur when the ship moves towards to the
sea bed as a result of tidal actions. When the load
to the bottom is transverse and the ship does not
move horizontally, the bottom structure – girders
and floors –suffer from crushing.
Loading on structural elements of the hull of a
ship that rests on the sea bed may also result from
hull bending either in the horizontal plane or in
the longitudinal plane of symmetry of the vessel.
The latter is the result of wave action on the hull,
but it may also occur when the ship rests on a
projection of the sea bed. In the case of New
Carissa, for example, scouring action developed a
pinnacle under the vessel’s amidships, which
caused hogging stresses to the ship’s hull. Hori-
zontal bending, such as the bending of Valvidia,
results from the wave action on a side of a vessel,
which is supported by the sea bed on her opposite
side. In this case each wave impact caused bend-
ing that created compressive stresses on the side
that is subjected to impact and tension on the op-
posite side. The side subjected to impact may suf-
fer from buckling.
3 ANALYTICAL PROCEDURES FOR
GROUNDING INVESTIGATIONS
The mode that has drawn much attention among
researchers that have addressed the structural be-
haviour of ships that ground, is the resistance of
the bottom plate to tearing by a wedge. Relatively
simple formulae have been developed to simulate
this mode of response by Wierzbicki et al (1993),
Paik (1994), Ochtsubo at al (1995), Wang et al
(1997) and Zhang (2002). Among those, the for-
mulation of Paik (1994) is empirical, i.e. it is
based on test results, whereas the other three have
been derived on the basis of assumed modes of
deformation. All four formulae propose that the
resistance of the plate to tearing is proportional to
the flow stress of the material. Further the cutting
force is proportional to the 1.5 or 1.6 power of the
area-equivalent thickness of the plating, and the
0. 4 to 0.5 power of the cutting length, i.e. the
length of the penetration of the cutting object to
the plating. The formula of Wierzbicki (1993) in-
volves a parameter involving the Crack Opening
Displacement (COD) and that of Zhang (2002)
the failure strain of the material. The other two do
not involve implicitly any material property rele-
vant to failure. The tearing resistance according
to the methods presented in the paragraph, de-
pends on the depth of penetration of the tearing
object within the plate and therefore they do not
predict a constant tearing force, which would de-
velop in a steady sate solution. According to
Wang et al (1997) the steady-state force could be
predicted if the cutting length is substituted by
the length of the tearing object. All four formulae
are presented in Table 1. Zhang (2002) has com-
pared results obtained by the application of the
formulae and concluded that when the wedge an-
gle is small, i.e. less than 40 the comparison is
good.
TABLE 1: TEARING RESISTANCE OF PLATES CUT BY A WEDGE
Wierzbicki et al (1993) 0.21.6 0.4 0.4
tR FF 3.28 t l= ⋅σ ⋅ ⋅μ ⋅δ ⋅
Paik (1994) ( )2 1.5 0.5
R FF 1.5 3.76 1.156 1.112 t l= ⋅ ⋅θ − ⋅θ + ⋅σ ⋅ ⋅
Wang et al (1999) 1.5 0.5
R FF 1.51 t l sin 1
tan
μ⎛ ⎞
= ⋅σ ⋅ ⋅ ⋅ θ ⋅ +⎜ ⎟
θ⎝ ⎠
Zhang (2002) 0.251.5 0.5
R F RF 1.942 t l tan 1
tan
μ⎛ ⎞
= ⋅σ ⋅ ⋅ ⋅ε ⋅ θ ⋅ +⎜ ⎟
θ⎝ ⎠
σF: flow stress, which is taken as the average of the yield and ultimate stress, t: equivalent thickness, i.e.
area of cross section of plate with longitudinals, divided by the width, θ: half angle of wedge shaped tearing
object, which is taken as when the tearing object is conical, μ: friction coefficient assumed to be 0.3 to 0.4,
l: tearing length (for the calculation of the steady state cutting force it is taken equal or twice the length of
the tearing object), εR: uniaxial rupture strain.
tδ , dimensionless crack opening displacement parameter, which is the ratio of Crack Opening Displace-
ment (COD) over plate thickness and assumed to be equal to 1.
5. Further modes of response of structural compo-
nents during grounding have been investigated by
Simonsen (1997a), Wang et al (1997) and Midtun
(2006). Simonsen (1997a) has developed an analyti-
cal methodology for the calculation of the resistance
of plate elements under transverse loading, and the
resistance of longitudinal elements under in plane
loading. Wang et al (1997) included in the ground-
ing resistance of a bottom structure, the resistance of
transverse members and the resistance of the bottom
plating to concertina tearing. Midtun (2006) studied
the response of a longitudinal bottom girder, when it
is struck by the oblique surface of a rigid object
moving along the longitudinal direction of the
girder. The model of Midtun is discussed in follow-
ing sections.
4 NUMERICAL SIMULATIONS OF
GROUNDING RESPONSE
Numerical simulations of grounding response are
performed by employing FE codes (see for example
Kuroiwa (1996) and Zhang at al (2006). Paik (2007)
has also suggested a simplified code for the simula-
tion of such incidents. However, despite the increase
in the computing power, which simplifies the FE
simulations of large scale problems, there are still
problems that need to be resolved in order to obtain
credible results. The problem that is currently widely
discussed is that of the failure criterion of the mate-
rial. The simplest way to account for material failure
is to define a limit to the Mises strain as this is cal-
culated from the FE codes. However, such a thresh-
hold value (usually referred to as “rupture strain”),
which is usually defined on the basis of uniaxial ten-
sion tests have shortcomings: a) there is no evidence
that the threshold value of the Mises strain is the ul-
timate strain measured during uniaxial tensile tests,
b) the Mises strains developed within an element, in
a region where the spatial variation of strain is
strong, depend highly on the element size, and c) the
application of the Mises law disregards the effect
that is caused by hydrostatic pressure, i.e. the first
invariant of the stress tensor. To overcome some of
the problems Germanischer Lloyd proposed a for-
mula to relate the rupture strain to the element size.
In particular, the rupture strain εR is given by the
formula: ( )R 0.056 0.54 t lε = + ⋅ for shell elements and
( )R 0.079 0.76 t lε = + ⋅ for beam elements, whereby l,
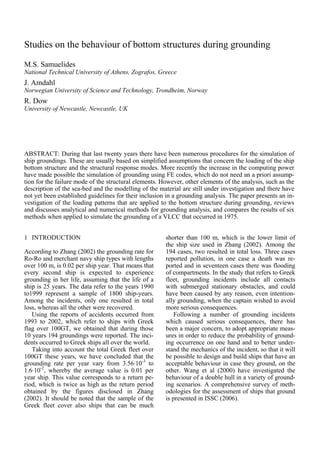
t is the length and thickness of the element. Paik (in
press) proposed to define the rupture strain from the
formula: ( )
0.58
R UR 4.1 t lε ε = ⋅ , where URε is the
nominal fracture strain obtained by tensile coupon
tests. If the latter is assumed to be 10%, then Figure
3 below shows a comparison between the values of
the rupture strains, obtained by the formulae of GL
and Paik for element size between 20 and 50 mm,
which is usual for grounding applications.
Figure 3: Maximum allowable strain
A rupture criterion that takes into account the tri-
axiality of the stress field has been proposed by
Johnson and Cook (1985). The authors propose that
the ultimate plastic strain of the material is a func-
tion of the ratio of the first invariant of the stress
tensor, i.e. the hydrostatic pressure, over the Mises
stress, and give the material constants that are
needed for the application of the criterion for a high
tensile steel. However it was not possible to find in
the literature the parameters that are needed to im-
plement the criterion for mild steel. Servis &
Samuelides (2006) have used the T-failure criterion
that correlates the reversible elastic energy density
storage with material failure. This criterion was de-
veloped at the National Technical University of Ath-
ens and is currently used to predict the initiation of
pre-existent macroscopic cracks, as well as in the
calculation of forming limit diagrams (FLDs) for
metal forming processes. The T criterion is based on
two threshhold values of the density of the elastic
strain energy stored during the loading process: an
upper limit of the elastic energy density due to
change in shape, the distortional energy, and an up-
per limit of the elastic energy density due to volume
change, the dilatational energy. The distortional en-
ergy represents the energy stored in the material
only in the case of pure shear and is the area under
the Mises stress-strain (σ-ε) curve. The dilatational
energy represents the energy stored in the material
as a result of the hydrostatic loading, and it is the
area under the p-Θ curve, where p is the hydrostatic
pressure (first invariant of stress tensor), and Θ is the
volume change. The volume of material is consid-
ered to have failed by extensive plastic flow when
either the distortional energy or the dilatational en-
ergy reaches a critical value. The two critical values
are material constants, independent of the shape of
the volume of material and the induced loading, but
depend on the strain rate and temperature. The defi-
nition of a threshhold value for the dilatational en-
ergy accounts for the effect of hydrostatic pressure
in the material failure, a feature which is not taken
into account by the von-Mises yield law. The au-
10%
15%
20%
25%
30%
35%
40%
45%
50%
55%
60%
20 25 30 35 40 45 50 55 60
LENGHT OF ELEMENT mm
RUPTURESTRAIN
t=12.5 mm Paik
t=12.5 mm GL
t=15 mm Paik
t=15 mm GL
t=17.5 mm Paik
t=17.5 mm GL
t=20 mm Paik
t=20 mm GL
6. thors have proposed a procedure to estimate the
critical values of the energy on the basis of torsion
and uniaxial tensile tests and incorporated the failure
criterion in FE code Abaqus/explicit to simulate the
quasi-static tests reported in Paik et al (1999) (Fig.
4). The results in terms of force versus penetration is
presented in Figure 5.
Figure 4: FE model of double side structure
Figure 5: Experimental and theoretical results according to
Paik et al (1999) and Servis et al (2006).
5 RESISTANCE OF LONGITUDINAL GIRDERS
Apart fr0m the shell plating longitudinal girders are
key structural components in ship bottoms as con-
cerns the resistance to grounding actions. The struc-
tural behaviour of longitudinal girders during
grounding is quite poorly understood, and the de-
formation pattern and associated energy dissipation
of girders were therefore subjected to a comprehen-
sive study by Midtun (2006).
Initial simulations were carried out with the FE
code LS_DYNA, where the girder is assumed to be de-
formed to a certain depth as the indenter represent-
ing the sea floor obstacle travels along the girder.
The process is illustrated in Figure 6.
The girder is assumed to be continuous and long.
The height of the girder web is hw = 0.45 m and 0.9
m, the length is 8 m, the thickness varies with t = 8 –
16 mm.
Figure 6: Deformation of girder subjected to travelling obstruc-
tion (hw = 0.45 m, t = 12 mm).
The girder is un-stiffened and transverse girders
are not included, initially. It is fixed in inner bottom
(lower end in figure). A small part of the outer shell
plating shell (“top flange”) is modelled. It is fixed
with respect to motion in the transverse direction,
but free to move in the axial and lateral direction.
(The outer shell is removed in most plots for visuali-
zation purposes). The indenter representing the sea
floor is modelled as a plane object oriented at a cer-
tain angle of attack, φ, to the shell plating. The in-
denter is forced to move along the girder with a con-
stant indentation depth, Δ. Friction is disregarded in
the simulations. The material is assumed to be linear
elastic and a (relatively) small linear hardening.
Figure 7 shows the deformation pattern for three
different indentation depths. The apparent fold
length increases with increasing indentation, but this
is at least partly due to incomplete folding for small
indentation depth, as observed from the cross-
sectional view for Δ = 80 mm. Figure 8 shows the
effect of varying the angle of attack for a constant
indentation Δ = 160 mm. It is observed that when
the angle increases the fold wave length is reduced,
in both the axial direction and the vertical direction.
The height of the girder web being deformed is also
reduced.
Δ = 80 mm 160 mm 450 mm 80 mm 450 mm
Figure 7: Deformation pattern and cross-sectional view for dif-
ferent indentations (hw = 0.9 m, t = 12 mm, φ = 280
).
7. φ = 150
φ = 280
φ = 410
φ = 610
φ = 610
φ = 150
Figure 8: Deformation pattern for different angles of attack (hw
= 0.9 m, t = 12 mm, Δ = 160 mm).
Figure 9: Longitudinal girder with floors and shell plating.
Figure 10: Deformed girders for Δ = 450 mm and φ = 51.30
.
In order to study the effect represented by trans-
verse members, two intersecting floors were mod-
eled. A larger part of the shell plating was also in-
cluded in the model, illustrated in Figure 9. The
distance between the floors is 4.2 m, the height is 0.9
m and the web thickness is 12 mm. Figure 10 shows
an example of the deformation pattern for indenta-
tion Δ = 450 mm and attack angle φ = 51.30
. The
shape of the indenter dictates very much the defor-
mation pattern, which does not extend significantly
outside the part in direct contact with the indenter.
The same folding pattern as for the simple girder is
observed. The folds seem to displace to the same
side at before and after the intersection.
Although the pattern does not change when the
floors are present, an important difference is noticed:
The length of the fold increases. Figure 11 shows
the deformation pattern in the longitudinal girder,
for the bottom structure and the single girder. The
attack angle and the indentation are not exactly iden-
tical (Δ = 150 mm, φ = 51.30
(bottom structure) Δ =
160 mm, φ = 53,10
(single girder)), but the differ-
ence cannot be explained by this small difference.
Most likely the fold length increase is due to the
confinement effect of the outer shell. The outer shell
tends to displace in the axial direction along with the
motion of the indenter. In the case of the single
girder, the plating is free in the axial direction and
does resist this motion very little. In the bottom
structure, the axial motion is resisted by the adjacent
shell plating, which causes large shear/tension
strains to develop. The effect of this restraint is the
same as reducing the angle of attack in case of the
single girder (whereby the axial motion diminishes).
Midtun (2006), further investigated the effect of in-
cluding stiffeners on the floors and girders. Figure
12 shows the deformation pattern with vertically
stiffened floors. The conclusion is that the stiffeners
play a moderate role. Vertical stiffeners influence
the deformation pattern significantly more when the
floor/girder intersection is subjected to “axial” (ver-
tical) crushing. When the girder is deformed by a
moving indenter, the longitudinal deformation of the
plating described above produces a significant out of
plane deformation of the intersection. Consequently
the deformation mode for a stiffened and un-
stiffened floor becomes quite similar.
Figure 11: Deformation pattern in longitudinal girder as part of
bottom structure (left), single girder (middle). Deformation in
shell plating (right) viewed from below.
Longitudinal girders are typically fitted with
horizontal stiffeners. Simulations show that their
constraint and, hence, contribution to the resistance
is limited.
Outer shell
Indenter Floor
Floor
8. Figure 12: Deformation pattern with vertically stiffened floors.
Example of force deformation curves for the bot-
tom model with no stiffeners on longitudinal gird-
ers, and with indentation Δ = 450 mm are shown
in Figure 13. The horizontal component increases
with large attack angles, such that the resultant
force is normal to the contact plane. In the simula-
tion only the horizontal force component contrib-
utes to the work. The passage of a frame by the
indenter is expressed by a significant increase of
the force level; between transverse frames it is
fairly constant. The shape of the curve indicates
that mechanism type of analysis of the average
force during deformation of longitudinal girders
and crushing of intersecting floors is possible.
Figure 13: Force deformation curves for bottom structure with
φ = 24.40
/51.30
and Δ = 450 mm.
Midtun analysed the resistance to penetration of
the girder web also by constructing folding mecha-
nism. For illustration purposes use of paper models
is beneficial (Fig. 14). Initially, it is assumed that the
web yields by vertical deformation and the rectangu-
lar section in the web deforms into a parallelogram.
Once the deformation field is determined, the av-
erage resistance for complete folding of one wave
can be calculated by means of the virtual work prin-
ciple, taking into account the contributions from
continuous deformation fields and bending about
stationary yield lines. The mechanism shown in Fig-
ure 14 is compatible with a shear and axial compres-
sion field imposed on the rectangles. The length and
width of the rectangle are unknown. If this can be
determined by analytical minimization, the problem
is easily solved. Unfortunately, for the problem it is
not feasible. This indicates that the mechanism is not
entirely correct. Later, Midtun concluded that the ax-
ial displacement observed in the numerical simula-
tion should be included in the model. Nevertheless,
using empirical values for the unknown parameters,
the prediction of energy levels were not out of range.
Generally the force level is unpredicted.
As to the energy dissipation on the floors Midtun
concluded that in the central section subjected to
uniform compression the resistance could adequately
be predicted by means of formulas for axial crushing
of cruciform sections. Outside central region, the
Midtun used the method proposed by Simonsen
(1997a). Compared to the single girder case, better
agreement between numerical and analytic predic-
tions is obtained for the longitudinal girder.
Figure 14: Paper model of folding mechanism.
6 INVESTIGATION OF GROUNDING
INCIDENTS
The section presents the comparison of the results,
which were obtained by the application of FE and
analytical methods to simulate the grounding of the
VLCC on the Buffalo Reef, and have been reported
in the literature. The first analysis of the incident
was reported by Kuroiwa (1996). The author per-
formed a finite element analysis that took into ac-
count both the structural response of the bottom
structure and the vertical motion of the vessels dur-
ing the grounding. The longitudinal reaction force
Resultant force
Horizontal force
Vertical force
Resultant force
Horizontal force
Vertical force
9. was found at the initial stages of the grounding to
have a peak of 60 MN. After the rupture of the colli-
sion bulkhead the resisting force varied between 16
MN and 35 MN, whereby the maxima occurred
when the transverse frames provided maximum re-
sistance. The computations showed a large vertical
force which reached 80 MN and lifted the ship up-
wards during the incident. As a result of the lift the
tip of the rock moved towards the bottom plate as
the ship moved forward on the rock: thus, the pene-
tration of the rock in the hull decreased to 2.25 m
from 3 m, which was estimated when the hull came
in contact with rock. According to the authors the
damage length predicted by the analysis was 12 m
longer than the actual damage length.
Simonsen (1997b) applied a procedure presented
in Simonsen (1997a) in order to investigate the same
accident. The author obtained the damage length as a
function of the rock penetration, and he concluded
that the observed damage length of 180 m corre-
sponded to a rock penetration of 4.4 m, at the aft end
of the damage. However the penetration that was ob-
served 10 days after the incident was 5 m, which
corresponds to a damage length of 150 m. The au-
thor claims that the penetration, which occurred dur-
ing grounding should be less than 5 m and that the
penetration increased during the 10 days, when the
ship remained on the rock, as a result of transverse
loading exerted by the rock to the bottom structure.
A further investigation of the accident has been
reported by Tikka (2000). The investigation used the
computer code DAMAGE that is based on the the-
ory developed by Simonsen (1997a). The application
of the program predicted a damage length of 177 m.
This results compares extremely well with the ob-
served damage of 180 m, but it shows sensitivity to
the eccentricity of the rock at the time of the inci-
dent, a parameter which, according to the author is
not known. The estimated vertical and horizontal
forces for 15 sec from the first contact varied almost
linearly from 33 MN to 50 MN.
The grounding was also analyzed by three simpli-
fied methods developed by Wang et al (1997),
Pedersen et al (2000) and Zhang (2002).
The methodology of Wang et al (1997) is based
on the calculation of the energy that is absorbed by
tearing of bottom plates (see previous section Table
1) as the rock moves in the longitudinal direction,
the energy absorbed by the transverses as they de-
form out of plane and the energy absorbed by the
area of the bottom plate which is adjacent to the fi-
nal position of the rock and which heavily deformed
out of plane. Depending on the mode of tearing of
the bottom shell –tearing or concertina tearing- and
the assumed width of the rupture, the authors calcu-
lated that the energy absorbed in the damaged bot-
tom structure was 83% to 115% of the kinetic en-
ergy of the ship prior to grounding. For the
estimation of the kinetic energy the speed of the ship
was taken equal to 11.5 knots and the added mass
coefficient 5%. The authors do not give the mass of
the vessel prior to impact which according to
(Kuroiwa 1996) is 273000 t. On the basis of the
above data and results, we may calculate the mean
force that resists the damage, by dividing the energy
absorbed according to the calculation, by the dam-
age length i.e. 180 m. From the calculations we ob-
tain that the resisting force is between 23 MN and 32
MN depending on the tearing mode and the width of
rupture that have been assumed.
Pedersen et al (2000) proposed the following for-
mula relating the energy absorbed by the structure Es
with the volume of the damaged material RT
where Fσ is the flow stress of the material, t is the
equivalent plate thickness and b the critical tearing
length, where the steady state has been reached,
which is taken as the width of the tearing object or
damage width. By dividing the above energy by the
damage length, we obtain the mean resisting force
Fs, which is equal to:
If we apply this formula, using the data that were
reported in Wang (b=5 m, t=56.5, σ0=320MPa) we
obtain that the mean resisting force equals to 20MN.
If the damage width is taken equal to 7 m, as it ap-
pears to be at certain locations, the resisting force
equals to 23 MN.
Finally Zhang (2002) proposed a formula for the
calculation of the mean resisting force FR during
damage, which relates the resisting force to the flow
stress, the equivalent thickness of the bottom plate
including longitudinals t, the equivalent thickness of
the bottom plating including longitudinal and trans-
verses te and the damage width b:
The author applied the formula and calculated
that the resisting force equals to 28.2 MN.
Discussion
From the description of the actual grounding given
in the various publications it is concluded that at the
time of grounding the ship had a displacement of
273000 t and a speed of 11.5 to 12 knots. Thus the
kinetic energy of the ship prior to impact was 4777
MJ to 5202 MJ if we ignore the added mass and
5016 MJ to 5462 MJ if the added mass is taken
equal to 5%. The corresponding mean resisting
force, which is the energy divided by the damage
length, i.e. 180 m, varies from 26,5 MN to 28,9 MN
if the added mass is neglected and from 27.9 MN to
30.3 MN if the added mass is 5%.
0.6
S F T
t
E 3.21 R
b
⎛ ⎞
= ⋅ ⋅σ ⋅⎜ ⎟
⎝ ⎠
0.6
R F
t
F 3.21 t b
b
⎛ ⎞
= ⋅ ⋅σ ⋅ ⋅⎜ ⎟
⎝ ⎠
0.6 0.4
R F eF 3.58 t t b= ⋅σ ⋅ ⋅ ⋅
10. If we compare the forces that have been obtained
from the simulations with the average resisting force
according to the preceding paragraph, the closest es-
timation is obtained by the formula of Zhang (2002).
The numerical simulation of Kuroiwa (1996) yields
also a non-steady force (from 16 MN to 35 MN) that
fluctuates around the value of the average force as
obtained by the test results. The procedure of Si-
monsen as applied in (Simonsen 1997b) or (Tikka
2000) gives a damage length that compares well
with that measured after the grounding.
7 CONCLUSIONS
Grounding is a complicated phenomenon that in-
volves a number of energy absorbing mechanisms.
Further the structural response of the hull depends
on the relative position of the ship to the obstacle or
obstacles that come in contact with the hull, their
shape and rigidity. The damage due to grounding is
not limited during the initial phase of the incident
but continues while the ship rests on the sea bed.
During the last couple of decades, various meth-
ods for grounding have been developed and tested
versus experimental results of results obtained from
grounding incidents. FE methods have been also
employed for a more comprehensive simulation of
the phenomenon. However the results of the simula-
tion of an actual grounding, still depends on assump-
tions, which are not always justified.
In order to establish a comprehensive procedure
for grounding analysis, there is a need to understand
the loading patterns, to which the bottom structure is
subject, and the subsequent failure mechanisms.
Relevant useful conclusions may be drawn from in-
specting damaged hulls from ships that have experi-
enced grounding. Thereafter it would be possible to
reproduce the failure modes using FE codes. A ma-
jor breakthrough would be achieved when it will be
possible to define a realistic failure criterion for the
material. Taking into account the various failure
mechanisms it might be possible to define a failure
criterion for each failure mode.
ACKNOWLEDGEMENTS
The work has been performed in the scope of the project
MARSTRUCT, Network of Excellence on Marine Structures,
(www.mar.ist.utl/marstruct/), which has been financed by the
EU through the GROWTH Programme under contract TNE3-
CT-2003-506141. Part of the contribution of the first author,
has been performed during a visit to the Dep. of Naval Archi-
tecture and Ocean Engineering of Pusan National University,
which was supported by the Korea Research Foundation and
The Korean Federation of Science and Technology Societies.
REFERENCES
Germanischer Lloyd. Development of explanatory notes for
harmonized solas chapter ii-1, International Maritime
Organization (IMO).
IACS 2006. Common Structural Rules for Oil Tankers, Section
5/3.1.3
ISSC 2006. Report of Technical Committee V.1: Collision and
Grounding. Proceeding of the 16th
International Ship and
Offshore Structures Congress, University of
Southamtpon.
Johnson G.R. & Cook, W.H. 1985. Fracture Characteristics of
Three Metals Subjected to Various Strains, Strain-Rates
Temperatures and Pressures. Engineering Fracture Me-
chanics 21(1):31-48.
Juckett, D. 2002. Properties of LNG. US Department of En-
ergy.
Kuroiwa, T. 1996. Numerical Simulation of Actual Collision
and Grounding Experiments. In proceeding of confer-
ence on Design and Methodologies for Collision and
Grounding Protection of Ships, SNAME:
Midtun, H.O. 2006. Analysis of tankers during grounding and
collision. Master Thesis, Norwegian University of Sci-
ence and Technology.
Ohtsubo H. & Wang G. 1995. An upper-bound solution to the
problem of plate tearing. J Mar Sci Technol 1:46–51.
Paik J.K. (1994). Cutting of a longitudinally stiffened plate by
a wedge. J Ship Res 38(4):340–348.
Paik, J.K. in press. Practical Techniques for Finite Element
Modeling to Simulate Structural Crashworhtiness in
Ship Collisions and Grounding – Part I Theory. Ships
and Offshore Structures.
Paik J.K., Chung J.Y., Choe I.H., Thayamballi A.K., Pedersen
P.T. & Wang G. 1999. On rational design of double hull
tanker structures against collision. In The Society of Na-
val Architects and Marine Engineers, 1999 annual meet-
ing, Paper Number, 14.
Paik, J.K. and Seo, J.K. 2007. A Method for Progressive Struc-
tural Crashworthiness Analysis under Collisions and
Grounding. International Conference on Advancements
in Marine Structures, 12-14 March, Glasgow, UK.
Pedersen, T. & Zhang, S. 2000. Absorbed Energy is Ship Col-
lisions and Grounding – Revising Minorsky’s Empirical
Method. Journal of Ship Research 44(2):140-154.
Poudret, J., Huther, M., Jean, P. & Vauhan, H. 1981. Ground-
ing of a Membrane Tanker; Correlation Between Dam-
age Predictions and Observations. Extreme Loads Re-
sponse Symposium, Arlington, VA.
Servis, D. & Samuelides M. 2006. Implementation of the T-
failure criterion in finite element methodologies. Com-
puters & Structures 84:196-214.
Simonsen B.C. 1997a. Ship Grounding on Rock I. Validation
and Application, Marine Structures 10:563-584.
Simonsen B.C. 1997b. Ship Grounding on Rock II. Validation
and Application. Marine Structures 10:563-584.
Tikka, K.K. 2000. Risk-based Life Cycle Management of Ship
Structures. Ship Structures Committee Report SSC-417.
Wang, G., Arita, K. & Liu, D. 2000. Behaviour of double hull
in a variety of stranding or collision scenarios. Marine
Structures 13(3):147-187.
Wang G., Ohtsubo, H, & Liu, D. 1997. A Simple Method for
Predicting the Grounding Strength of Ships. J Ship Res
41(3):241-247.
Wierzbicki T. & Thomas P. 1993. Closed-form solution for
wedge cutting force through thin metal sheets. Int J
Mech Sci 35:209-229.
Zhang, A. & Suzuki, K. 2006. Dynamic FE simulations of the
effect of selected parameters on grounding test results of
bottom structures. Ship and Offshore Structures 1:117-
125.
Zhang, S. 2002. Plate tearing and bottom damage in ship
grounding. Marine Structures 15:101-117.