
Recommended
More Related Content
What's hot
What's hot (20)
Viewers also liked
Similar to Reed report final final draft for regional
Similar to Reed report final final draft for regional (20)
Recently uploaded
Recently uploaded (20)
Reed report final final draft for regional
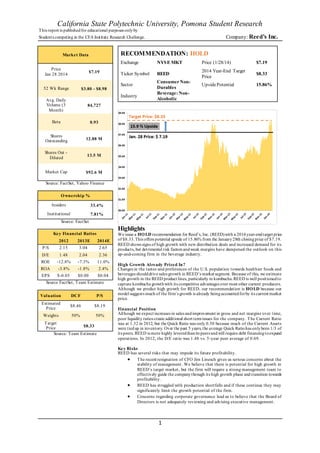
- 1. California State Polytechnic University, Pomona Student Research This report is publishedfor educational purposes onlyby Students competing in the CFA Institute Research Challenge. Company: Reed’s Inc. 1 Source: FactSet, Yahoo Finance Source: FactSet Key Financial Ratios 2012 2013E 2014E P/S 2.15 3.04 2.65 D/E 1.48 2.04 2.36 ROE -12.8% -7.3% 11.0% ROA -3.8% -1.8% 2.4% EPS $-0.05 $0.00 $0.04 Source FactSet, Team Estimate Valuation DCF P/S Estimated Price $8.46 $8.19 Weights 50% 50% Target Price $8.33 Source: Team Estimate Market Data Price Jan 28 2014 $7.19 52 Wk Range $3.80 - $8.98 Avg. Daily Volume (3 Month) 84,727 Beta 0.93 Shares Outstanding 12.88 M Shares Out - Diluted 13.5 M Market Cap $92.6 M Ownership % Insiders 33.4% Institutional 7.81% RECOMMENDATION: HOLD Exchange NYSE MKT Price (1/28/14) $7.19 Ticker Symbol REED 2014 Year-End Target Price $8.33 Sector ConsumerNon- Durables UpsidePotential 15.86% Industry Beverage: Non- Alcoholic Highlights We issue a HOLD recommendation for Reed’s, Inc. (REED)with a 2014year-endtarget price of $8.33.This offers potential upside of 15.86% from the January28th closingprice of $7.19. REED shows signs of high growth with new distribution deals and increased demand for its products, but detrimental risk factors andweak margins have dampened the outlook on this up-and-coming firm in the beverage industry. High Growth Already Priced In? Changes in the tastes and preferences of the U.S. population towards healthier foods and beverages shoulddrive sales growth in REED’s market segment. Because of this, we estimate high growth in the REED product lines, particularly in kombucha.REED is well positionedto capture kombucha growthwith its competitive advantages over most other current producers. Although we predict high growth for REED, our recommendation is HOLD because our model suggests much of the firm’s growth is already beingaccountedforby its current market price. Financial Position Although we expect increases in sales andimprovement in gross and net margins over time, poor liquidity ratios create additional short termissues for the company. The Current Ratio was at 1.32 in 2012, but the Quick Ratio was only 0.50 because much of the Current Assets were tiedup in inventory. Over the past 5 years,the average Quick Ratiohas onlybeen 1/3 of its peers. REED is more highly leveredthanits peers andwill require debt financingtoexpand operations. In 2012, the D/E ratio was 1.48 vs. 5-year peer average of 0.69. Key Risks REED has several risks that may impede its future profitability. The recent resignation of CFO Jim Linesch gives us serious concerns about the stability of management. We believe that there is potential for high growth in REED’s target market, but the firm will require a strong management team to effectively guide the companythrough its high growth phase andtransition towards profitability. REED has struggled with production shortfalls and if these continue they may significantly limit the growth potential of the firm. Concerns regarding corporate governance lead us to believe that the Board of Directors is not adequately reviewing and advising executive management.
- 2. CFA Institute Research Challenge 31 January 2014 2 Figure 1: REED Revenue Breakdown Source: REED Financial Statements Figure 2: REED Product Growth Projected Annual Growth Rates for REED Products Core Brand Sodas 15%-20% Kombucha 50-100% Private Labels 35-40% Source: Company Guidance Figure 3: U.S. Beverage Market Volume Source: Marketline Business Description Reed’s, Inc. (REED) is an Americanbeverage companythat develops, produces, andsells top sellingbeverages in the natural premium beverage category.They offer24 types ofall natural non-alcoholic soft drinks andseven product lines that include Reed’s Ginger Brews, Virgil’s Root Beer andCream Sodas, Dr. Better andReal Cola, CultureClubKombucha, China Colas, Reed’s Ginger Chews, Reed’s Ginger Ice Creams and Sonoma Sparkler Sparkling Juices. REED also operates a growing private label business. REED products are soldin more than14,000gourmet andnatural foodstores, grocery stores, supermarket chains andspecialtystores throughout the UnitedStates, andto a lesser degree, in Canada andEurope. Distributionchannels for REED are national natural foods distributors andan increasingnumber ofregional mainstream direct store delivery (DSD) distribut ors. Its customer base is servedby about 10,500 natural andmainstream supermarkets. New product developments such as kombucha, expansion in distribution channels, andtrade and consumer promotions are expected to fuel future sales growth. Core Natural Premium Sodas REED has been #1 in sales for natural soda since 1992. Their Ginger Brews and Virgil’s Sodas currently makeup 80% of sales, while Culture ClubKombucha andprivate labels each account for10%.Thecompany’s non-alcoholic ginger sodas are brewed using fresh ginger, spices andfruits in a unique brewing process that sets REED apart fromother commercial soft drink brands. Each 12 ounce bottle contains between8 and26 grams of fresh ginger. They use pure cane sugar as a sweetener, andcolor thedrinks naturallyfrom herbs, fruits, spices, roots andjuices. REED does not use injection based carbonation or preservatives in their ginger beverages. Companyguidance estimates its core soda brands will grow at 15-20% in 2014. Kombucha REED enteredthe kombucha market in fall 2012with its Culture ClubKombucha line. Their existing national distribution and experience in natural beverages has given REED a competitiveadvantage in this segment.The Culture ClubKombucha line was introduced into 800 newretailers throughout the U.S. andinto select Whole Foods Markets in 2012. InCulture Club Kombucha’s first year, 200,000cases were sold, penetrating50%of natural food stores. Although REED is currently #2in kombuchasales nationally, GT’s Synergy Drinks controls most of the kombucha market share.As of 2013, REED accounts for only$5 millionin sales in this $300millioncategory. The companyplans on capturingmore market share in this segment with its flavorinnovations, signature branding, andnewdistribution deals. Company guidance suggests a growth rate of 50-100% for its kombucha products in 2014. Private Label Products REED startedproducing private label products in 2009. REED has seen increases in sales within this segment withsales of $200,000in 2009growingto$5.2millionin 2012. Theynow have 10 private label customers as opposed tofour in 2012. Outlook for REED’s private label segment looks optimistic as revenues in the first half of2013increased by 50% compared to 2012. Companyguidance suggests a growth rate of 35-40% for its private label products in 2014. CurrentStrategies: Stimulate consumer demand and awareness for existing brands and products through promotions and advertising – REED will continue to aggressively promote andadvertise its Culture Club Kombucha and core brands through non- traditional and alternative channels to attain high sales growth. Increase direct sales relationships and expand market – Products are distributed through natural and specialty food stores, mainstream markets and warehouse clubs. In August 2013, REED announced a distribution agreement with Kroger Supermarkets,oneof the largest grocerychains, to carryfour flavors of kombucha in nearly 1000 locations. REED continues to expand its sales channels with recentlyreachedagreements with Haggen Food& Pharmacy and Ingles Markets, Inc., to distribute kombucha throughout Washington, Oregon, and the Southeast United States. Expand their national distribution networks by adding regional direct store delivery (DSD) accounts – Recent expansions ofREED DSD networkhas resulted in a 50% increase in sales fromthis channel in 2012. REED has continued to add DSD accounts in NorthAmerica; its most recent agreement was reached in early 2014 with ManhattanBeer Distributors to distribute eight Culture Club Kombucha flavors in metropolitan New York. 79% 10% 10% 1% REED' S INC. P RODUCT LINES -2 0 1 3 REED Core Brands CultureClub Kombucha Private Labels Other -4.0% -3.0% -2.0% -1.0% 0.0% 1.0% 2.0% 28,000.0 28,500.0 29,000.0 29,500.0 30,000.0 30,500.0 2007 2008 2009 2010 2011 2012 %CHANGE GALLONS(INMILLIONS) YEAR U.S. Liquid Refreshment Beverage Market: Volume and growth Gallons (in mi llions) % change
- 3. CFA Institute Research Challenge 31 January 2014 3 Figure 4: U.S. CSD Consumption Source: Beverage Marketing Corp. Figure 5: Volume Change by Segment Source: Beverage Marketing Corp. Figure 6: 2011 PackagedBeverage Sales Source: Nielsen Industry Overview & Competitive Positioning Beverage Industry - Carbonated Soft Drinks (CSD) on the Decline Coca-Cola (KO),PepsiCo (PEP), andDr. Pepper Snapple Group (DPS) represent 87% of the CSD market. These leading producers have invested heavily in advertising to drive brand loyalty andhave purchasedseveral minor market players. The beverage industryis considered a consumer staple, and historically the demand for products has been relatively inelastic. Although the beverage industry grew by 1% to 29.8 billion gallons sold in 2012, the carbonated beverages segment declined by 1.8% during the same period. According to BevNET magazine, CSD’s are expectedto fall below50% of the market for volume in 2017 and50% of the market in revenue in 2018. This can be attributed to natural and healthier alternatives that have steadily gainedmarket penetration in recent years. According to the Beverage Marketing Corporation, the alternative beverage category of the market was estimatedtobe approximately$34.4 billionin 2012, an 8.3%increase from2011. Alternative beverages include energy drinks,bottledwater, juices, sports drinks, ready-to-drink teas and coffee teas. Additionally, beverages containing probiotics are gaining recognition due to perceived health benefits. Increases in public awareness of sugar induced issues such as obesity anddiabetes is expected to drive down carbonated beverage consumption further. Functional Beverage Resilience While the carbonated beverage sector is starting to decline, the functional sector is experiencinghigh growth.According to IBISWorld, over the next five years the beverage industry will see many state andlocal governments attempt tolimit the sales of CSD’s due to growinghealth concerns. Health conscious consumers have been willing to spend on higher pricedhealthy options due to endorsements from medical experts on the importanceof proper nutrition.Eventhough thereis a decliningtrendin sales for CSD consumption, the functional beverage markets may hold an insulated position. Strong Growth Opportunities in Kombucha Kombucha signals the arrival of a new generation of functional beverages, utilizing ingredients with active constituents-carbs, caffeine,antioxidants, alcohol, various natural acids and beneficial yeasts and bacteria. Kombucha is the fastest growing segment in the $609 million functional juice and beverage category. Of that segment, REED ranks second in Kombucha with its current $5 million in sales in a $300 million category. Kombucha is gainingshelf spaces in healthy food stores and natural gourmet food stores. According to BevNET, Kombucha sales are expectedto reach $500 million by 2015. High sales growth is beginning to attract the attention of the large players in the beverage industry. Overview ofCompetitors Dr. PepperSnapple Group, Inc. (DPS) is the third largest soda business in the U.S. and Canada. IBISWorld reports that DPS accounts for a 14.8% market share in beverages. Accordingto Nielsen’s 2012retails sales, theymake up 39.8% market share in flavoredCSDs. The companycontinues tobuildandenhance theirleadingbrands while developing premium value teas andjuices. Currently, theyholdthetop ginger ale beverage andtheirSnapple brand leads in ready-to-drink tea. Monster Beverage Corporation has $1.9billion sales in energy drinks, $110.2 millionin non-carbonatedbeverages, and$31million in carbonatedbeverages. Their direct store delivery segment generates 95% of 2012revenues, up from90% in 2008. Theyalso have an agreement with Coca-Colatodistributetheir products in 70countries. Monster will continue to add new flavors and improve their products that compete in the functional beverage category. TheirHansen’s BrandSodas have been the leadingnatural soda brand on the West Coast for over 30 years and currently have 6.9% market share in the functional drinks category. Like REED, Hansen’s sodas are sweetened with cane sugar, contains no preservatives, caffeine or artificial flavorings. They also offer organic natural sodas under their Blue Sky Products Brands. PepsiCo, Inc. is the #2 carbonated soft drink maker with a 41.7% market share in the functional drinks categoryand30.3% market share as the largest non-alcoholic drink producer. They have plans toexpandin healthy and premium priced products as well as products for aging consumer demographics. Pepsi operates in the natural soda segment through its subsidiaries, SOBE andIZZE. SoBe started producing functional drinks in 1997, releasing products that containedexoticherbs, vitamins andminerals. IZZE was acquired in 2006 and its products mix carbonatedspringwater with 100% fruit juices. These beverages are primarily sold in the US, Canada, Caribbean and the South Pacific. The Coca-ColaCompany is the #1nonalcoholic beverage company, as well as one of the world's most recognizable brands. Coca Cola owns 16“billion dollarbrands”, includingfour of the topfive soft drinks: Coca-Cola, Diet Coke, Fanta, andSprite. Other topbrands include Minute Maid, PowerAde, andVitaminwater. Withthe world's largest beverage distribution system, the Coca-ColaCompanyreaches more than 200 countries. Coca-Cola operates in the natural beverage market through its subsidiary Odwalla. Odwalla, Inc. offers natural juices, juice drinks, fruit smoothies,garden organics, protein drinks, soy-baseddrinks, nutritionbars, smoothie refreshers, andsuperfoods. 0 10 20 30 40 50 Gallons Years U.S. Per CapitaConsumption of CSDs -10.0% -5.0% 0.0% 5.0% 10.0% 15.0% 20.0% %changefrom2011-2012 Segments U.S. Liquid Refreshment Beverage Market: Change in volume by segment Energydrinks Ready-to-drink coffee Bottled water Ready-to-drink tea Sports drinks Value-added water Carbonated soft drinks Fruit beverages 43.9% 14.5% 13.3% 10.8% 9.5% 5.9% 2.1% % D O L L A R S A L E S P A C K A G E D B E V E R A G E S ( 2 0 1 1 ) Carbonated drinks Alternatives (energydrinks, etc.) Bottled water Juice drinks Sports drinks Iced tea (ready-to-drink) Other
- 4. CFA Institute Research Challenge 31 January 2014 4 Figure 7: U.S. Functional Beverage Forecast Source: Marketline Figure 8: U.SFunctional Market Share Source: Marketline Figure 9: Team Criteria Recommendation Criteria Price Range Jan. 28, 2014 Price $7.19 20% Upside Price Above $8.63 BUY 10% Downside to 20% Upside Price $6.47- $8.63 HOLD 10% Downside Price Below $6.47 SELL Source: Team Estimates Figure 10: 2014E Target Price Source: Team Estimates Valuation DCF P/S Estimated Price $8.46 $8.19 Weights 50% 50% Target Price $8.33 Jones Soda Co. markets andsells brightly coloredsodas with wacky names andflavors. The soda maker’s beverages are soldin the US(75% ofsales) andCanada where theyare distributedthrough a network ofmore than 185independent distributors. Outside the USthey have distributors in the UK, IrelandandAustralia.Sales have gone down 57% since 2007to $17.4 million in2011. Thecompanyhas not recordeda profit in the last five years. GT’s SynergyDrinks is the industryleader of Kombucha drinks. In 2009,Americans bought more thana millionbottles of GT’s Kombucha.Establishedin 1995, theyhave distribution channels all across 50states.In 2008, their Kombuchadrinks realized$66.1 millionin sales. Investment Summary Conflicting Signals We issue a HOLD recommendation for Reeds, Inc.with a 2014year-endtarget price of $8.33. This offers potential upside of 15.86% from January28thclosingprice of$7.19. REED shows signs of high growth with its newdistribution deals andincreaseddemandfor its products, but high levels of risk and weak margins weigh the firm down. Between January 2012 and December 2013, we sawREED take huge strides as it closeddeal after deal with distribution companies throughout the USandCanada alongwith entering the kombucha market. With these newly addedopportunities for growth,REED stockprice soaredby 611.71% during this time period. We believe that much ofREED’s expected growth is already priced in and that there is not much room for additional gain. Valuation methods Our target price was estimated by assigning both our DCF valuation and relative valuation models a 50/50 weighting. We realize that for relative valuation, price to sales is limited to only looking into a company’s revenues. However, we accounted for this by applying a discount for REED poor net margin,amongother factors. Forthis reason, we could not find a reason to apply more weighting to one valuation method over the other. Strong Outlook for Product Line With consumers becoming increasingly cognizant of their well-being, demand for more healthyfoods andbeverages has gone up. REED beingthe topseller of premium natural sodas has positioneditselfwell to capitalize onthis growth. On topofthat, REEDexplores another growingmarket in functional beverages with his Culture ClubKombuchaline. Since adding it in 2012, REED has alreadyseen moderatesuccess with its growthexpectedtoexceed 50% in 2014. Financial Position Weak gross, operating, and net margins compared to the beverage industry average have resultedin negative earnings since REED went public in 2006. While we expect margins to improve,we do not currentlysee a mechanism to allow REED to operate at gross margins similar to its large competitors. REED has relativelyhigh levels ofdebt andmust take on more debt to expand. We expect it tobe several years before REEDgenerates enough cash flow to pay down debt and move towards a long term sustainable capital structure. Our model suggests that the average D/E ratiofor next 10years tobe 2.30. This is more than three times the peer group average 5-year D/E ratio of 0.69. Investment Risks REED is a high growth companythat currentlydoes not have any earnings, andtherefore has many serious risks tofuture profitability. Given the high growth niche segment that REED operates in, it is difficult to estimate several key growth factors that drive the stock price. REED also has several operational andstrategic risks, such as recent productionshortages and a sudden change in executive management that maydeter the firm’s future growth. These risks are further discussed in the Investment Risks section. Acquisition Premium While we viewREED as a likely candidate for acquisition and that an acquisition premium may cause the price of REED to meet our BUY criteria, we do not believe that just the possibility of a future acquisition is enough to change our investment recommendation. Criteria We assign a BUY ratingto a stockthat exhibits a 20% orgreaterpotential upside. WhileBUY ratings may typicallybe issuedto a stock with15% upside, we believe that small cap stocks are inherentlymore volatile and therefore require a higher return before issuing a buy. We assign a HOLD recommendation to a stock with less than 20% potential upside to a 10% potential downside. We assign a sell rating to a stock with potential downside greater than 10%.
- 5. CFA Institute Research Challenge 31 January 2014 5 Figure 11: Sales Growth Forecast Source: FactSet, Team Estimate Figure 12: Gross Margin Forecast Source; FactSet, Team Estimate Figure 13: FinancingTerms REED Financing Rate Line of Credit Prime + 3.75% Term Loan Prime + 11.6% Term Loan shall not be below 14.85% Source: REED Financial Statements Valuation In order to arrive at a year-end 2014 target price for REED we used two valuation models; DiscountedCash Flows through a Free Cash Flow to Equity Model and Relative Valuation using Price/Sales Multiples. Free Cash Flow to Equity Model We evaluatedREED usinga 3-stage Discounted Cash Flow Analysis. A Free Cash Flow to Equity (FCFE) model was chosen because we expect REEDtohave a period of high growth andtransitionfrom beingan unprofitable company toa profitable one. FCFE is a useful model for high growth companies as longas the capital structure does not drastically change over the forecastedperiod. Company guidance has suggestedthat the capital structure ofREED should remain similar tocurrent conditions for the near future, although new expansion would be financedby debt. We estimatedfree cash flows by forecastingthe determinants of net income, CAPEX, andworkingcapital. Determinants ofNet Income include revenue growth, margin improvement, andexpectedinterest payments based upon our estimated debt levels. Given these estimates we forecast the year-endtarget price for REED at $8.46 per share. Given a January 28, 2014closingprice of $7.19, this price would imply 18% potential upside (See Appendix 5). Sales Forecast Sales revenues were forecastedusinga 3-stage growth model. In the first stage, REED sales growth was estimated at 25% for the next 5 years. 25% growth was derived from a combinationof the FactSet futureyearestimatedgrowthrates andREED historic growth. We believe this number to be reasonable given the growth rate of natural products within the beverage industry andREED’s strongcompetitive advantages in the natural foods segment. This growth is supportedby our expectedgrowthforthe kombucha product over the next 10 years andREED’s positionin this market. Foryears 2019-2022 our model assumes that the growth rate will decline by 5% each year. As REED revenues grow, the growth rate will naturally declineas market sharein the natural foods segment matures. For years 2023and on we used 3% as an average long-termgrowthrate toreflect historical long-term real growth in the US economy. Depreciation We assume that REED will continue to depreciate its assets similar to its rates in 2012 and 2011. In these years, depreciation was 22% and 19% of fixed assets, respectively. In our forecasted period depreciation ranges from 18-19% of fixed assets. Gross Margin Historically, REED gross margin has been much lower than its competitors. With the large beverage companies likeCoca-Cola,Pepsi, Dr. Pepper Snapple and Monster each having a gross margin of over 50%, it makes REED historical gross margin average of 23.2% look small in comparison.Due to REED’s size andpremiumnature ofits products, we do not see it beingrealistic for REED to reach margins of this level. However, REED has been able to improve that figure to32% in its most recent earnings report due to increasing production efficiency anddecreasingtransportationcosts. We expect to see gross margin steadily increase to 38% by 2023 driven by expected sales growth on REED branded products. Selling, General & Administrative (SG&A) Expense Growth Currently, SG&A expenses have heldconstant at 30% ofsales duringthe years endingin 2011 and2012. SG&A expenses hadincreasedto 31.5% ofsales through thefirst three quarters of 2013, but much ofthis increase is relatedtoadditional trade showandadvertisingexpenditure due to a newproduct rollout.Companyguidance has suggestedthat advertisingwill remain at similar levels for the near future, unless an extraordinaryopportunity arises. Large companies in the industry,such as Coca-ColaandPepsi typicallyhave SG&A to sales ratios of 36-38%. This cost canbe attributedto thehigherlevel ofadvertising that mainstream manufacturers engage in. Monster, a comparable companyin the energy drink submarket, operates at 25% SG&A to sales. We believe holdingSG&A to sales at 30% is a reasonable estimate forREED. Interest Expenses REED currentlypays 7% on its $4.5 million dollar short term revolving line of credit and 14.85% onits longterm debt. Both of these rates are floating. We assume additional debt financingwill be available at 14.85%. REED also has interest expenses resulting from its capital leases of propertyandequipment.REED uses a rate of 9.9% toaccount for its interest expense for its capital leases. Tax Advantage Due to previous losses, REED may be able to realize a carried loss of $5.3 million against projectedearnings in 2014-2016. Our model assumes that this will result in no taxes due in 2014-2016. Cost ofEquity Cost of Equity was estimatedat 7.65% by usingCAPM model. Forrisk free rate, US 10 year Treasury bondrate of3.04% from year end 2013 was used. Market risk premium of 4.96% was used from Damodaran’s 2014 market premium forecast. Beta of .93 was used from -10% 0% 10% 20% 30% 40% Sales Growth Actual Forecast 0.0% 10.0% 20.0% 30.0% 40.0% Gross Margin Actual Forecast
- 6. CFA Institute Research Challenge 31 January 2014 6 Figure 14: P/SREED vs. Peers Source: FactSet Figure 15: REED vs. PeerKey Numbers Reed vs. Peer Group 2008-2011 Reed Peers Net Margin -13% 14% Payout Ratio 0% 33.50% D/E 1.08 0.66 Beta 0.93 0.79 Source: FactSet Figure 16: Effects of CFO Resignation REED P/S discount after CFO announcement Price (1/27/2014) $6.82 # Shares (million) 13.5 Market Cap (1/27/2014) $92.07 2013E Sales (million) 37.75 Implied P/S 2.44 2013E Peers P/S multiple 3.24 Implied Discount 25% Source: FactSet, Team Estimates Figure 17: P/SDiscount P/S Discount Sensitivity Analysis Applied Discount 2014E Price Potential Upside 40% $6.55 -8.8% 35% $7.10 -1.2% 30% $7.65 6.3% 25% $8.19 13.9% 20% $8.74 21.5% 15% $9.28 29.1% 10% $9.83 36.7% Source: Team Estimates FactSet estimate. A regression analysis was attemptedtoestimate beta against the S&P 500 (^GSPC), but the results were not considered useful as our regression coefficient of determinationwas 1.1%. We considerDamodaranandFactSet to be reliable sources for these estimates. Dividend Policy Companyguidance suggests that REED will not payanydividendon common stock for the foreseeable future. Our model assumes that no dividend will be paid in forecasted period. Capital Expenditures (CAPEX) Duringthe one-on-one meetingthat we had with REED management, it was suggestedthat the companywill financenewexpansionby issuingdebt as opposedtodilutingshareholders. We believe that the forecastedfuture debt levels of REED are reasonable given its high growth, and as the company becomes profitable it will be able to pay down debt. Balance Sheet For our model we have assumedthat all assets andshort-termliabilities will remain a constant percentage of sales. Multiples Valuation This model seeks toarrive at a valuation by comparing how similar companies are priced in the market. Peer Group Selection It is imperative to select a set of similarfirms in order to obtaina more precise market -based valuation.However, REEDis a very unique company in whichit encompasses a small niche within the beverage industry.This makes it difficult to findcompanies that strongly resemble REED. Companies that we didfindto be similar to REED were either private, subsidiaries of larger companies, ortoo small for analyst coverage.We declinedto use these companies due to the difficultyin obtainingforwardprojections. For this reason,we chose its peergroup to be its biggest competitors within thebeverage industry. This list includes Coca-Cola,Dr. Pepper- Snapple, Pepsi, and Monster. What Multiples to Use? Due to REED beinga companythat has historicallyhadnegative earnings with a small book value, both its earnings multiples and book value multiples are unreliable. We felt it most appropriate to use the Price to Sales multiple given how the company resembles a start-up alongwith its historicalpoor earnings. Theadvantages of usingthis method include that it is much less volatile than earnings multiples and harder to manipulate through accounting methods. However,we are aware that this multiple has its limitations as it does not account for a company’s debt levels or cost structures and plan to account for these factors in our valuation. Price toSales Multiple Historically, REED has been tradingat a discount to its peers.Between the years of 2008 to 2011, the average P/S discount was 72.22%. There were several reasons for this: Significantly smallernet margin due to negative profits (-13.0% avg. vs. 14.0% avg.) Non-existent payout ratioas REED didnot payout dividends (0% avg. vs. 33.5% avg.) Higher total debt to equity ratio (1.08 avg. vs. 0.66 avg.) Greater amounts of systematic risk (0.93 vs. 0.79) From 2012onward, REED has been trading at a much smaller discount to its peers with an average discount of 15%. We believe that this is due to the following reasons: Improving net margins (from -25.0% in 2008 to -1.7% in 2012) Higher expectedgrowthdue to new distribution agreements, a new private label partnershipwith one of the largest supermarket chains in the country, and the addition of kombucha to its product line Although REED’s average D/E Ratio grew to 1.6 during this time period, we feel that the improvements in net margin andexpectedgrowthmore than made up forthis factor to justify a 15% discount. For our year endprojection,we forecast REED tosustain its high level ofgrowthdue to an increasingdemandforkombucha andnatural sodas. Also,we expect net margin to continue to improve as revenues grow. Basedoff thesefactors, we decidedto applya 15% discount to year end2014, similartothe average ofthe discounts in 2012and2013. However onJanuary 21, 2014, it was announcedthat REED CFO of 5 years, Jim Linesch, was leavingthe company. Given that the CFO hadjust bought over$200,000worth ofshares 19 days prior to this announcement, we can assume that this decision was very abrupt. This poses a red flagas there appears to be serious management problems within REED. Wefeel that this addedrisk warrants an additional 10% discount. This estimationof 10% was derivedfromusingthe followingcalculations: 0 0.5 1 1.5 2 2.5 3 3.5 2008 2009 2010 2011 2012 2013 2014E Price to Sales Reed's, Inc. Peers
- 7. CFA Institute Research Challenge 31 January 2014 7 Figure 18: Weighting Sensitivity Sensitivity of Weighting on Target Price DCF Weight Relative Weight Target Price 20% 80% $ 8.24 30% 70% $ 8.27 40% 60% $ 8.30 50% 50% $ 8.33 60% 40% $ 8.35 70% 30% $ 8.38 80% 20% $ 8.41 Source: Team Estimates Figure 19: Implications of Acquisition Acquisition Premium Premium Price Potential Upside 0% $8.33 15.86% 5% $8.75 21.65% 10% $9.16 27.44% 15% $9.58 33.23% 20% $10.00 39.03% 25% $10.41 44.82% 30% $10.83 50.61% Source: Team Estimates Figure 20: Net Income Forecast Source: FactSet, Team Estimates Taking REED market cap by end of January 27, 2014 Divide it by our 2013E sales forecast to get to an implied current P/S ratio for REED Foundthe discount ofthis P/Sin comparisontothe 2013E average peer group P/S ratio The resultingdiscount of REED was 25%, 10% more than its average discount toits peers for the past 2 years. Since there was a large price change afterthe announcement of resignation,we believe that the market was applyingthis addeddiscount basedupon similarconcerns about management. We also believe that continuingto use this 25% multiple discount for 2014is appropriate. This would give us a 2014 year-endtarget priceof $8.19. This implies potential upside of 13.9% relative toJanuary 28th, 2014close price of$7.19(See Appendix6). Weightof Models We obtained a final one year target price by taking a weighted average of our DCF and relative valuations. We utilizedequal weights for both our DCF and P/S model. We believe that both ofour models are rigorous andappropriatelyconsider the majorfactors in valuation of REED. We performeda sensitivity analysis to determine howthe weighting of our models would change our target priceanddiscoveredthat any changes in weighting would not result in a change of investment recommendation based upon our stated criteria. While it was difficult to finda strongcomparable group for REED, we feel we have correctly applied an appropriate discount relative our chosen group. Combiningour forecasts gives us a 2014year- endtarget priceof $8.33.Given a January28 price of$7.19 this represents 15.9% potential upside (See Appendix 7). Additional Upside - Acquisition Premium Historical acquisition premiums in the beverage industry have been known to range from 25%-30% above market price per share. In 2001, Odwalla, an American food product companythat sells fruit juice, was acquiredby The Coca-Cola Companyfor$18million. The companywas purchasedat a premiumof 28.9%. More recently Jim Beam was purchased for $16 billion by a Japanese company, Suntory Holdings Ltd. The company paid a 25% premium. Otheracquisitions in thebeverage industryinclude SoBe and Izze sparkling juices, all of which were acquiredunder the PepsiCo brand. Izze was purchasedat an estimated price of $75 millionandSoBe was acquiredaround$370 millionfor a 90 percent stake, about 12 times its EBITDA. With a market size of $92.6 million, REED’s relativelysmall size also makes thecompany a great acquisition target.Competitors such as theCoca-Cola CompanyandPepsiCohave the resources andability topurchase a small-capcompany. As ownership is concentratedamongst a few large shareholders, it is easier to gain majorityapproval andconsensus in voting decisions. REED has developeda strongbrandidentityin the functional beverage andkombucha segment. This canleadto highgrowthpotential in a fairlynewanddevelopingmarket. Industry leaders in the beverage market lookingto differentiate intofunctional drinks would value the acquisitionof REEDtotheir business. As a small-capcompany, REED mayalso not have the resources that manyofthe large competitors mayhave. Unlockingvalue in REED through expandeddistribution networks, marketing, andadditional capital couldalso provide grounds for the companytobe acquired. Possible synergies wouldgive large competitors incentive toacquire as well. Given this information, we believe REED is an attractive acquisitiontarget, andcould potentially have15-30% additional upside froman acquisitionpremium.However, there are also several risks that may impede anacquisitionorresult in a lower premium. These risks are further discussedin our Investment Risks section. Financial Analysis Future Earnings While REED has reportednegative net incomein the past, it has been consistently improving these figures over the last 6 years. Between 2007and2012, REEDwent fromnet income of - $5.58 million to -$0.57 million. We expect earnings to increase as revenues rise because REED closely resembles a start-up company in its high growth stage. Due to a higher demand of natural sodas andkombucha,we do not anticipate sales growth slowing down in the near future. This will boost net income with2014 expecting to be REED’s first year of positive earnings. Given our sales growth andmargin forecasts we estimate that REED will grow from a current net margin of 0% to 1.93% in 2018, with earnings of $2.27 million. Sales Growth REED sales growth has been consistently over15%for the time periods 2007to 2012, which is well above the industry average of 1% forbeverage companies. However, sales in 2009 had declineddue to the effects of theU.S. recession. Webelieve these growthtrends will continue at a high level because of favorable market trends forREED product lines, their position as a -10 -5 0 5 10 Net Income In Millions Actual Forecast
- 8. CFA Institute Research Challenge 31 January 2014 8 Figure 21: REED Gross Margin Forecast Gross Margin 2012 2013E Terminal REED 30% 31.5% 38% Peer Group 5-YearAvg. 56.09% Source: FactSet, Team Estimates Figure 22: REED Liquidity Ratios Source: FactSet market leaderin the natural sodas market, andtheir establishednational distribution network. This is reflectedin theforecastedgrowth rates for years 2013-2018. We expect that REED’s growth in sales can be heavily attributedtotheir position in thekombucha market segment, the fastest growing product in functional beverages. Improving Gross Margin We believe the relatively low gross margin is the most important factor limiting REED’s earningpower. In 2012 REED gross marginwas 30.47%, which was well below the average of large beverage manufacturers.However, gross margin has increasedfrom 15% in 2007 to 30% in 2012,andwe expect this trendto continue. REED uses promotional allowances as a direct reductionin sales. Due to newproduct rollouts, higher allowances have lowered gross margin. Therehas been a historyin kombucha production inefficiencies that hindered gross margin. Thirdquarter 2013 results show a gross margin of 32%, leading us to believe that these inefficiencies have been corrected. REEDhas investedheavilyin expanding production capacity in its west coast plant. Capital expenditures totaled$507,000in 2012 and $447,000 through the first nine months of2013. These enhancements should decrease transportation costs because they reduce shipments from the east coast co-packing facility. Increases in brandedproduct sales will improve gross margins in the forecastedperioddue to higher margins on brandedas opposedtoprivate label offerings. Their CultureClub Kombucha is expectedtohave the highest sales growth, andshouldimprove brandedsales. Beverage industry peers Coca-Cola, PepsiCo, Dr. Pepper Snapple andMonsterhave a gross margin of over50%.This maynot be realisticfor REED given its size andpremium nature of its products. Companyexecutives suggestedin the2013thirdquarterconference call that they would like to see gross margin beingcloser to40%. We haveforecasteda steadytrend towards an estimate of38% in the terminal stage of ourvaluationmodel. This estimate allows for realistic andattainable increases of0.5% per year from2014to 2023(See Appendix16). Efficiency Ratios REED has a 5-year average Total Asset Turnover Ratio of 1.79 compared to peer group average of 0.92. This implies REED is managingits assets efficiently compared to the large beverage manufacturers. REEDalso has a higher Receivables Turnover and lower Payables Turnover comparedtopeeraverage. This demonstrates REED collects its receivables quicker and it takes longer to pay its suppliers than its peers. Balance Sheet & Financing REED 3 year average Debt/Equity Ratiowas 0.46 priorto2009. D/E Ratio increased to 0.93 in 2009 andhas continuedtoincrease in thefollowingyears reachinga forecastedhigh of2.47 in 2015E.The highratio is due in part to thefact that REEDsoldandconcurrentlyenteredinto a long-termlease agreement ofits two buildings andbrewery equipment in 2009. The capital lease has the effect ofincreasingoperatingincome while also increasinginterest expense. The building andequipment were soldat $3,056,000but were recorded as a long-term financing obligation. At the endof 2013,we estimated the remaining balance of that obligation to be $2,784,000. The company is expectedtodecreasethat balanceat therate of 9.9% annuallyand this has been takenintoaccount in the balance sheet under long-termfinancing(see Appendix 11). As of thirdquarter2013, REEDhas longtermdebt consistingof a $525,000 termloanat 11.6% plus prime.Interest shall not be below14.85% perterms ofthe loan. REED has maintaineda Current Ratioover 1, withit being1.32 in year ending2012. The forecastedCurrent Ratioremains above1.32(See Appendix4). However, due to REED havingmore than 60% ofits Current Assets in inventories, its Quick Ratiois 0.5 in 2012, which we project toremain relatively constant through the forecastedperiod. DuPont Analysis DuPont analysis was employed to examine how the return on equity was affected by the company’s operatingefficiency, asset efficiency, and financial leverage. Due to operating losses from 2006to2012, thereturnon equity(ROE)has been negative. However we expect in subsequent years, therewill be gradual improvement. In 2007, the return on equity was - 76.67%, andby 2012, theROE was drastically reducedto -12.78%. Through examination of the company's operatingefficiency, profit margins have increased40.76%, from -42.51% in 2007 to-1.75% in 2012. The Total Asset Turnover has also increasedfrom1.29 to 2.17 over the periods of 2007 to 2012, showing improvement in the company’s utilization of its resources. However REEDcapital structureshows that its financial leverage is increasing as the equity multiplierrises from 1.39in 2007to3.37 in 2012. This implies an increase in debt to financethe company's operations over theyears. The projections for 2013 continue to show signs of optimismfor thefirm. By 2014, projectedprofit margins andROE are expected to be positive withprofit margins reaching1.05%andreturn onequity increasing to 11.02%. The DuPont analysis suggests that the profit margins are the most important driver for the firm’s return on equity. Thus we believe REED is showingpositive signs of growththat areexpected to continue into the future (See Appendix 15.) 0.00 0.50 1.00 1.50 2.00 2.50 3.00 Dec'06 Dec'07 Dec'08 Dec'09 Dec'10 Dec'11 Dec'12 Ratio Analysis Current Ratio Quick Ratio Cash Ratio
- 9. CFA Institute Research Challenge 31 January 2014 9 Figure 23: ForecastedRatios 2013 Forecasted Ratios Affecting Liquidity & Solvency REED 2013E 5 Year Peer Average Current Ratio 1.33 2.07 Quick Ratio 0.5 1.69 D/E Ratio 2.04 0.69 Source: FactSet, Team Estimates Figure 24: CFO Resignationon Stock Price Impact from Loss of Key Management Executive REED S&P 500 Jan. 21st Open price $8.32 $1,841 Jan. 27th Close price $6.82 $1,781 Percentage Change -18.03% -3.23% Source: FactSet Investment Risks Operational Risk: Production Shortfall REED may not be able to produce at a level to support high sales growth. REED had issues with productionshortages in 2012 andearly2013, andthis ledtoCEO Chris Reedtakingover plant management at the west coast facility. Continuedissues from production shortages due to equipment erroror inefficiencies in production process may harm sales growth and gross margin. Operational Risk: Increase in Supply Prices Costs in tangible goods soldwere 63% of sales in 2012and2011. Cost of tangible goods sold includes raw materials, packaging, co-packingandrepackingfees, inboundfreight charges and certain internal transfers.Increases in these costs could lower gross margin and impact the current andfutureprofitabilityof REED. However,we wouldexpect that such increases may happen across the industry andaffect REED competitors as well. Given its relatively small size, future supply price increases mayaffect REED morethanits competitors, resulting in a lower gross margin. Operational Risk: Lack of Working Capital REED Current Ratiohas trendeddownwards goingfrom 2.41in 2007to1.44and1.33 in 2011 and2012 respectively.TheirCurrent Ratioalso trails the 5-year peer group average, 1.33 to 2.07. REED Quick Ratiohas trendeddownwards overtime, goingfrom0.96 in 2007 to 0.43 and0.50 in 2011 and2012 respectively. TheirQuick Ratio also trails the 5-year peer group average, .50 to 1.69. These ratios signal it mayhave some challenges paying bills over time. REED currentlyhas a D/E Ratioof 2.04, comparedtopeergroup five yearaverage of .69,and companyguidance has suggested that new funding would come from new debt rather than equity financing. Lackof workingcapital maynegativelyaffect REED’s ability to borrow. If revenue fromproduct sales is inadequate, the firmmayalso have insufficient working capital to continue operations. Inthe longrun, poorliquidity can result in the firm managing business instead of growing it. REED is also susceptible to changes in interest rates because of the floatingrate onits current andlongterm debt. Given thehistorical lowinterest rates that have prevailed during the last few years, if interest rates go up, REED wouldhave toincur higherinterest expenses in order to service its debt. Operational Risk:Loss ofKey Management Executive On January 21, 2014, REED announced that its CFO of 5 years, James Linesch, would be leavingthe companyat the endof themonthandthat the firm was seeking a replacement. It was not publicly statedas to what the reason was for his leaving, but with him gone it does leave a hole within management. Lineschhas heldseveral CFO positions with small publicly tradedcompanies such as AdStar, Inc.(ADST), DynTek, Inc. (DYNE) and CompuMed, Inc. (CMPD). Whenhe was appointedas the chieffinancial officerforREED, hebrought with him valuable management experience in emergingpublic companies.Alongwith his normalduties of managingthecompany’s finances, Lineschwas responsible for improving REED’s line of credit andcuttinglegal costs by at least 50%. CEO Chris Reed had even stated that Linesch had contributed to the “inspiration and technical ‘macgyvering’ that gave us the Reed’s Culture Club Kombucha.” Since he was brought on board, REED has seen a rise in stockprice by almost 500%. When the announcement cameout that Linesch was steppingdown from his position REED’s stock plummeted. Withinthe spanof 5 tradingdays, the price haddropped18% vs. 3.0% decline in the S&P 500. The fact that Linesch hadbought over $200,000of REED stock 19 days prior to the announcement suggests that this decisionwas very abrupt. Also,the fact that REED does not have a replacement alreadyset in place further justifies our assumption.It comes into questionas to what hadcausedthe sudden departure as there was no explanation given as to why Linesch left.The uncertaintythat this event creates adds additional risktothe company. With REEDin a crucial periodof high growth, it is vital tofindan experienced replacement. Competition Risk: Major Competitors Enter Market If the natural beverage industrycontinues its growth, there will be a large incentive for the major beverage manufacturers Coca-Cola, Pepsi, Dr Pepper-Snapple, andMonstertoenterthe market.While we see REED as an ideal acquisition target fora larger firm, it is also possible for one of REED’s competitors tobe acquiredinstead. Major firms may also start to operate their own premium natural lines. This couldmaterially impact revenue and profitability, as they wouldbe competingagainst a powerful firm withmore established distributionchannels. Strategic Risk: New Product Failure REED’s fastest growingproduct is expectedtobe its Culture ClubKombucha line. Expected growth of this line is 50%-100%, comparedto15-20% for REEDcore brands (accordingto companyguidance). IfKombucha sales falter, overall sales growth may be dampened.
- 10. CFA Institute Research Challenge 31 January 2014 10 Valuation Risk: LongTermGrowth Rates REED intrinsic value was calculatedby usinga long-term growth rateof 3%,which was set to model typical long term U.S. Economic Growth. This growth factor can have significant impact onthe valuationof REED,bothin when theterminal value is calculatedandwith what long-term growth rate is used. A range of long term growth rates were modeled using sensitivityanalysis todetermine the effect on our one year target price (See Appendix 10). Valuation Risk: Intermediate TermGrowth REED intermediate-term sales growth rates (IGR) were estimated by utilizing analyst consensus, recent performance, andexpectedgrowthin market andmarket share. We utilized an annualizedgrowth rate of25% over the next five years, which we believe to be the best estimate given current production and market conditions. If these estimates are overly optimistic it wouldhave a huge impact on REED valuation, as REED requires high growth andgrowth in margins to become profitable. Given the difficulty in predicting the growth pattern ofa newniche product in kombucha, these growth numbers may be understated and therefore undervalue thecompany. A range of IGR were modeledusingsensitivityanalysis to determine the effects of different growth rates on our 2014 year-end target price (See Appendix 8). Valuation Risk: Changes in Cost ofCapital REED is a relativelyyoungcompany with high growth and a high D/E Ratio. Due t o these factors, REEDcurrentlyhas a high cost of capital comparedto thebeverage industry. Wehave assumedthat this number will not drasticallychange over time.If there are changes in capital structure, inherent business risk, market risk premium, or risk free rate, cost of capital will change, andtherefore our estimateof valuationmaychange substantially.Sensitivity analysis was performedto viewthe effects ofdifferent longterm cost ofcapital rates on the one year target price (See Appendix 9). Valuation Risk: Acquisition Risk While visitingREED headquarters, Chris Reeddiscussedan expectedexit strategy in the next 4 to 5 years, andhopedtoreceivean offer valuingthe company at $200million.Withthe 2013 year endmarket capbeing$102.22million, this is a 95.66% premium. The possibility that Chris Reed could turn away potentially good acquisition deals based on his unreasonable expectations could lead to a risk for investors. Also with Chris being the age of 56, the decision to sell the company couldbe greatly influencedby his desire to retire. As both Chris andhis wife are on the boardofdirectors, theyhave a verystronginfluence onwhat price the companycouldbe purchasedat. Due to Chris Reed’s possible personal motives, this could lead to a much smaller acquisition premium than shareholders would hope for. Issues RegardingCorporate Governance Insider stake ownershipat REEDrepresents 33.4%of the company’s float, making it greatly influencedby a fewinsiders. The Chairman of the board is CEO Chris Reed. His wife Judy Reed, Mark Harris, DanielS.J. Muffoletto, andMichael Fischmanalso serve on the board of REED. Given the makeupof the board, we have concerns to howthe board could objectively reviewmanagement decisions. It appears that bothDaniel Muffoletto and Michael Fischman have no shares in thecompany, andboth arepaidverylittletoserveon theboard. Fischman is paidonly $750toserve on the board and in 2012 attended less than 75% of the meetings. Total lackof ownership andtheminimal payments todirectors forfulfilling their duties leads us to the assumptionthat theyserveon theboardas a possible favorto Chris Reed. This does not provide sufficient motivation for the directors to adequately review and advise management. These current corporategovernance standards also make it difficult toattract investment from institutional investors. Right now, REEDhas an institutional ownershipof6%, which significantlytrails the industry average of 46%. Thelack ofcorporate governance gives shareholders limitedpower in REED management decisions. This has ledto a recent shareholder proxyinitiative tochange the boardnomination process that ultimatelyfaileddue to insider opposition.A proposal tolimit proxy reviewof executivecompensationto3 years from everyyearalso passedwith insidersupport. Whenshareholders havethe abilityto scrutinize a company’s corporategovernance practices,theycan helptoidentify areas of improvement. Howeverthis onlyhappens if the boardandmanagement promote shareholders engagement andactivelyconsider the interests ofthe shareholders they serve. It is important that the boardandmanagement listen to what theirshareholders have to say andadjust their governance practices when warranted. Thus far the REEDboardhas made noattempt to address these concerns over their corporate governance practices.
- 11. CFA Institute Research Challenge 31 January 2014 11 Appendix 1: Pro Forma Balance Sheet (All figures in Millions) Balance Sheet 2010 2011 2012 2013E 2014E 2015E 2016E 2017E 2018E 2019E 2020E 2021E 2022E 2023E Assets Cash & ST Investments 1.08 0.71 1.16 1.46 1.82 2.28 2.85 3.56 4.45 5.34 6.15 6.76 7.10 7.31 Short-Term Receivables 1.30 1.63 1.96 2.47 3.08 3.85 4.82 6.02 7.52 9.03 10.38 11.42 11.99 12.35 Inventories 4.56 6.10 5.79 7.28 9.10 11.38 14.23 17.78 22.23 26.67 30.68 33.74 35.43 36.49 Other Current Assets 0.22 0.29 0.41 0.52 0.64 0.81 1.01 1.26 1.57 1.89 2.17 2.39 2.51 2.58 Total Current Assets 7.16 8.73 9.32 11.7 14.7 18.3 22.9 28.6 35.8 42.9 49.4 54.3 57.0 58.7 Net Property, Plant& Equipment 3.65 3.51 3.42 4.15 5.19 6.49 8.11 10.14 12.67 15.21 17.49 19.24 20.20 20.80 IntangibleAssets 1.03 1.03 1.03 1.03 1.03 1.03 1.03 1.03 1.03 1.03 1.03 1.03 1.03 1.03 Other Assets 0.05 0.09 0.05 0.05 0.05 0.05 0.05 0.05 0.05 0.05 0.05 0.05 0.05 0.05 Total Assets 11.89 13.36 13.82 16.96 20.93 25.89 32.09 39.84 49.53 59.22 67.94 74.63 78.31 80.63 Liabilities & Shareholders' Equity 2010 2011 2012 2013E 2014E 2015E 2016E 2017E 2018E 2019E 2020E 2021E 2022E 2023E ST Debt & Curr. Portion LT Debt 2.20 3.37 3.36 4.17 5.11 6.27 7.76 9.69 12.02 14.30 16.35 17.93 18.79 19.32 Accounts Payable 2.91 2.42 3.37 4.24 5.30 6.62 8.28 10.35 12.94 15.53 17.85 19.64 20.62 21.24 Other Current Liabilities 0.21 0.28 0.31 0.39 0.49 0.61 0.76 0.95 1.19 1.43 1.64 1.81 1.90 1.95 Total Current Liabilities 5.32 6.07 7.04 8.80 10.90 13.51 16.80 20.99 26.15 31.25 35.85 39.37 41.30 42.52 Term Loan 0.40 0.525 0.525 0.525 0.525 0.525 0.525 0.525 0.525 0.525 0.525 0.525 Long Term FinancingObligation-Net 2.208 2.164 2.083 1.980 1.853 1.674 1.477 1.349 1.248 1.156 1.081 1.015 Capital Leaseequipment 0.10 0.10 0.10 0.10 0.10 0.10 0.10 0.10 0.10 0.10 0.10 0.10 Additional Financing 1.32 2.81 4.40 5.94 8.24 10.79 12.22 11.87 9.08 3.32 4.49 Long-Term Debt 2.41 2.98 2.71 4.10 5.52 7.00 8.42 10.53 12.89 14.19 13.74 10.86 5.03 6.13 Total Liabilities 7.73 9.05 9.75 12.90 16.42 20.51 25.22 31.52 39.03 45.44 49.59 50.23 46.33 48.65 Preferred Stock (CarryingValue) 1.32 1.27 0.56 0.56 0.56 0.56 0.56 0.56 0.56 0.56 0.56 0.56 0.56 0.56 Retained Earnings (18.88) (19.89) (20.46) (20.46) (19.95) (19.00) (17.43) (15.90) (13.63) (10.26) (5.58) 0.59 8.29 8.29 Capital Surplus 21.70 22.92 24.00 24.00 24.00 24.00 24.00 24.00 24.00 24.00 24.00 24.00 24.00 24.00 Common Equity 2.82 3.03 3.54 3.54 4.05 5.00 6.57 8.10 10.37 13.74 18.42 24.59 32.29 32.29 Total Shareholders' Equity 4.38 4.14 4.31 4.10 4.61 5.56 7.13 8.66 10.93 14.30 18.98 25.15 32.85 32.85 Liabilities & Shareholders' Equity 11.87 13.35 13.85 16.96 20.93 25.89 32.09 39.84 49.53 59.22 67.94 74.63 78.31 80.63 Source: Team Estimates, FactSet
- 12. CFA Institute Research Challenge 31 January 2014 12 Appendix 2: Pro Forma Income Statement INCOME STATEMENT 2010 2011 2012 2013E 2014E 2015E 2016E 2017E 2018E 2019E 2020E 2021E 2022E 2023E Sales/Revenue 20.38 25.01 30.01 37.75 47.19 58.98 73.73 92.16 115.20 138.24 158.98 174.87 183.62 189.13 Sales Growth (%) 34% 23% 20% 26% 25% 25% 25% 25% 25% 20% 15% 10% 5% 3% COGS excludingD&A 15.43 16.96 20.13 25.06 30.41 37.71 46.79 58.04 72.04 85.71 97.80 106.73 111.18 113.60 D & A Expense 0.62 0.65 0.74 0.81 0.98 1.21 1.51 1.87 2.32 2.76 3.15 3.44 3.58 3.66 Gross Income 4.34 7.41 9.14 11.88 15.79 20.05 25.44 32.26 40.84 49.77 58.03 64.70 68.86 71.87 Gross Margin (%) 21.3% 29.6% 30.5% 31.5% 33.5% 34.0% 34.5% 35.0% 35.5% 36.0% 36.5% 37.0% 37.5% 38.0% SG&A Expense 5.06 7.66 9.01 11.32 14.16 17.69 22.12 27.65 34.56 41.47 47.69 52.46 55.09 56.74 EBIT (Operating Income) (0.72) (0.25) 0.14 0.56 1.64 2.36 3.32 4.61 6.28 8.29 10.33 12.24 13.77 15.13 EBIT Margin (%) -3.6% -1.0% 0.5% 1.5% 3.5% 4.0% 4.5% 5.0% 5.5% 6.0% 6.5% 7.0% 7.5% 8.0% EBITDA (0.11) 0.40 0.87 1.36 2.62 3.57 4.82 6.48 8.60 11.05 13.48 15.68 17.35 18.79 Interest on CreditLine 0.21 0.26 0.33 0.41 0.52 0.65 0.81 0.97 1.11 1.22 1.29 1.32 Interest on New LT debt 0.00 0.00 0.40 0.63 0.84 1.17 1.54 1.74 1.67 1.24 0.36 0.54 interest on Term Loan 0.18 0.21 0.21 0.21 0.21 0.21 0.21 0.21 0.21 0.21 0.21 0.21 Interest on Capital Leases 0.16 0.18 0.18 0.16 0.18 0.26 0.29 0.26 0.25 0.23 0.21 0.20 Interest Expense 0.59 0.69 0.66 0.66 1.13 1.41 1.75 2.29 2.84 3.18 3.24 2.90 2.07 2.27 EBT (1.31) (0.94) (0.52) (0.10) 0.51 0.95 1.57 2.32 3.44 5.11 7.09 9.34 11.70 12.86 Tax Expense 0.00 0.00 0.00 0.00 (0.17) (0.32) (0.53) (0.79) (1.17) (1.74) (2.41) (3.18) (3.99) (4.40) Offset from Carried Loss 0.17 0.32 0.53 Average Tax Rate 0.0% 0.0% 0.0% 0.0% 34.0% 34.0% 34.0% 34.0% 34.0% 34.0% 34.0% 34.0% 34.1% 34.2% Consolidated Net Income (1.31) (0.94) (0.52) (0.10) 0.51 0.95 1.57 1.53 2.27 3.38 4.68 6.17 7.70 8.46 Net Margin (%) -6.4% -3.8% -1.8% -0.3% 1.1% 1.6% 2.1% 1.7% 2.0% 2.4% 2.9% 3.5% 4.2% 4.5% Preferred Dividends 0.07 0.07 0.05 0.05 0.05 0.05 0.05 0.05 0.05 0.05 0.05 0.05 0.05 0.05 Net Income Available To Common Equity (1.38) (1.01) (0.57) (0.05) 0.47 0.90 1.53 1.49 2.22 3.33 4.64 6.12 7.66 8.41 Retained Earnings (0.05) 0.47 0.90 1.53 1.49 2.22 3.33 4.64 6.12 7.66 Source: Team Estimates, FactSet
- 13. CFA Institute Research Challenge 31 January 2014 13 Appendix 3: Statement of Cash Flows Statementsof Cash Flows 2013 2014 2015 2016 2017 2018 2019 2020 2021 2022 2023 NetProfit (0.30) 0.50 0.92 1.53 1.50 2.23 3.32 4.62 6.09 7.62 8.37 D&A 0.81 0.98 1.21 1.51 1.87 2.32 2.76 3.15 3.44 3.58 3.66 ChangesReceivables (0.51) (0.62) (0.77) (0.96) (1.20) (1.50) (1.50) (1.35) (1.04) (0.57) (0.36) ChangesInventories (1.49) (1.82) (2.28) (2.85) (3.56) (4.45) (4.45) (4.00) (3.07) (1.69) (1.06) ChangesOtherCurrentAssets (0.11) (0.13) (0.16) (0.20) (0.25) (0.31) (0.31) (0.28) (0.22) (0.12) (0.08) ChangesCurrentLiabilities 1.76 2.10 2.61 3.30 4.19 5.16 5.11 4.60 3.52 1.93 1.21 ChangesinNWC (0.35) (0.47) (0.60) (0.71) (0.82) (1.11) (1.16) (1.04) (0.80) (0.45) (0.29) Cash FlowsFrom Operations 0.16 1.01 1.53 2.32 2.54 3.44 4.93 6.73 8.73 10.75 11.75 CAPEX -1.54 -2.02 -2.51 -3.13 -3.90 -4.85 -5.29 -5.43 -5.19 -4.54 -4.26 Cash FlowsFrom Investments -1.54 -2.02 -2.51 -3.13 -3.90 -4.85 -5.29 -5.43 -5.19 -4.54 -4.26 NetDebt 1.40 1.42 1.48 1.42 2.11 2.35 1.30 -0.45 -2.88 -5.83 1.10 DividendsPaid 0.05 0.05 0.05 0.05 0.05 0.05 0.05 0.05 0.05 0.05 0.05 Cash FlowsFrom Financing 1.35 1.37 1.44 1.37 2.07 2.31 1.26 -0.50 -2.93 -5.87 1.06 NetChange in Cash (0.02) 0.36 0.46 0.57 0.71 0.89 0.89 0.80 0.61 0.34 8.54 BeginningCash 1.46 1.82 2.28 2.85 3.56 4.45 5.34 6.15 6.76 7.10 End Cash 1.46 1.82 2.28 2.85 3.56 4.45 5.34 6.15 6.76 7.10 Source: Team Estimates, FactSet
- 14. CFA Institute Research Challenge 31 January 2014 14 Appendix 4: Key Financial Ratios Key Financial Ratios 2010 2011 2012 2013E 2014E 2015E 2016E 2017E 2018E 2019E 2020E 2021E 2022E 2023E Liquidity Ratios Current Ratio(x) 1.35 1.44 1.32 1.33 1.34 1.36 1.36 1.36 1.37 1.37 1.38 1.38 1.38 1.38 Quick Ratio (x) 0.49 0.43 0.50 0.50 0.51 0.51 0.52 0.52 0.52 0.52 0.52 0.52 0.52 0.52 Cash Ratio(x) 0.20 0.12 0.16 0.17 0.17 0.17 0.17 0.17 0.17 0.17 0.17 0.17 0.17 0.17 Efficiency Ratios Total Asset Turnover (x) 1.71 1.87 2.17 2.23 2.25 2.28 2.30 2.31 2.33 2.33 2.34 2.34 2.34 2.35 Fixed Asset Turnover (x) 5.58 7.13 8.77 9.09 9.09 9.09 9.09 9.09 9.09 9.09 9.09 9.09 9.09 9.09 NWC Turnover (x) 11.07 9.40 13.16 12.90 12.56 12.25 12.09 12.07 11.96 11.83 11.75 11.70 11.68 11.66 ReceivablesTurnover (x) 18.78 17.07 16.72 17.06 17.01 17.01 17.01 17.01 17.01 16.70 16.38 16.04 15.68 15.54 Days ifSales Outstanding (days) 19.44 21.38 21.83 21.40 21.46 21.46 21.46 21.46 21.46 21.85 22.29 22.76 23.27 23.49 InventoryTurnover (x) 4.31 3.30 3.51 3.96 3.83 3.80 3.77 3.74 3.72 3.62 3.52 3.42 3.32 3.26 Days of InventoryOn Hand(days) 84.65 110.49 104.01 92.24 95.28 96.04 96.77 97.52 98.20 100.87 103.68 106.71 110.00 111.94 Payables Turnover (x) 8.20 7.18 7.10 7.19 6.96 6.91 6.86 6.81 6.77 6.53 6.29 6.04 5.78 5.65 Number of Days of Payables (days) 44.49 50.80 51.41 50.75 52.41 52.81 53.19 53.58 53.93 55.90 58.04 60.43 63.10 64.57 Cash Conversion Cycle (days) 59.59 81.06 74.43 62.88 64.32 64.69 65.04 65.40 65.72 66.83 67.92 69.04 70.18 70.87 Profitability Ratios Gross Profit Margin(%) 21.28% 29.60% 30.47% 31.47% 33.47% 34.00% 34.50% 35.00% 35.45% 36.00% 36.50% 37.00% 37.50% 38.00% EBIT Margin(%) -3.55% -1.00% 0.45% 1.47% 3.47% 4.00% 4.50% 5.00% 5.45% 6.00% 6.50% 7.00% 7.50% 8.00% EBITDA Margin(%) -0.53% 1.61% 2.91% 3.61% 5.55% 6.06% 6.54% 7.03% 7.46% 8.00% 8.48% 8.97% 9.45% 9.93% Net Profit Margin(%) -6.43% -3.76% -1.75% -0.79% 1.05% 1.56% 2.08% 1.62% 1.93% 2.40% 2.91% 3.48% 4.15% 4.43% ROA (%) -11.02% -7.04% -3.79% -1.76% 2.37% 3.55% 4.77% 3.76% 4.49% 5.61% 6.80% 8.16% 9.73% 10.39% ROE (%) -31.64% -21.9% -12.8% -7.34% 11.02% 17.08% 22.31% 18.00% 21.20% 24.12% 25.17% 24.96% 23.83% 26.19% SG&A/Sale (%) 24.83% 30.60% 30.02% 30.00% 30.00% 30.00% 30.00% 30.00% 30.00% 30.00% 30.00% 30.00% 30.00% 30.00% Solvency Ratios Debt Ratio (%) 38.77% 47.53% 43.89% 48.79% 50.81% 51.27% 50.42% 50.75% 50.28% 48.11% 44.29% 38.57% 30.41% 31.57% Debt to EquityRatio(x) 1.11 1.48 1.48 2.04 2.36 2.47 2.36 2.43 2.37 2.07 1.64 1.18 0.74 0.80 EquityMultiplier (x) 2.87 3.11 3.37 4.18 4.64 4.81 4.67 4.79 4.72 4.30 3.70 3.06 2.45 2.52 Long term Debt Ratio(%) 20.27% 22.31% 19.57% 24.20% 26.38% 27.04% 26.24% 26.44% 26.01% 23.96% 20.22% 14.55% 6.42% 7.60% Interest Coverage Ratio (x) -1.24 -0.36 0.21 0.65 1.43 1.64 1.86 1.97 2.16 2.55 3.10 4.07 6.25 6.30 Source: Team Estimates, FactSet
- 15. CFA Institute Research Challenge 31 January 2014 15 Appendix 5: DCF Valuation FREE CASH FLOW EQUITY 2013E 2014E 2015E 2016E 2017E 2018E 2019E 2020E 2021E 2022E 2023E NET INCOME -0.05 0.50 0.92 1.53 1.50 2.23 3.32 4.62 6.09 7.62 8.37 P Dividend 0.05 0.05 0.05 0.05 0.05 0.05 0.05 0.05 0.05 0.05 0.05 NetCapex 0.73 1.04 1.30 1.62 2.03 2.53 2.53 2.28 1.75 0.96 0.61 ChangesInNWC -0.35 -0.47 -0.60 -0.71 -0.82 -1.11 -1.16 -1.04 -0.80 -0.45 -0.29 NetDebt 0.08 2.63 1.41 1.34 2.03 2.27 1.21 -0.56 -3.00 -5.96 1.10 DebtRatio 0.74 0.78 0.79 0.78 0.78 0.78 0.76 0.72 0.66 0.58 0.59 FCFE -0.45 0.06 0.39 0.88 0.71 1.22 2.22 3.49 5.05 6.93 7.96 Terminal Value 176.38 Total FCFE -0.18 0.33 0.73 1.29 1.20 1.88 2.96 4.24 5.74 183.75 EquityValue 106.42 114.24 Numberof shares 13.50 13.50 Share Price $7.88 $8.46 Model Returns 2014 Price 8.46 Jan 28 2014 Price 7.19 Potential Upside 18% Net CAPEX = CAPEX - Depreciation Net Debt = New Debt Issued – Debt Paid Source: Team Estimates, FactSet, Damodaran Market Risk Premiums CAPM RiskFree 3.04% 10 Year TreasuryNote 12/31/2013 Market Premium 4.96% 2014 Estimate Beta 0.93 FactSetEstimate Cost of Equity 7.65%
- 16. CFA Institute Research Challenge 31 January 2014 16 Appendix 6: Multiples Valuation Price/Sales 2008 2009 2010 2011 2012 2013 2014 E Dr PepperSnapple Group,Inc. 0.72x 1.31x 1.51x 1.48x 1.56x 1.66x 1.63x MonsterBeverage Corporation 3.16x 3.18x 3.73x 5.05x 4.69x 5.41x 5.10x PepsiCo,Inc. 2.03x 2.22x 1.82x 1.59x 1.65x 1.95x 1.91x The Coca-ColaCompany 3.31x 4.27x 4.37x 3.48x 3.46x 3.94x 3.86x Average 2.31x 2.74x 2.86x 2.90x 2.84x 3.24x 3.12x Reed's,Inc. 0.64x 0.87x 1.00x 0.48x 2.15x 3.04x Discount 72.26% 68.28% 64.84% 83.49% 24.29% 6.33% DiscountAverage 72.22% 15.31% Price/Sales 2014E P/SPeersMedian 3.12 Applieddiscount 25% Target P/S 2.34 Sales(millions) $47.19 # of sharesoutstanding(millions) 13.5 Price from P/S $8.19 Additional Explanations For 2013, our multiples were based off of year end 2013 market cap divided by the sum of YTD Q3 revenues and Q4 revenues of 2012. We did this because 2013 Q4 earnings reports have not come out yet for REED or its peers. However, we do not anticipate that this will be an issue as we assume that the multiples will not change very much after Q4 earnings reports come out. Appendix 7: Weighting of Valuations WeightingofDCF and Multiples Price from Relative Valuation $8.19 Weightof Relative Valuation 50% Price from DCF $8.46 Weightof DCF 50% Price per share (endof 2014) $8.33 Price pershare (January28, 2014) $7.19 Potential Upside 15.86% Source: Team Estimates. FactSet
- 17. CFA Institute Research Challenge 31 January 2014 17 Appendix 8: Intermediate Sales Growth/Cost of Capital Sensitivity Analysis 10% BelowJan28 Price Above Jan28 Price 20% Above Jan28 Price Cost Of Capital 12.96% 11.97% 10.98% 9.98% 8.99% 8.00% 7.65% 7.26% 6.76% 6.51% 6.02% Intermediate 40% $ 5.89 $ 6.78 $ 7.90 $ 9.36 $ 11.32 $ 14.10 $ 15.36 $ 17.06 $ 19.70 $ 21.30 $ 25.31 Term 30% $ 3.99 $ 4.60 $ 5.36 $ 6.35 $ 7.69 $ 9.58 $ 10.43 $ 11.59 $ 13.38 $ 14.47 $ 17.20 Growth 25% $ 3.23 $ 3.72 $ 4.33 $ 5.14 $ 6.23 $ 7.76 $ 8.46 $ 9.39 $ 10.85 $ 11.74 $ 13.95 (2014-2018) 23% $ 2.95 $ 3.40 $ 3.96 $ 4.70 $ 5.70 $ 7.10 $ 7.74 $ 8.60 $ 9.94 $ 10.75 $ 12.78 22% $ 2.82 $ 3.24 $ 3.79 $ 4.49 $ 5.44 $ 6.79 $ 7.40 $ 8.22 $ 9.50 $ 10.27 $ 12.22 20% $ 2.56 $ 2.95 $ 3.45 $ 4.09 $ 4.96 $ 6.19 $ 6.75 $ 7.50 $ 8.67 $ 9.37 $ 11.15 19% $ 2.44 $ 2.81 $ 3.29 $ 3.90 $ 4.73 $ 5.90 $ 6.43 $ 7.15 $ 8.27 $ 8.94 $ 10.64 18% $ 2.32 $ 2.68 $ 3.13 $ 3.71 $ 4.50 $ 5.62 $ 6.13 $ 6.81 $ 7.88 $ 8.52 $ 10.14 15% $ 1.99 $ 2.30 $ 2.68 $ 3.19 $ 3.87 $ 4.84 $ 5.27 $ 5.87 $ 6.78 $ 7.34 $ 8.74 10% $ 1.50 $ 1.74 $ 2.03 $ 2.42 $ 2.95 $ 3.69 $ 4.03 $ 4.49 $ 5.19 $ 5.62 $ 6.70 5% $ 1.09 $ 1.26 $ 1.49 $ 1.78 $ 2.17 $ 2.73 $ 2.99 $ 3.33 $ 3.86 $ 4.19 $ 5.00 3% $ 0.94 $ 1.10 $ 1.29 $ 1.55 $ 1.90 $ 2.39 $ 2.62 $ 2.92 $ 3.39 $ 3.68 $ 4.40 This chart represents 2014E prices with a range of estimates of Intermediate Term Growth and a range of estimates of for Cost of Capital. Source: Team Estimates
- 18. CFA Institute Research Challenge 31 January 2014 18 Appendix 9: Long-Term Growth Rate/Long-Term Cost of Capital Sensitivity Analysis 10% BelowJan28 Price Above Jan28 Price 20% Above Jan28 Price Long Term Cost of Capital 12.96% 11.97% 10.98% 9.98% 8.99% 8.00% 7.65% 7.26% 6.76% 6.51% 6.02% Long 5% $ 5.49 $ 6.10 $ 6.91 $ 8.05 $ 9.74 $ 12.56 $ 14.05 $ 16.30 $ 20.56 $ 23.73 $ 34.72 Term 4.50% $ 5.23 $ 5.76 $ 6.46 $ 7.41 $ 8.78 $ 10.92 $ 11.99 $ 13.54 $ 16.24 $ 18.09 $ 23.61 Growth 4% $ 5.00 $ 5.47 $ 6.07 $ 6.88 $ 8.00 $ 9.68 $ 10.49 $ 11.62 $ 13.49 $ 14.70 $ 18.01 Rate 3.75% $ 4.89 $ 5.33 $ 5.90 $ 6.64 $ 7.67 $ 9.17 $ 9.88 $ 10.86 $ 12.45 $ 13.46 $ 16.14 3.50% $ 4.79 $ 5.21 $ 5.74 $ 6.43 $ 7.37 $ 8.72 $ 9.35 $ 10.21 $ 11.58 $ 12.43 $ 14.64 3.25% $ 4.69 $ 5.09 $ 5.58 $ 6.23 $ 7.09 $ 8.32 $ 8.88 $ 9.64 $ 10.83 $ 11.56 $ 13.41 3% $ 4.60 $ 4.97 $ 5.44 $ 6.04 $ 6.84 $ 7.95 $ 8.46 $ 9.13 $ 10.18 $ 10.81 $ 12.39 2.75% $ 4.51 $ 4.87 $ 5.31 $ 5.87 $ 6.61 $ 7.63 $ 8.08 $ 8.68 $ 9.61 $ 10.16 $ 11.52 2.50% $ 4.43 $ 4.77 $ 5.18 $ 5.71 $ 6.39 $ 7.33 $ 7.74 $ 8.28 $ 9.10 $ 9.59 $ 10.77 2.25% $ 4.35 $ 4.67 $ 5.06 $ 5.56 $ 6.19 $ 7.05 $ 7.43 $ 7.92 $ 8.66 $ 9.09 $ 10.13 2% $ 4.27 $ 4.58 $ 4.95 $ 5.41 $ 6.01 $ 6.80 $ 7.15 $ 7.59 $ 8.26 $ 8.64 $ 9.56 1.50% $ 4.13 $ 4.41 $ 4.74 $ 5.16 $ 5.68 $ 6.36 $ 6.65 $ 7.02 $ 7.57 $ 7.89 $ 8.62 1% $ 4.00 $ 4.26 $ 4.56 $ 4.93 $ 5.39 $ 5.98 $ 6.23 $ 6.55 $ 7.00 $ 7.27 $ 7.86 This chart represents 2014E prices with different estimates for Long Term Growth rates along with different estimates for cos t of capital in the terminal scenario. Source: Team Estimates
- 19. CFA Institute Research Challenge 31 January 2014 19 Appendix 10: Intermediate Term Growth/Long-Term Growth Sensitivity Analysis 10% BelowJan28 Price Above Jan28 Price 20% Above Jan28 Price Long Term Growth 5% 4.50% 4% 3.75% 3.50% 3.25% 3% 2.75% 2.50% 2.25% 2% 1.50% 1% 40% $ 25.47 $ 21.74 $ 19.04 $ 17.95 $ 16.98 $ 16.13 $ 15.37 $ 14.69 $ 14.07 $ 13.51 $ 13.01 $ 12.11 $ 11.35 Intermediate 30% $ 17.31 $ 14.77 $ 12.93 $ 12.19 $ 11.54 $ 10.96 $ 10.44 $ 9.98 $ 9.56 $ 9.18 $ 8.83 $ 8.22 $ 7.70 Term 25% $ 14.06 $ 11.99 $ 10.49 $ 9.89 $ 9.36 $ 8.88 $ 8.46 $ 8.08 $ 7.74 $ 7.43 $ 7.15 $ 6.65 $ 6.23 Growth 23% $ 12.88 $ 10.99 $ 9.61 $ 9.05 $ 8.56 $ 8.13 $ 7.74 $ 7.40 $ 7.08 $ 6.80 $ 6.54 $ 6.09 $ 5.70 2014-2018 22% $ 12.32 $ 10.50 $ 9.19 $ 8.66 $ 8.19 $ 7.77 $ 7.40 $ 7.07 $ 6.77 $ 6.50 $ 6.25 $ 5.81 $ 5.44 20% $ 11.25 $ 9.59 $ 8.38 $ 7.90 $ 7.47 $ 7.09 $ 6.75 $ 6.45 $ 6.17 $ 5.92 $ 5.70 $ 5.30 $ 4.96 19% $ 10.73 $ 9.15 $ 8.00 $ 7.53 $ 7.12 $ 6.76 $ 6.44 $ 6.15 $ 5.89 $ 5.65 $ 5.43 $ 5.05 $ 4.73 18% $ 10.23 $ 8.72 $ 7.62 $ 7.18 $ 6.79 $ 6.44 $ 6.13 $ 5.86 $ 5.61 $ 5.38 $ 5.17 $ 4.81 $ 4.50 15% $ 8.83 $ 7.52 $ 6.57 $ 6.18 $ 5.85 $ 5.55 $ 5.28 $ 5.04 $ 4.82 $ 4.63 $ 4.45 $ 4.13 $ 3.86 10% $ 6.78 $ 5.77 $ 5.03 $ 4.73 $ 4.47 $ 4.24 $ 4.03 $ 3.85 $ 3.68 $ 3.53 $ 3.39 $ 3.14 $ 2.94 5% $ 5.07 $ 4.30 $ 3.74 $ 3.52 $ 3.32 $ 3.14 $ 2.99 $ 2.85 $ 2.72 $ 2.60 $ 2.50 $ 2.31 $ 2.16 3% $ 4.47 $ 3.79 $ 3.29 $ 3.09 $ 2.91 $ 2.76 $ 2.62 $ 2.49 $ 2.38 $ 2.28 $ 2.19 $ 2.02 $ 1.88 This chart represents 2014E prices for different estimates of long and intermediate term sales growth. Source: Team Estimates
- 20. CFA Institute Research Challenge 31 January 2014 20 Appendix 11: Capital Lease/Term Loan Payment Schedules Capital Lease Payment Schedule Term Loan Payment Schedule Year Year End Balance Payment Year Balance Payment 2012 2,874,000 2012 575,000 2013 2,784,000 90,000 2013 399,000 176,000 2014 2,673,000 111,000 2014 195,000 204,000 2015 2,539,000 134,000 2015 0 195,000 2016 2,378,000 161,000 2017 2,188,000 190,000 2018 1,971,388 216,612 2019 1,776,221 195,167 2020 1,600,375 175,846 2021 1,441,938 158,437 2022 1,299,186 142,752 2023 1,170,566 128,619 Source: Team Estimates
- 21. CFA Institute Research Challenge 31 January 2014 21 Appendix 12: REED Porter Five Forces Analysis Barriers toEntry: Low-Medium ● Anyone may create newsoft drinks as the onlylimitation is in patentedflavors andbrands ● Existingfirms withlarge capital expenditures have economies ofscale, direct supplyanddistributionchannels set up ● Barriers are lowwith no consumer switchingcosts andzerocapital requirements ● Prices are competitive andfluctuate slightly dependingon location ● Major players haveflavor identities givingthemmore recognition ● Major brands have positionedthemselves in the maindistribution channels includingsuper markets, gas stations andrestaurants ● Licenses, insurances,andFDA approvalare requiredtoproduce anddistributeproducts andcoverpotential lawsuits ● Existingfirms have cost andperformance advantage andare able experience economies of scale ● Bottling, distribution,andstorage canbe contractedout Intensityof Rivalry:High ● Costs for warehouse, trucks andlabor maybe substantial fixed costs ● Exitingthe market mayresult in huge losses due to bindingcontracts, fixedcosts andmarketingcosts ● Many beverage firms exists and are rollingout innovative products with trendy flavors ● Greater development anduse of natural ingredients for health benefits ● Firms are focusedon expandingtheirbeverage portfolios ● Natural premiumis growingandmajor firms have significant market share in CSDs, ready-to-drink teas, andenergydrinks ● Equipment is firm specific and may be difficult toliquidate ● Customers wouldnot incur high costs fromswitchingfrom one player toanother ● No needfor significant customer-producer interactionsince purchaseproducts dependon tastes ● Market is a differentiatedproduct oligopolyin promotional pricingandnewbrands ● Existenceof well establisheddistributionchannels, relationships with suppliers,retailers, andbrandvalue tocustomers ● Market shares in the industryare not more-or-less equally distributedamongcompetitors. This is evident because there are three main firms that own approximately 87% ofthe industry,yet there are over100companies in the industry. Threat of Substitutes: High ● Substitutes do not haveperformance limitations or highprices ● Substitutes are not pricedat a high enough cost whereit wouldaffect theiruse as a mainlandproduct ● Customers wouldnot incur costs in switchingtosubstitutes as switchingfor a customer wouldbe difference ofcents. ● Substitutes such as water, ready-to-drinktea andcoffee, sports drinks,andenergy drinks exist ● Consumers are brandnameloyalas theyhave consumedcertain beverages as longas they canremember ● Players have a wide portfolioof products forconsumers tochoose from BargainingPower ofBuyers:High ● Soft drink market is the largest accountingforan annual sales of $60billion ● Three firms control 89% of theUnitedStates soft drinksales ● Average Americanconsumes over56 gallons of soda a year ● Average soft drinkcosts under $2which makes eachindividual purchase relatively immaterial ● All information such as nutritionfacts andingredients are listedon thelabel ● Manufacturing own soft drinkis inconvenient consideringhowinexpensive the product is ● Customers are highlysensitivetothe price of soft drinks andare willingto change brands if onebecomes more costly ● Major players havedevelopedsignificant brandloyalty ● Firms provide incentives tocustomers such as contests andadmissiondiscounts to theme parks enticingcustomers tochoose a specific brand BargainingPower ofSuppliers: Low ● Inputs usedto create products mayby unique andextremelydifferentiatedsuch as in formula, color,andflavor ● Product innovation is neededtosatisfy consumer’s needfora varietyof taste ● Firms can switch between suppliers veryquickly andeasily ● Suppliers to the industry arebottlingequipment manufacturers andsecondary packagingsuppliers ● Surplus of suppliers exists that canprovide sameproducts ● Firms have power toselect suppliers that do the best jobat the best price ● Soft drink companies own a portionof their own supplycompanies enablingeasy access toenterthe supplierforthe soft drink industry ● Suppliers main revenue come fromdelivering soft drink beverages andequipment for the firms directlytocustomers ● Soft drink main ingredients include carbonatedwater, spices, roots toname a few ● Suppliers are not concentratedor differentiated
- 22. CFA Institute Research Challenge 31 January 2014 22 Porter'sFive Forces Analysis Rating Barriers to Entry: Low-Medium 2 Intensity of Rivalry: High 5 Threat of Substitutes: High 5 Bargaining Power of Buyers: High 5 Bargaining Power of Suppliers: Low 1 Final Rating: 3.6 0 1 2 3 4 5 Barriers to Entry: Low- Medium Intensity of Rivalry: High Threat of Substitutes: High Bargaining Power of Buyers: High Bargaining Power of Suppliers: Low Porter's Five Forces Analysis Scale Rating High 5 Medium-High 4 Medium 3 Low-Medium 2 Low 1
- 23. CFA Institute Research Challenge 31 January 2014 23 Appendix 13: Industry Five Forces Analysis 0 1 2 3 4 5 Buyer Power Supplier Power SubstituteNew Entrants Degree of Rivalry Force Driving Competition in the Functional Drinks Market in the U.S., 2011 0 1 2 3 4 5 Backwards integration Buyer independence Buyer size Financial muscle Low Cost switchingOligosony threat Price sensitivity Product dispensability Tendy to switch Drivers of Buyer Power in the Functional Drinks Market in the U.S., 2011 0 1 2 3 4 5 Differentiated input Forward integration No substitute inputs Oligopoly threatPlayer dispensability Player independence Supplier size Switching costs Drivers of Supplier Power in the Functional Drinks Market in the U.S., 2011
- 24. CFA Institute Research Challenge 31 January 2014 24 Source: Team Estimates 0 1 2 3 4 5 Undifferentiated… Weak brands Distribution accessible Little IP involved Little regulationLow fixed costs Low cost switching Market Growth Scale unimportant Suppliers acessbile Factors Influencing the Likelihood of New Entrants in the Functional Drinks Market in the U.S., 2011 0 1 2 3 4 5 Zero sum game Competitor size Easy to expand Hard to exit Lack of diversity Low cost switchingLow fixed costs Number of players Similarity of players Storage costs Undifferentiated product Drivers of Degree of Rivalry in the Functional Drinks Market in the U.S., 2011 0 1 2 3 4 5 Low cost switching Beneficial alternativeCheap alternative Factors Influencing the Threat of Substitutes in the Functional Drinks Market in the U.S., 2011
- 25. CFA Institute Research Challenge 31 January 2014 25 APPENDIX 14: Price to Sales Multiple vs. Peer Group Source: FactSet 0.00x 1.00x 2.00x 3.00x 4.00x 5.00x 6.00x 2008 2009 2010 2011 2012 2013 2014 E Competitor: Priceto Sales Multiplier Dr. Pepper Snapple Group, Inc. Monster BeverageCorporation PepsiCo, Inc. The Coca-Cola Company Reed's, Inc. Average
- 26. CFA Institute Research Challenge 31 January 2014 26 APPENDIX 15: DuPont Analysis Source: FactSet, Team Estimate DuPont Analysis 2007 2008 2009 2010 2011 2012 2013E 2014E 2015E 2016E 2017E 2018E 2019E 2020E 2021E 2022E 2023E Equity Multiplier 1.39 2.30 2.28 2.87 3.11 3.37 4.18 4.64 4.81 4.67 4.79 4.72 4.30 3.70 3.06 2.45 2.52 Profit Margin -42.5% -25.0% -16.9% -6.4% -3.8% -1.7% -0.8% 1.1% 1.6% 2.1% 1.6% 1.9% 2.4% 2.9% 3.5% 4.1% 4.4% TAT 1.29 1.68 1.52 1.71 1.87 2.17 2.23 2.25 2.28 2.30 2.31 2.33 2.33 2.34 2.34 2.34 2.35 ROA -55.0% -41.9% -25.6% -11.0% -7.0% -3.8% -1.8% 2.4% 3.6% 4.8% 3.8% 4.5% 5.6% 6.8% 8.2% 9.7% 10.4% ROE -76.7% -96.3% -58.6% -31.6% -21.9% -12.8% -7.3% 11.0% 17.1% 22.3% 18.0% 21.2% 24.1% 25.2% 25.0% 23.8% 26.2%
- 27. CFA Institute Research Challenge 31 January 2014 27 DuPont Analysis Cont. Source: FactSet, Team Estimates Return On Equity -7.3% 11.0% 17.1% 22.3% 18.0% 21.2% 24.1% 25.2% 25.0% 23.8% 26.2% Return On Assets -1.8% 2.4% 3.6% 7.8% 3.8% 4.5% 5.6% 6.8% 8.2% 9.7% 10.4% Profit Margin -0.8% 1.1% 1.6% 2.1% 1.6% 1.9% 2.4% 2.9% 3.5% 4.1% 4.4% Asset Turnover 2.23 2.25 2.28 2.30 2.31 2.33 2.33 2.34 2.34 2.34 2.35 Equity Multiplier 4.8 4.64 4.81 4.67 4.79 4.72 4.30 3.70 3.06 2.45 2.52 Legend (Years) '13 '14 '15 '16 '17 '18 '19 '20 '21 '22 '23
- 28. CFA Institute Research Challenge 31 January 2014 28 APPENDIX 16: Margin & Sales Forecasts -5% 0% 5% 10% 15% 20% 25% 30% 35% 40% AnnualSalesGrowth Sales Growth Actual Forecast 0.0% 5.0% 10.0% 15.0% 20.0% 25.0% 30.0% 35.0% 40.0% GrossMargin Gross Margin Actual Forecast
- 29. CFA Institute Research Challenge 31 January 2014 29 Source: FactSet, Team Estimates -50% -40% -30% -20% -10% 0% 10% 20% OperatingMargin Operating Margin Actual Forecast -50.0% -40.0% -30.0% -20.0% -10.0% 0.0% 10.0% NetMargin Net Margin Actual Forecast